 |
|
Dry Conditions in North Central WA
10/5/2009 This year's summer was warm and dry throughout the state. According to the National Climatic Data Center (NCDC), the mean temperature for June-July-August averaged over the entire state was 65.9 degrees Fahrenheit, ranking as the 8th warmest in 115 years (Figure 1). The state was also relatively dry as well, with the average precipitation of 2.12 inches ranking as the 13th driest JJA in 115 years (Figure 2). The thick, black line in the figures represents the 1901-2000 average. Two previous write-ups in the Events section of our website describe the dryness experienced in early summer and the western WA July heatwave that contributed to these average statistics. The area that was impacted the greatest from the dry conditions was the north central portion of the state, namely the Upper Columbia basin (primarily Okanogan, Chelan, and Douglas counties). This area had particularly low snowpack: on April 1, 2009 the Upper Columbia basin was at 67% of normal. The dry summer conditions did not provide any relief for the farmers and ranchers in the area that were already suffering from the below normal snowpack. Table 1 shows the monthly total precipitation for several stations in the area compared to their 30-year normal. For June and August, all of the stations received below normal precipitation. In July and September some stations received more than normal precipitation, but the majority received well below normal. A drought was not declared for any part of the state, but Governor Gregoire requested that six Washington counties be declared federal farm disaster areas on September 28. This declaration will give farmers and ranchers (i.e. those that have primarily affected by this) more options for low-interest loans to help pay for damages from the drought. The counties named were Chelan, Douglas, Ferry, Grant, Lincoln, and Okanogan. The Governor's statement can be read here. 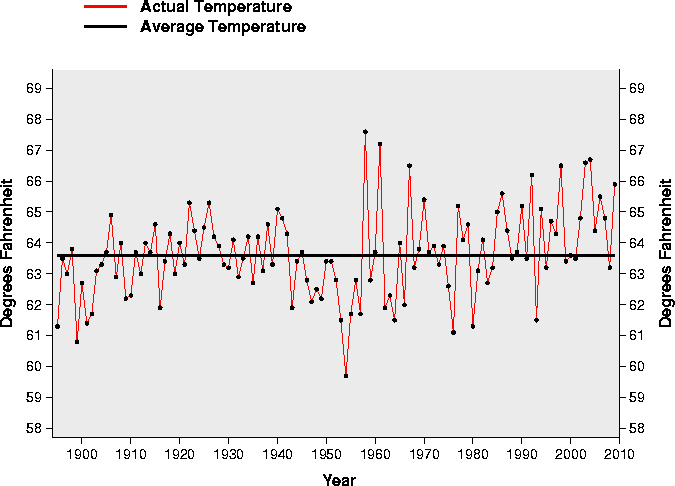
Figure 1: Yearly June-July-August mean temperature (F) averaged over the entire state. The thick, black line is the 1901-2000 average (from NCDC). Please click on the figure to see the full-size image. 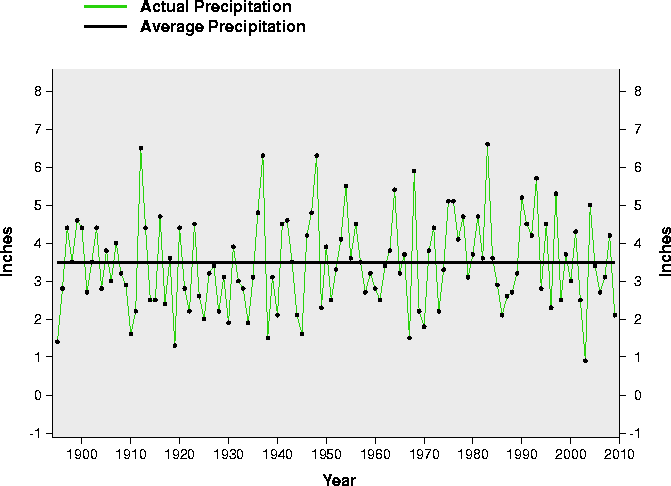
Figure 2: Yearly June-July-August precipitation (inches) averaged over the entire state. The thick, black line is the 1901-2000 average (from NCDC). Please click on the figure to see the full-size image. 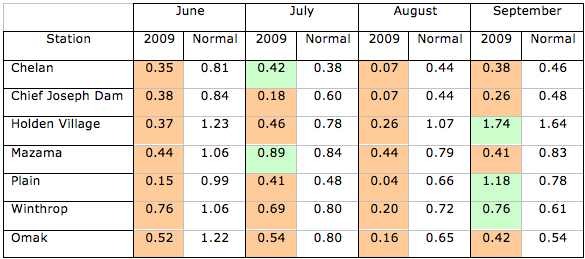
Table 1: Monthly precipitation totals (inches) for stations in north central WA. The measurements have not yet gone through quality-control at NCDC, and they should be considered preliminary. Please click on the table to see the full-size image.
|


 |