 |
|
Monitoring Precipitation near the Howard Hanson Dam
As you are probably aware, the heavy rainfall in January 2009 damaged the Howard Hanson Dam (located on the Green River in King County). For more background information, please see our 2010 Water Year monitoring page. The good news is that there were not any incidents of flooding during the 2009-2010 wet season, and the water year precipitation was below normal (thanks, in part, to the El Niño). This year is on tap for a La Niña (see our outlook) which means that there is a higher chance of a wet fall and a cold winter. This does not necessarily mean flooding, however, and more 2010 summer time tests show that the dam is in better shape than it was this time last year (i.e. beginning of the water year). The grout curtain installed last summer is working well, and the chances of significant flooding downstream are 1 in 60. At the time of design, the flood risk was 1 in 140, and that risk should be restored by Fall 2011. We will continue to post the total water year precipitation at one site near the dam for this water year so that it can easily be compared to the average precipitation and to other years. More real-time information regarding conditions near the dam can be found at the Naptional Weather Service Seattle site. Background information and updates can be found at the Army Corps of Engineers Seattle District site. Figure 1 shows a map of the stations in the vicinity of the Howard Hanson Dam, with some of them labeled. The dam and the reservoir are enclosed in the black box on the map. To find out more about the stations near the dam, visit our Climate Inventory Map. One station near the dam (Cougar Mountain SnoTel) reports real-time precipitation data, and the accumulated precipitation for the 2011 water year (Oct 1, 2010 through Sept 30, 2011) will be plotted on this page compared to the 1971-2000 normal (Figure 2). The 2009 and 2010 water year accumulated precipitation is also plotted. This information will be updated in near real-time to monitor the precipitation in the dam vicinity compared to the 30-year normal. 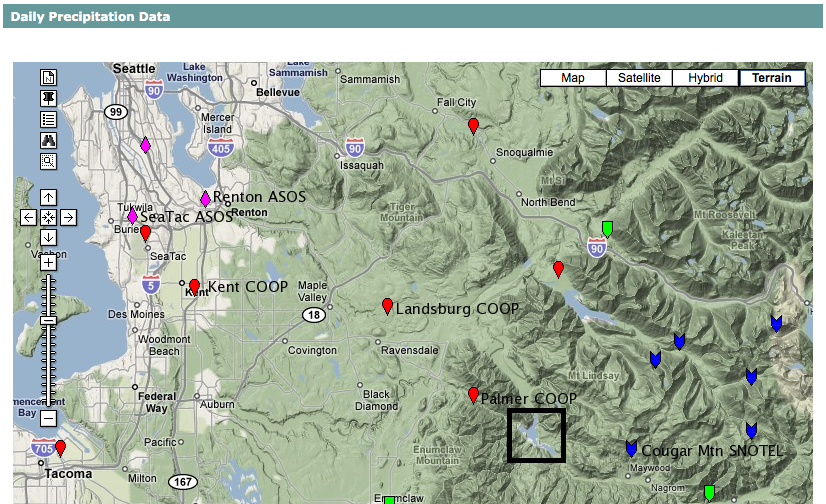
Figure 1: Stations around the Howard Hanson Dam (enclosed in the black box). Selected stations are labeled. Please click on the figure to see the full-size image. 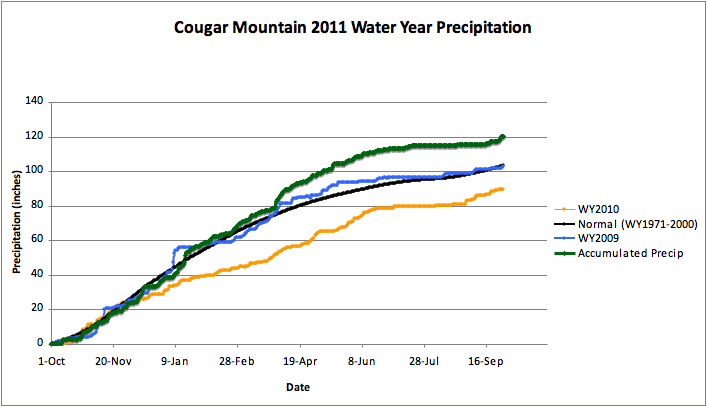
Figure 2: 2011 water year accumulated precipitation for Cougar Mountain SnoTel (green) compared to the 30-year normal (black). The accumulated precipitation for the 2009 water year (blue) and 2010 water year (orange) are also plotted. Please click on the figure to see the full-size image.
|


 |