 |
|
Mid-Winter La Niña Update
1/27/2011 The La Niña winter is now halfway over, and with the recent mild temperatures experienced around the state this January, it is a good time to evaluate how this winter is shaping up. Thus far, January has been rather warm, inconsistent with typical winters in WA State during La Niña. Looking back at the average temperature departure from normal over October, November, and December (OND), we can see that most of the state experienced an average temperature within 1 degree Fahrenheit of normal (Fig. 1). Some areas in eastern WA had an OND average temperature above normal, though, with temperatures between 1 and 3 degrees Fahrenheit above normal. Precipitation, on the other hand, has been above normal for the same period (Fig. 2) for a majority of the state, consistent with the shift in the odds that is associated with a La Niña winter. On the other hand, some parts of the northern Puget Sound region and the northern Cascades received below normal precipitation during OND (70-90% of normal). 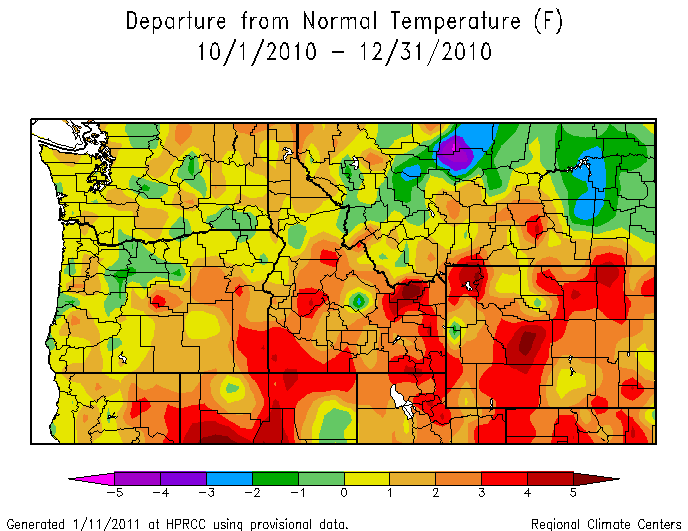
Figure 1: The average temperature departure from normal (1971-2000) throughout the Northwest for October-November-December 2010. Please click on the figure to see the full-size image. 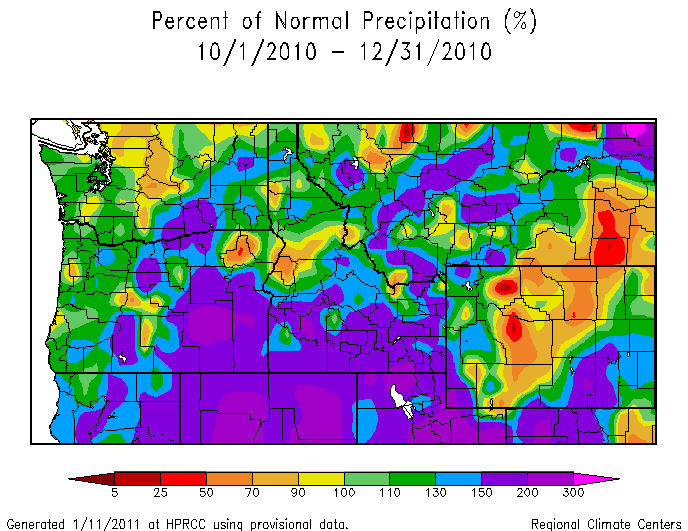
Figure 2: The precipitation percent of normal (1971-2000) throughout the Northwest for October-November-December 2010. Please click on the figure to see the full-size image. At this point in the season, the temperatures have not been that cold, except for a few episodes of modified arctic air in the region. Precipitation amounts have also not been that unusual, and have generally been as expected for a La Niña. This can be attributed to the seasonal averaged atmospheric circulation, here summarized in terms of the distribution of anomalous 500 mb geopotential height for October-December 2010 (Fig. 3). This distribution features higher than normal heights over the Aleutians and northeast Canada, and lower than normal heights off the coasts of Washington and the mid-Atlantic states. The overall pattern is similar to that expected during La Niña, as illustrated (Fig. 4) by the OND height anomalies regressed onto the multivariate ENSO index (MEI). But the devil is in the details, of course, and in this instance the 500 mb height anomalies during OND of 2010 imply anomalous flow from the south for Washington State versus the westerly flow more typical of past La Niña events. This quirk of the present winter so far can explain the relatively mild temperatures of our region and the wet weather to our south. These kinds of smaller-scale aspects of the seasonal circulation and weather appear to be more or less random, as compared with the more robust signals on larger-scales associated with La Niña (and El Niño). Finally, with La Niña conditions still occurring in the tropical Pacific, and with February and March still remaining, it is probably premature to pack away your winter coat quite yet. 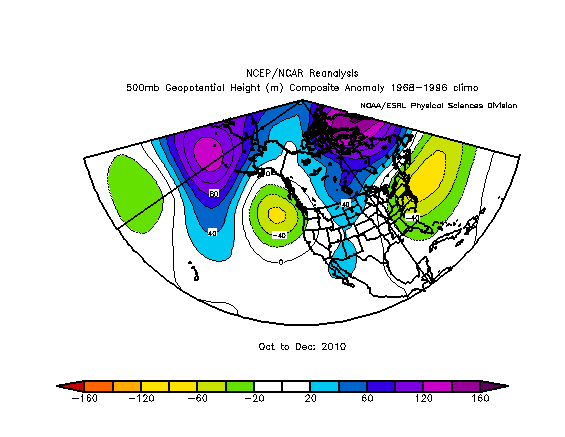
Figure 3: The 500 mb geopotential height composite anomalies (1968-1996 normal) for October-November-December 2010 from ESRL. 
Figure 4: Regression of the October-December 500 mb geopotential height anomalies onto the multivariate ENSO index (MEI) for the period 1950 to 2007. Positive values of the MEI correspond with El Niño, opposite to the distribution of 500 mb anomalies typically accompanied by La Niña. The color bar of this figure is opposite to that of Figure 3 to facilitate direct comparsion between the two figures.
|


 |