 |
|
A Review of Winter 2014-2015
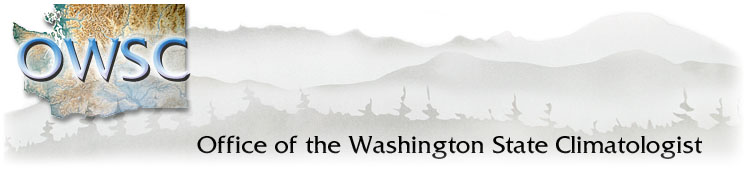
4/23/2015 The summer and fall 2014 predictions for the winter of 2014-15 were favoring warm and dry conditions for WA State based mostly on the expectation of moderate El Niño development. The El Niño was late to develop, so how did the winter play out? This report summarizes the winter El Niño-Southern Oscillation (ENSO) conditions, snowpack, average temperature and precipitation anomalies for Washington State, and the seasonal variations in the weather. Figure 1 shows the sea surface temperature (SST) anomalies from January 2006 through March 2015 in the Niño 3.4 region of the equatorial Pacific Ocean. SSTs were generally on the warm side for winter 2014-15, especially in November, but an El Niño wasn't declared by the Climate Prediction Center until March 5. Though the SSTs were warmer than normal for a majority of the winter, the El Niño atmospheric component was borderline until the end of the winter. Westerly winds and increased rainfall in the western and central tropical Pacific, among other factors, indicated the transition of the atmosphere into a state of El Niño. ENSO models indicate that the weak-moderate El Niño will last through the summer. 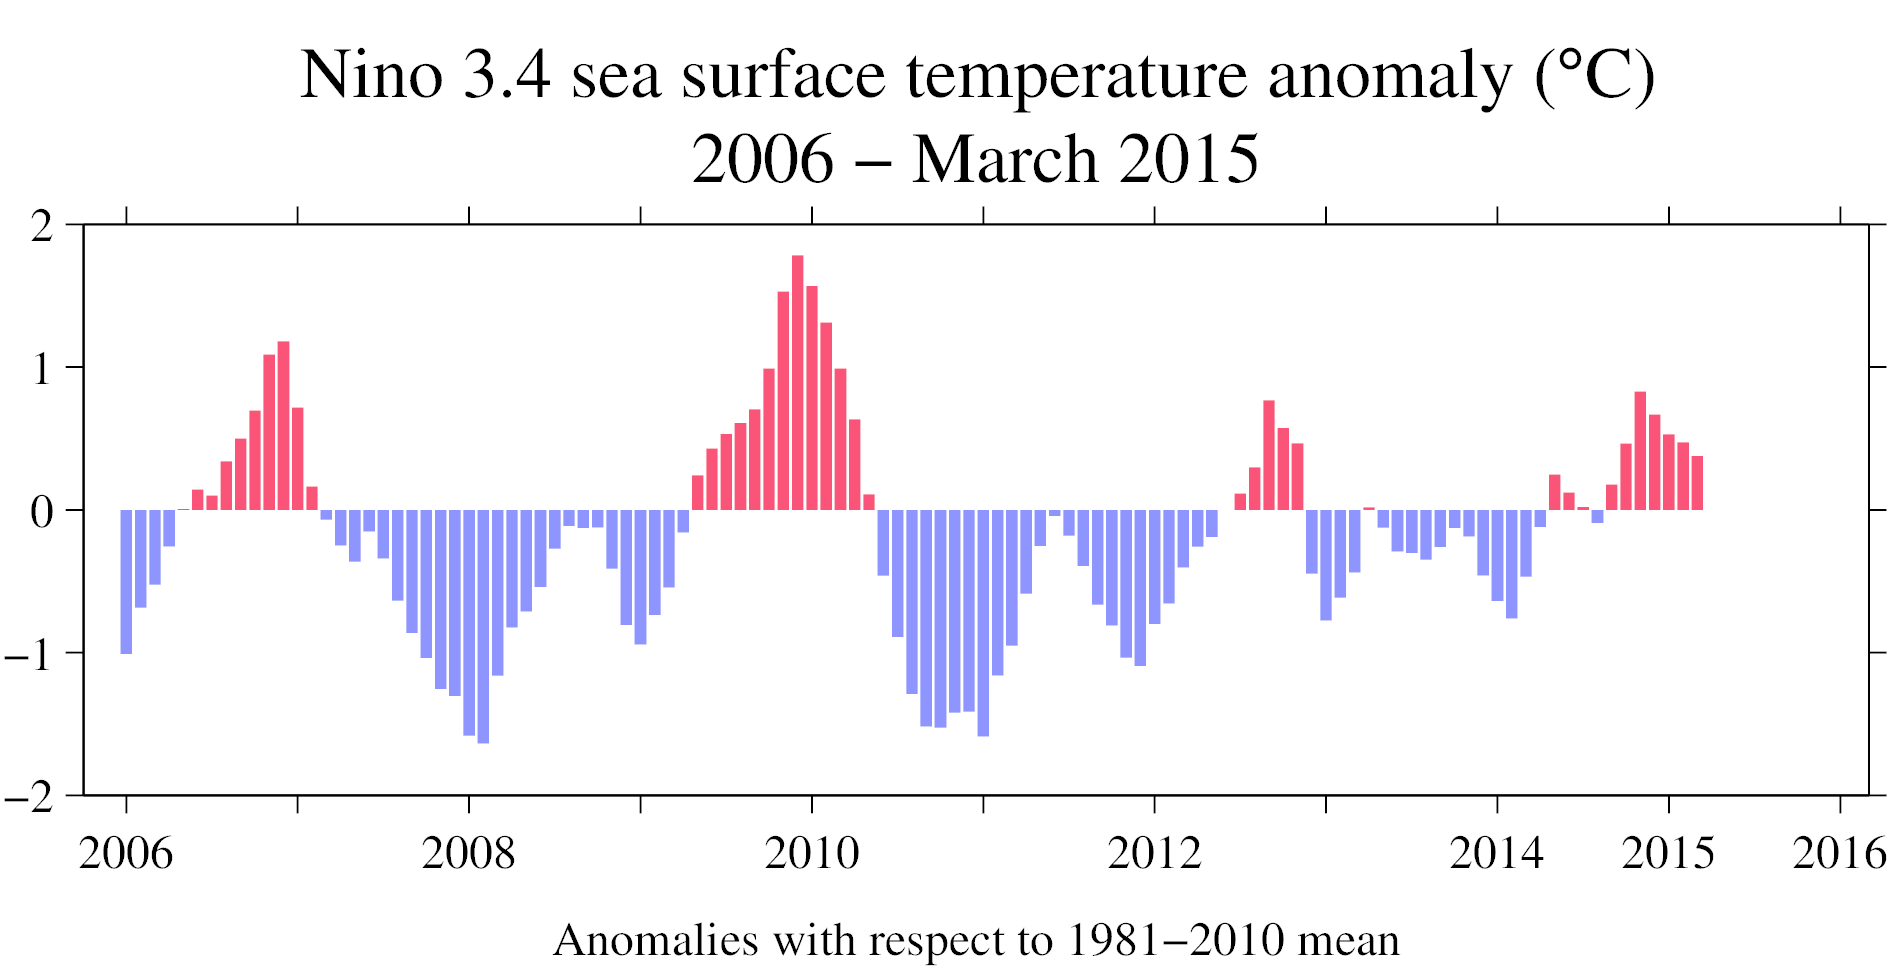
Figure 1: SST anomalies from January 2006 through March 2015 in the Niño 3.4 region of the tropical Pacific (figure by Todd Mitchell - JISAO). Please click on the figure to see the full-size image. Historically, the Pacific Northwest experiences warmer winters with dry conditions and reduced snowpack, especially during the early part season (October through December) during a positive ENSO event. Considering this past winter experienced a late-blooming El Niño and the relationship does not hold true for every winter, how did the past winter shape up? Figure 2 shows the mean October through March temperatures compared to the 1981-2010 normal for WA State. Much warmer than normal temperatures occurred across the entire state, with almost all locations showing temperatures at least 3 degrees Fahrenheit warmer than normal. Averaged statewide, Oct-Mar 2014-15 is the warmest Oct-Mar on record with temperatures 4.7 degrees Fahrenheit above normal. As for precipitation, the total Oct-Mar precipitation was near-normal for a majority of the state (Figure 3). There are some exceptions, with the northern half of the state tending towards wetter than normal conditions (115-130% of normal) and the southern half with some areas of below normal precipitation (70-85% of normal), but those are few. Separating the season into two periods, Oct-Dec and Jan-Mar (Figure 4), shows that the early winter was on the wetter side for some locations in the northern half of WA while the later winter was on the drier side, especially in the Cascades. 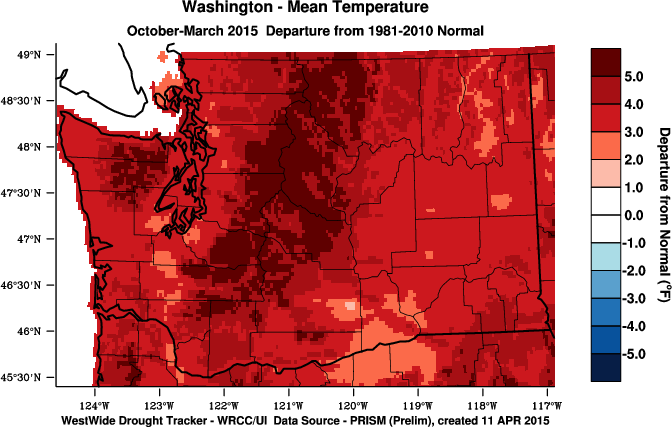
Figure 2: Oct-Mar 2014-15 temperature anomalies (Fahrenheit) from the 1981-2010 normal (from WRCC). Please click on the figure to see the full-size image. 
Figure 3: Total Oct-Mar 2014-15 precipitation percent of normal (from WRCC). Please click on the figure to see the full-size image. 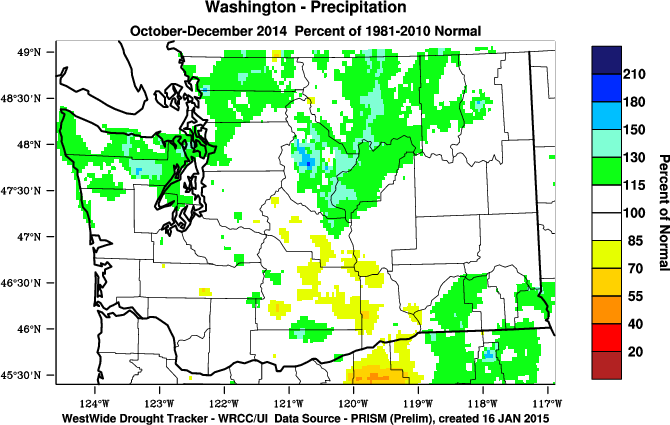 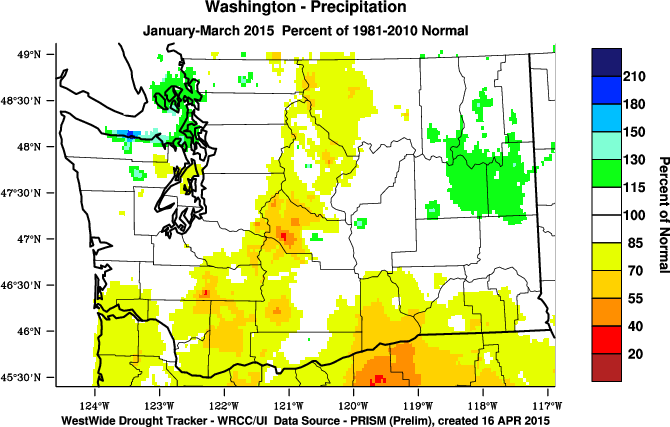 Figure 4: October-Dec precipitation percent of normal (top) and Jan-Mar precipitation percent of normal (bottom) statewide (from WRCC). Please click on the panels to see the full-size image. The average winter conditions provide one perspective on the past winter, but it is also worthwhile to consider the progression of the weather over the course of the season. October was very warm and wet relative to normal aside from southeastern WA where precipitation was below normal. Average temperatures for November were near-normal, though the month featured a number of a temperature swings; there were warm periods with record-breaking daily temperatures and then a period of stagnant weather mid-month with much colder than normal temperatures (low overnight temperatures dropped into the single digits in parts of eastern WA). November precipitation amounts were below normal but near-normal precipitation fell in December. Warmer than normal temperatures persisted from December through March for essentially the entire state. January precipitation was below normal despite a very heavy rain event at the beginning of the month. February precipitation was near-normal even though the month included some heavy rain and flooding on the Olympic Peninsula. Precipitation amounts relative to normal were variable in March. 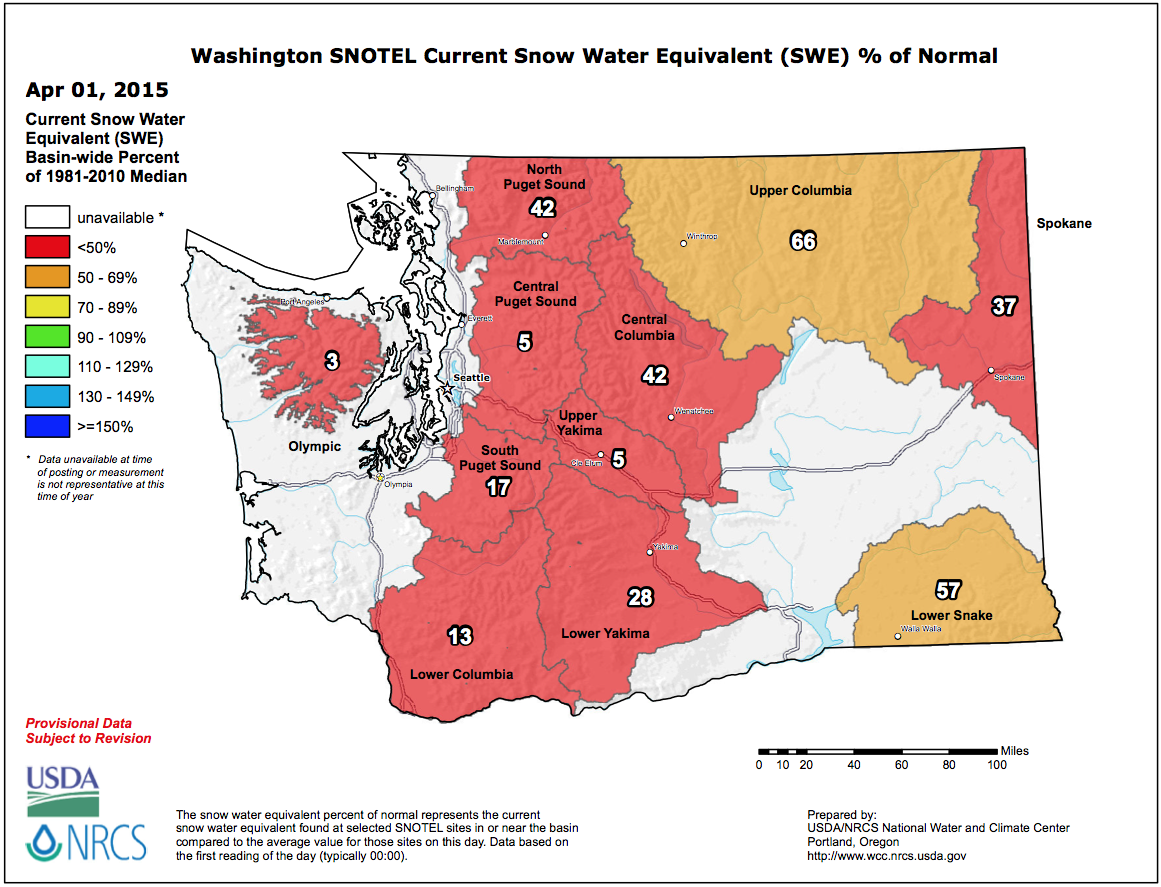
Figure 5: Snowpack (in terms of snow water equivalent) percent of normal for WA as of 1 April 2015 (from NRCS). Please click on the figure to see the full-size image. Despite near-normal precipitation for the winter season, the warm temperatures caused a disproportionate amount of precipitation to fall as rain instead of snow in the mountains throughout the season. High freezing levels were the rule, and the snowpack situation in the mountains worsened as the season progressed. Record low and near record low snow water equivalent (SWE) values for the Snotel stations were common in the latter half of the season. Figure 5 shows the average basin SWE percent of normal throughout WA as of 1 April. The SWE is dismal, with a measly 3% of normal in Olympic Mountains, and less than 25% of normal in the Central Puget Sound, Upper Yakima, South Puget Sound, and Lower Columbia basins. The Department of Ecology's Water Supply Availability Committee monitored conditions all season, and at the time of this writing Governor Inslee has declared drought for almost half of WA state (Figure 6). Low streamflow from below normal snowmelt runoff is a concern for both agriculture and freshwater ecosystems as our typically dry summer approaches. A recent National Weather Service Northwest River Forecast Center April through September water supply forecast (Figure 7) projects streamflows between 25 and 50% of normal off the central Cascades. Forecasts predict between 50 and 75% of normal for most of the rest of the streams off the Cascade Mountains, and the Spokane and Walla Walla areas. Stream gauges for the Columbia River are forecast to have between 75 and 90% of normal streamflow. 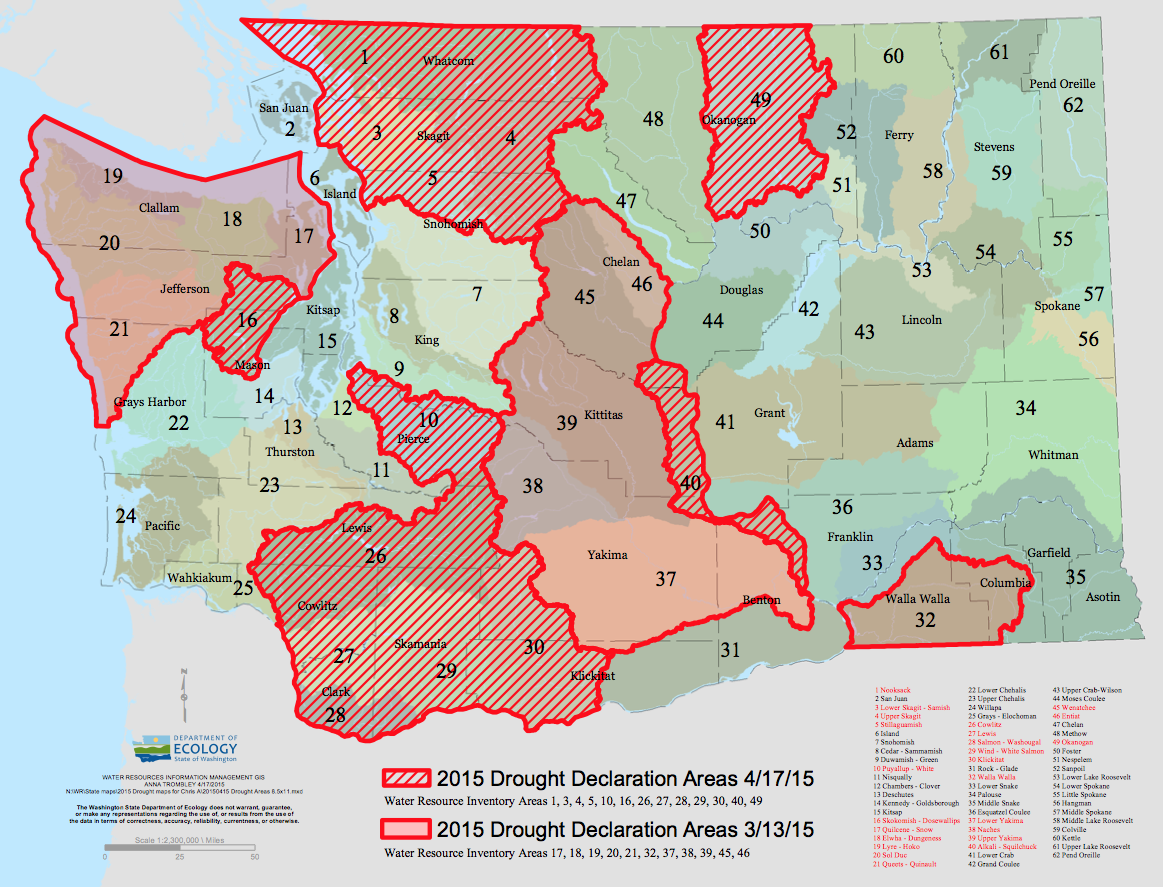
Figure 6: Areas of WA is drought as declared by Governor Inslee on 13 March (solid red) and 14 April (red hatching). Please click on the figure to see the full-size image. 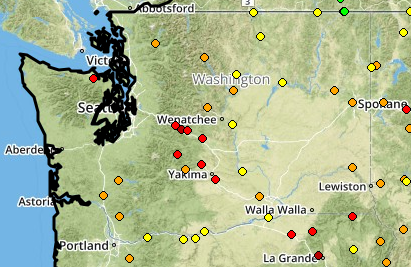 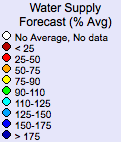 Figure 7: April through September 2015 water supply forecast for WA as of 19 April 2015 from the National Weather Service River Forecast Center. In summary, the winter of 2014-15 featured record-breaking warmer than normal temperatures with near-normal precipitation. The warm temperatures caused much of the precipitation to fall as rain instead of snow in the mountains and there are drought concerns for nearly half of the state at the time of this writing. The combination of much warmer than normal ocean temperatures off our coast, and El Niño that is likely to persist into next winter, portends increased odds of warmer than normal temperature through the remainder of the year. We are continuing to monitor the situation and will provide updated forecasts as conditions evolve.
|


 |