The Unusual Mid-Spring Windstorm compiled by Wolf Read |
|
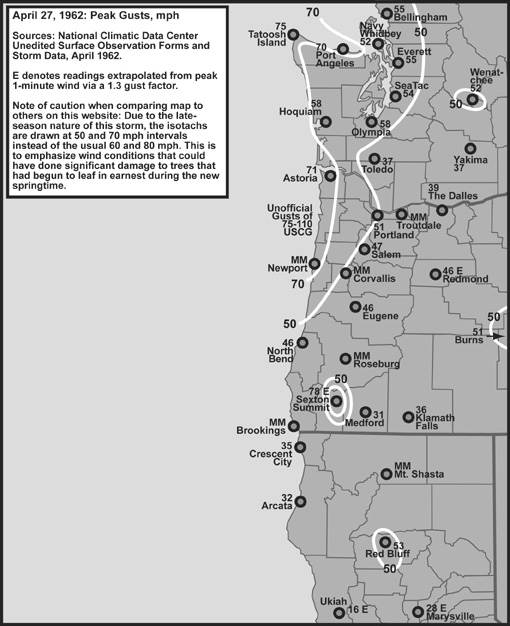
Introduction In late April 1962, a very intense 977 mb low moved near Tatoosh Island and then tracked inland across Southern Vancouver Island. Strong pressure gradients built across Washington and Oregon as the low dove inland. Winds escalated, reaching 45 to 60 mph in gusts across much of the interior, and 50 to 75 mph along the coast north of Coos Bay, with unofficial gusts exceeding 100 mph. In classic fashion, Tatoosh was raked by powerful easterlies as the low approached, and Port Angeles was hammered by an intense west flow that set up in the Strait of Juan de Fuca behind the cyclone as it moved into southern British Columbia. In Oregon, farm structures were torn apart, and trees fell wholesale, breaking power and telephone lines, smashing cars and homes [1]. One person was killed in Washington, electrocuted by a fallen power line. This kind of windstorm scenario has played out on numerous occasions during the late fall and winter months. More rarely, it'll happen within the month following the Vernal Equinox. To have it happen near the beginning of May--in this case, April 27th--is astounding. The winds from this storm were fairly strong, especially along Oregon's coast and across Western Washington, but they weren't this cyclone's distinguishing feature. It's the late-season occurrence, especially when the depth of the storm is considered. Other April events, such as the April 14, 1957 sou'wester, just weren't as intense central-pressure-wise. The April 27, 1962 cyclone is a winter storm that happened in the spring. The storm's late-season timing isn't the only reason to be interested in this event. This powerful low shares the same year as the great Columbus Day Storm. The tempest of October 12th is a perfect counterpoint to the April 27th cyclone--the Columbus Day Storm was a winter superstorm that happened in early autumn. Following the Columbus Day Storm was another late-season event, a powerful secondary spinup low that tracked across Northwest Oregon on March 27, 1963. It seems that a pattern of early and late season--transitional month--storms had set up during 1962 and 1963. It is tempting to speculate about this unique series of high-wind generating cyclones. What was going on to promote these seemingly out of season events? We may never know. But I have speculations. One is that 1962 was a phase-chage year for some heretofore unidentified long-term climate cycle. I have a number of resons for this thought, which I describe in more detail in the introduction for the October 2, 1967 windstorm page. |
General Storm Data Minimum Pressures and Peak Gradients Table 1, below, is a list of the lowest barometric pressures, and time of occurence, for the April 27, 1962 windstorm. Source: Microfilm copies of the unedited surface observation forms, obtained from the National Climatic Data Center. |
|
Notes Table 1: [1] Also 29.82" at 09:00 HRS. [2] Also 29.22" at 06:00 HRS. |
Table 2, below, is a list of the maximum pressure gradients, and time of occurrence, for the April 27, 1962 windstorm. All these gradients are fairly strong, save maybe for the Willamette Valley, which was a bit on the low side. The two measures that stand out are the ones that reach deep into Washington. The OTH-TTI gradient of +29.8 mb (+0.88") is among the steepest known for this measure, but falls behind some storms, including the +31.3 mb (+0.924") reading from the November 14, 1981 windstorm, and the +31.1 mb (+0.918") reading from the December 16, 1961 storm. The Columbus Day Storm, with a max of +27.3 mb (+0.81"), did not quite match the April cyclone for OTH-TTI. The SEA-BLI reading of +9.0 mb (+0.27") is also among the strongest for the 1950-2002 period, though it also falls behind a number of storms. This includes the +11.5 mb (0.34") reading from another significant April storm, on the 14th day in 1957, and +9.2 mb (0.272") from the destructive Inaugural Day storm of 1993, and the infamous Columbus Day Storm. Source: Microfilm copies of the unedited surface observation forms, obtained from the National Climatic Data Center. |
|
Pressure Tendencies The April 27, 1962 windstorm brought with it a decent pressure couplet over much of Western Washington, with fairly strong pressure surges (+3.0 mb and higher) at stations that fell within about 300 miles of the storm's center. Table 3, below, shows the maximum hourly changes in pressure for eleven key stations in the Pacific Northwest. Tatoosh Island, ending up very close to the storm's center, saw the biggest swings. These readings aren't particualrly impressive, but represent values typical of the average Northwest windstorm-generating cyclone. Source: Microfilm copies of the unedited surface observation forms, obtained from the National Climatic Data Center. |
| ||||||||||||||||||||||||||||||||||||||||||||||||||||||||||||||||||||||||||||||||||||||||||
Table 3 Notes: [1] The -2.4 mb hourly fall at Eugene is the last of three occurrences, the other instances having occurred at 22:00 (26th) and 00:00. [2] The -2.8 mb hourly fall at Salem is the last of two occurrences, the other instance having occurred at 23:00 (26th). [3] The -3.4 mb hourly fall at Bellingham is the last of three occurrences, the other instances having occurred at 03:00 and 04:00. |
Peak Wind and Gust Table 4, below, lists the peak wind and gust for eleven key stations in the Pacific Northwest, their direction, and their time of occurrence. "Peak Wind" is a 1-minute average, and "Peak Gust" is an instant (approximately 1-second) average. Although not generally record-setting (not even for the month of April--see paragraph below), the April 27, 1962 cyclone's winds were quite forceful in a number of areas. Peak average wind speeds reached gale force from the Willamette Valley northward: this springtime windstorm was no slouch! The April 1962 storm was as powerful as, if not more powerful than, many of its wintertime cousins. Nearly ten years later, on April 5, 1972, a squall line would produce higer gusts in the Willamette Valley, spawn a deadly tornado in the Portland-Vancouver area, and produce 40-50 mph gusts in the Puget Lowlands. April high-wind events are rare in the record, but clearly are a feature of Pacific Northwest Climate. Source: National Climatic Data Center, undedited surface observation forms. |
| Location | Peak |
Direction |
Obs Time of |
Peak |
Direction |
Obs Time of |
| California: | ||||||
| Arcata | 23 |
SE |
05:58 HRS, 27th |
32 |
SE |
05:58 HRS, 27th |
| Oregon: | ||||||
| North Bend | 25 |
S |
05:58 HRS, 27th |
46 |
S |
05:58 HRS, 27th |
| Astoria | 52 |
SSW |
03:57 HRS, 27th |
71 |
SSW |
05:24 HRS, 27th |
| Medford | 24 |
WSW |
13:58 HRS, 27th |
31 |
WSW |
13:58 HRS, 27th |
| Eugene [1] | 38 |
WSW |
14:12 HRS, 27th |
46 |
W |
07:42 HRS, 27th |
| Salem [1] | 44 |
S |
06:25 HRS, 27th |
47 |
S |
02:58 HRS, 27th |
| Portland [2] | 35 |
SSW |
06:45 HRS, 27th |
51 |
S |
05:37 HRS, 27th |
| Washington: | ||||||
| Tatoosh I. [3] | 58 |
E |
11:55 HRS, 10th |
75 |
E |
02:45 HRS, 27th |
| Olympia | 46 |
SW |
07:58 HRS, 27th |
58 |
SW |
07:58 HRS, 27th |
| Sea-Tac | 45 |
SSW |
11:31 HRS, 27th |
54 |
SSW |
08:57 HRS, 27th |
| Bellingham | 25 |
SE |
10:58 HRS, 27th |
55 |
SE |
10:58 HRS, 27th |
| AVERAGE | 37.7 |
S |
51.1 |
S |
Table 4 Notes: [1] No gust recorded during peak wind period for either Eugene or Salem; maximum gust was likely higher than the values indicated in the peak gust column. Using the standard 1.3 gust factor, the peak for Eugene was possibly around 49 mph and Salem 57 mph. [2] Peak fastest mile at Portland was S 45 mph at 05:50 PST. [3] Peak fastest mile at Tatoosh was E 73 mph at 06:02 PST. |
Last Modified: December 2, 2003 You can reach Wolf via e-mail by clicking here. | Back | |