A Collection of Barographs for Unique Storms by Wolf Read All these barographs were obtained from the National Climatic Data Center. More charts will be added when I find the time. |
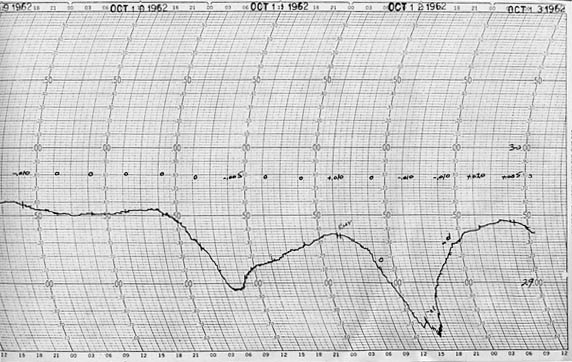
| Below, October 10-13, 1962 for Salem, Oregon. This is the trace for the great Columbus Day Storm, which is the second major dip on the chart. Gusts reached 90 mph at Salem's McNary Field during the event. The first dip was caused by a strong cyclone that traveled further offshore than the Big Blow, which spared many places damaging winds, except for the SW Oregon coast, which had gusts to 75 mph. |
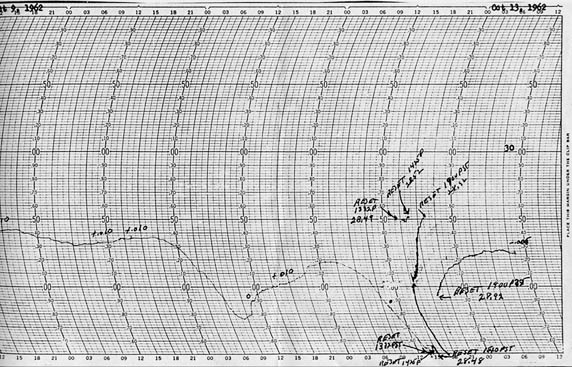
| Below, October 10-13, 1962 for Eugene, Oregon, barograph elevation 373 feet. The magnitude of the storm caused much worry over the barogram. The needle started flirting with the bottom of the graph around 13:32, forcing a reset, and the indicator was raised a full 1.00". The needle began to rise shortly after, and was reset back to its original position at 14:25. However, the storm's famous double-dip caught the forecasters off-guard, and the needle dropped below the bottom border of the graph around 15:20. The barometer was then reset 0.50" at 15:40, and left alone until 19:00, when it was returned to its original setting. |
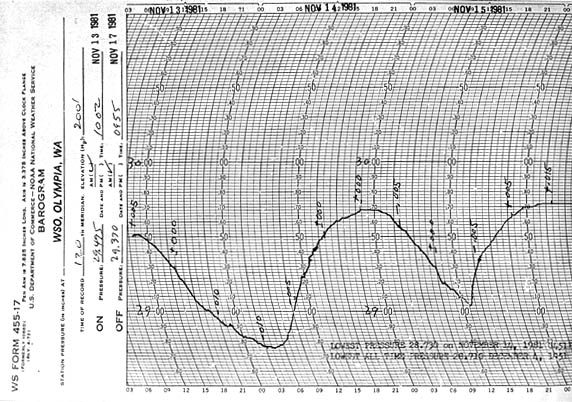
| Below, November 13-15, 1981 for Olympia, Washington, shows the broad, deep sweep of the large cyclone that produced gusts of 64 mph at Olympia on November 14 as the low raced northward offshore. The sharper dip afterward was from a cyclone that followed closely on the heels of the bigger one, and swept inland right over the Olympic Mountains. The lesser storm still generated wind gusts to 58 mph at Olympia. |
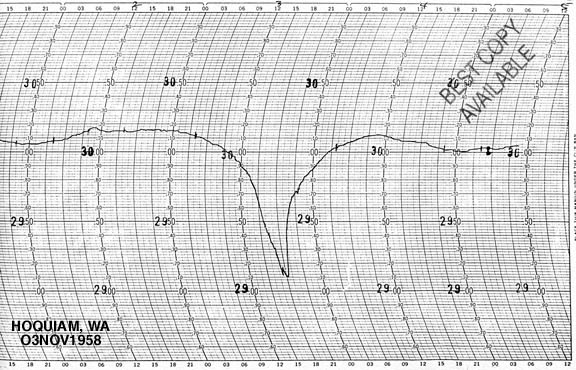
| Below, November 2-5, 1958, at Hoquiam, Washington, shows one of the most extreme barometric traces in the history of the Pacific Northwest in terms of tendencies. The steep drop marks rates-of-fall that reached 0.21" an hour, and the sudden rise traces a 0.41" pressure surge in one hour. Peak winds reached 81 mph as this cyclone's center nearly passed over Hoquiam. The strong V-shape is more typical of hurricanes than midlatitude cyclones, and is a reminder that the Pacific Northwest is visited by storms of truly magnificent proportions on occasion. |
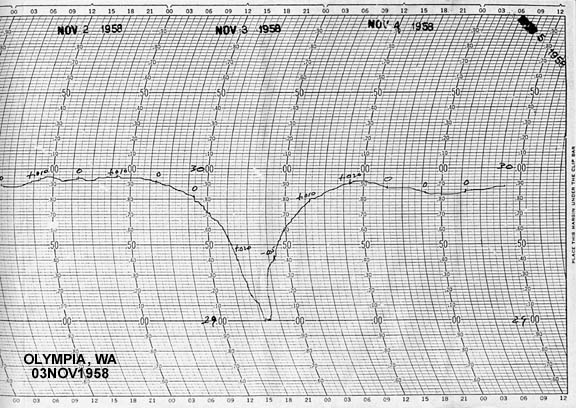
| Below, November 2-5, 1958 for Olympia, Washington, shows a trace of near equal intensity to that of Hoquiam. |
| Below, November 2-5, 1958 for Astoria, Oregon. Though the trace isn't as dramatic as places north, the rapid pressure changes shown here are still quite unusual. |

Page Last Modified:March 1, 2003 | Back | |