Near Repeat of the December 15-16, 2002 compiled by Wolf Read |
|
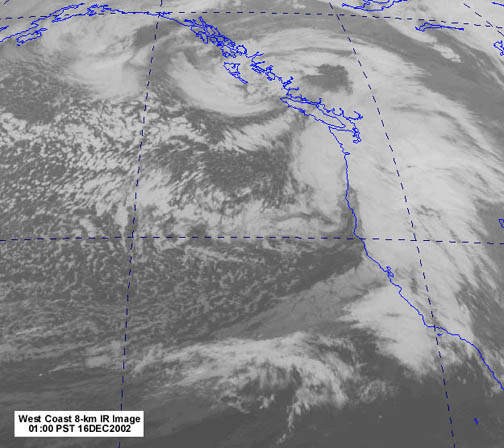
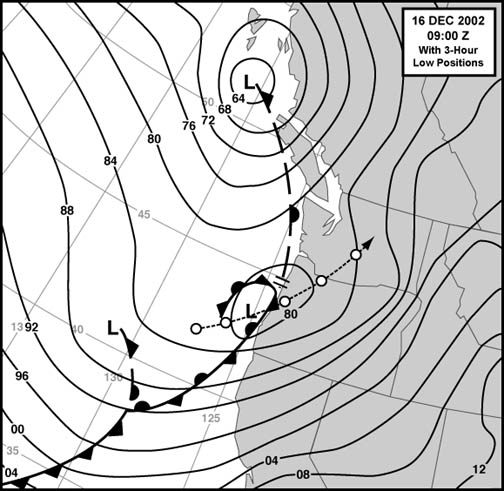
| On December 15, 2002, a wave developed along the trailing cold front of a Powerful 960 mb cyclone that had moved into the waters north of Vancouver Island during the day. An obvious dry slot with developing bent-back occlusion became apparent during the evening of December 15th, right along 40º N and at about 130º W. This early cyclogenesis continued as the wave neared the shore, and the system eventually swung northeastward and onto the central coast of Oregon. The track is indicated in Figure 1, above, a surface map that is adapted from the official NWS North American surface chart for 09:00 UTC. Figure 2, below, is the 8-km resolution IR satellite photo taken at the same time as the suggested conditions in the above surface map. In the image, a distinct dry slot reaching northward toward Newport is evident, with a fairly well-developed bent-back occlusion hemming the dry area to the west. Image source: University of Washington archives. |
|
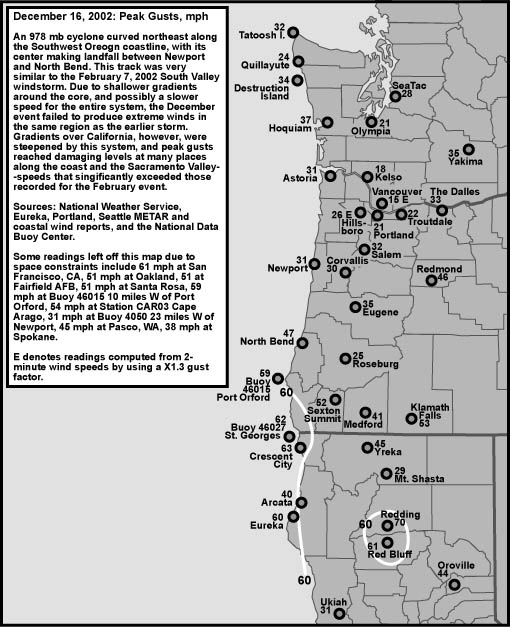
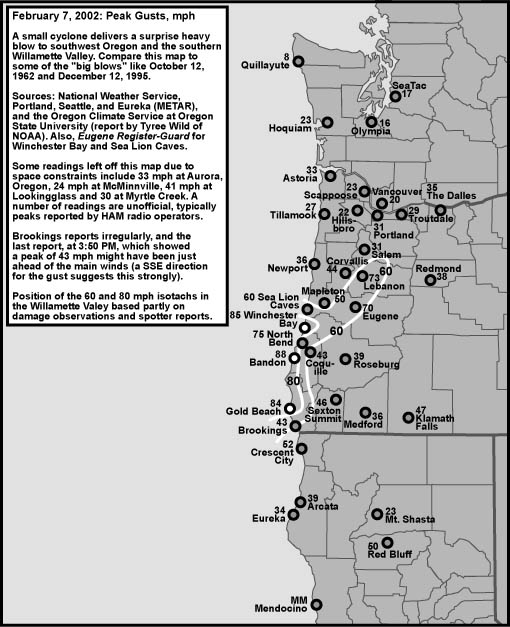
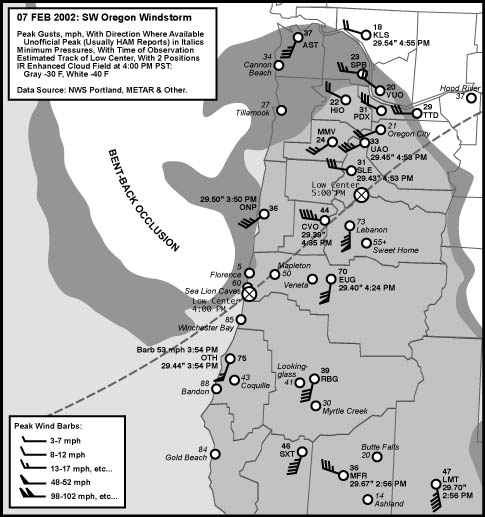
This cyclone's path was very close to the route followed by the devastating February 7, 2002 South Valley Surprise (SVS). However, despite the December cyclone having a much deeper center--978 mb verses 995 mb--this new storm didn't pack the punch of its earlier sister. At least not in the Willamette Valley. Some places on Oregon's South Coast, and east of the Cascades which ended up south of the storm's center, experienced damaging winds. This SVS contributed to the tightening of gradients south of Coos Bay, and combined with the incoming chunk of cold front that the newborn cyclone stole from the December 15th storm, produced a significant windstorm in Northern California from the San Francisco Bay Area northward. For the Willamette Valley, differences between the two SVS storms of 2002 offer insight into the lack of high winds during the December low's passage. Figure 3, below, shows the distribution of peak gusts, and the concentration of the highest readings south of Oregon. Compare this map to one of the same scale for the February 7, 2002 storm, Figure 4, below. The December event failed to bring wind gusts of 50 to 75 mph across Southwest Oregon and into the Willamette Valley. Even on the California coastline, where winds gusted into the 60s, there's a lack of the same 80 to 90 mph intensity witnessed on the South Oregon Coast during the February storm. Nevertheless, many of the California readings were 10 to 20 mph faster during the December event, an indication that there were differences in some characteristics between the two storms. Sources: Peak gust data are from the National Weather Service, Eureka, Portland and Seattle offices, METAR and storm reports, and the National Data Buoy Center real-time meteorological data. |
|
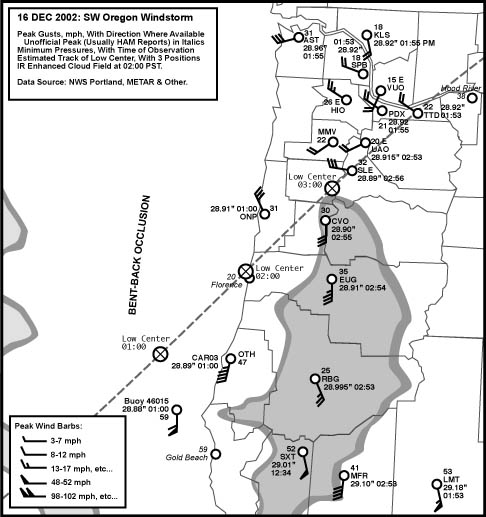
A Look at the Willamette, Garden and Rogue Valleys A map that zooms in on Western Oregon's peak wind conditions is shown in, Figure 5, below. This map can also be compared to a similar one for the February 7, 2002, Figure 6, below. Aside from peak velocity, these maps depict peak wind direction. Wind direction for the December storm shows some remarkable uniformity when compared to the February event. Places like Salem, Aurora and Mcminnville had peaks from exactly the same direction in both storms (Salem nearly had the same velocity), with Eugene Portland and Troutdale falling within 10-20º. North of the Columbia River, this pattern changes due to a decent southerly gradient being dragged across the region long behind the storm. Many stations in Western Washington had their peaks happen during this time, typically from a south to southwest direction. The Portland Metro area also felt these winds, and they typically escalated within a few mph, or even matched, the westerly peaks attiained during the earlier arrival of the storm's bent-back occlusion. One of the strong outliers from this pattern is Corvallis. This station had a peak gust arrive from the south at about the same time as Eugene, along with a significant elevation in temperature, indicating that the exact center of the low had tracked north of the station. The February low tracked just south of Corvallis, resulting in a peak gust out of the west-southwest. The December storm appears to have tracked maybe 5 to 10 miles north of the February event. One distinct difference evident between the two maps is that the February storm's bent-back occlusion was much more compact, probably a reflection of a smaller storm overall. It appears that energy was more concentrated in the February storm, which probably contributed to the higher wind speeds. Examination of pressure gradients also reveals the difference in compactness (below). Sources for Figures 5 and 6: Wind and pressure data are from the National Weather Service, Eureka, Portland and Seattle offices, METAR and storm reports, and the National Data Buoy Center real-time meteorological data, and satellite photos from the University of Washington archives. |
|
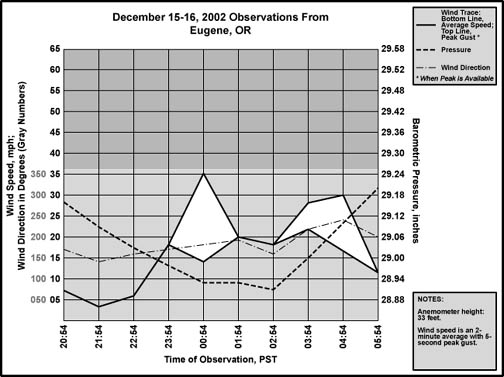
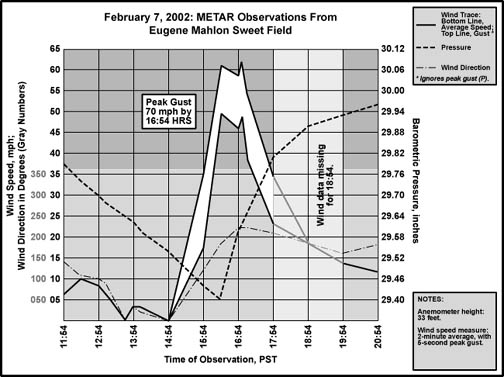
Close Examination of Some Interior Stations, South to North Pressure and wind conditions for Eugene, OR, are plotted in Figures 7 and 8, below, for the December and February storms. If the timeline during the December storm were compressed by a factor of two to three, the two meteograms would bear a much stronger resemblance. The features are all in place, with winds escalating and shifting from the SE to S as the pressure neared its low point, and then continuing to move around the compass to SW while decreasing. The December storm, of course, lacks the wind intensity seen in February--70 mph hits with four times the force of 35 mph! It is interesting that both traces show a dip, or slowing of wind speeds in the middle of the wind episode, with the December storm having this much more pronounced. This could be an artifact of the method of data recording, as, for the December event, there's no reason why wind gusts couldn't be occasionally reaching the 25-30 mph range on any part of the wind trace between 00:54 and 03:54. Source: For these and the following meteograms (Figures 9-14) in this section, all data is from the National Weather Service, Portland office, METAR reports. |
|
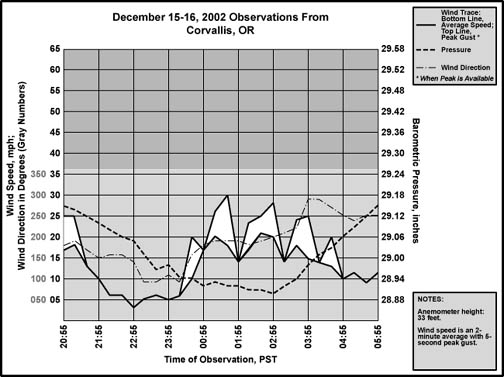
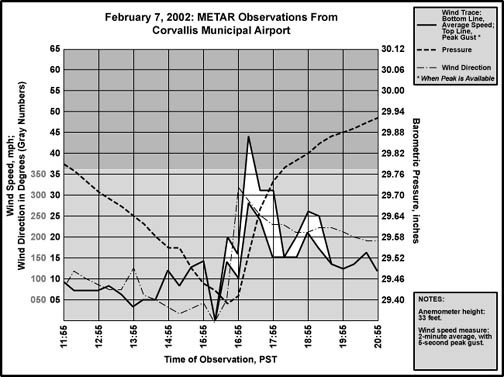
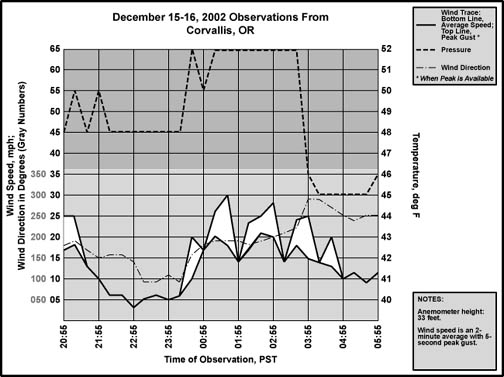
| The meteograms for Corvallis, OR, are plotted in Figures 9 and 10, below, for the December and February storms. There's a marked difference between the two sets of conditions, even in a broad sense. During the February storm, there is no indication of any south winds. Airflow shifted from the NE to the NW as the barometer started to climb, and jumped to peak velocity with the main pressure surge underway, all the mark of the arrival of a potent bent-back occlusion. During the December event, there was roughly a three-hour period with southerly winds as the barometer fell to its low point, slowly shifting to the SW. The peak gust of 30 mph occurred during this time. A burst of wind out of the WNW occurred during the pressure climbout phase, with gusts to 25--this is the mark of the bent-back occlusion. With the strong southerly wind signature, the December meteogram is more akin to the Eugene readings than the Corvallis plot for February 7, 2002, which strongly suggests that the cyclone's center passed north of Corvallis on its way to the Cascades. |
|
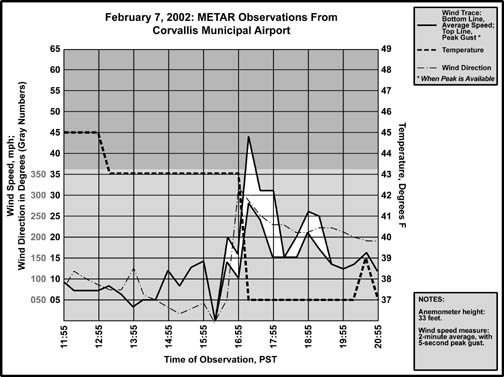
| Another way of looking at the Corvallis problem is outlined in Figures 11 and 12, below, for the December and February storms. Temperature is plotted against wind conditions. Just after midnight during the December storm, there's a distinct rise in temperature from 48º F to 52º F at the onset of southerly winds at Corvallis. The temperature falls very quickly with the arrival of westerly winds near 03:55, reaching 45º F by 04:15. This is the cold air brought in along the bent-back occlusion. For the February storm, there's no indication of a significant temperature rise ahead of the sudden drop from 43º F to 37º F that happens with the arrival of the bent-back occlusion from 16:55 to 17:15. There were no southerly winds to give temperatures a boost. In this case, the low center tracked south of the Corvallis. Clear indication that, though the storm paths were quite similar, they were unique enough to produce significantly different conditions at Corvallis. |
|
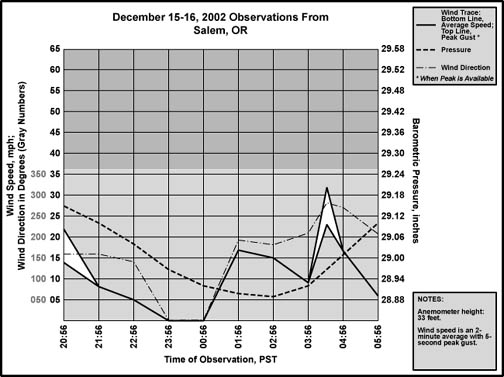
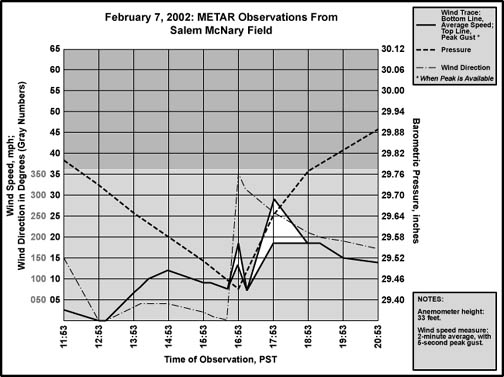
| Weather plots for Salem, OR, are depicted in Figures 13 and 14, below, for the December and February storms. Like Corvallis, there are significant differences between the two sets of conditions for Salem, and generally for the same reason. During the December storm, Salem had about two hours of temperature-elevating southerly winds as the pressure fell to its low point and then began to climb. Winds had shifted to westerly by 04:35, peaked at 32 mph, and the barometer had started a faster climb--the arrival of the bent-back, with a temperature drop from 50º F at 03:56 during the south winds to 43º F by 04:56. Compared to Corvallis and Eugene, the southerly winds didn't get that strong at Salem, sustaining at 16 mph for a time with gusts too low to be noted. This is probably due to the fact that the cyclone's midpoint passed very close to Salem, putting the station in what appears to be a shallower gradient field that existed around the immediate center--an "eye" so to speak. During the February storm, there were no southerly winds at Salem as pressures reached their low point. In fact, winds went almost due northerly right at the barometric minimum, 16:53, and became gusty to 18 mph, a strong indicator of a low passing to the immediate south and briefly providing a good gradient orientation for north winds. Within an hour, the bent-back arrived with gusty west winds to 29 mph (peak 31 not indicated on the graphic), and the pressure began a surge upward on par with the great Columbus Day Storm. |
|
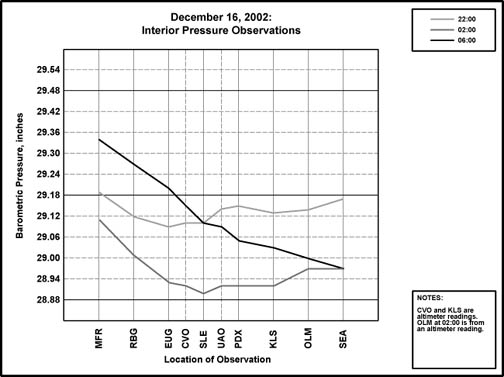
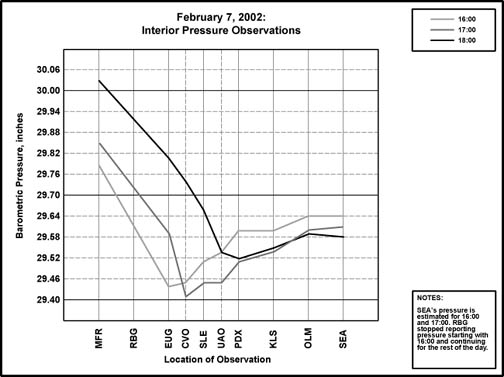
The December storm's pressure traces in all the above meteograms depict a broad sweep when compared to the sharp downward spikes caused by the February storm. This suggests that the December event, when compared to the February storm, was a broader low with associated gradients that were less steep. A storm's overall speed has an effect on the tendencies seen in pressure graphs, with slower storms producing gentler barometric changes, and this almost certainly played a role in the wide curves seen in the meteograms for the December event. There are ways of separating out the storm's speed from the actual gradient structure, or profile, of the two cyclones, as will be shown below. Three south-to-north cross sections of the December 16, 2002 cyclone are depicted in Figure 15, below, with a set for the February 7, 2002 event, Figure 16, provided below in the same relative scale for comparison. The steep gradients of the February event are quite evident when compared to the more gradual slopes that occurred during the December storm. Both events had broad troughs of low pressure to the north, which minimized the gradient north of the prospective storms' tracks, which, for the December storm, resulted in fairly low pressure readings all over Western Oregon and Washington. However, even the difference between northerly (negative) and southerly (positive) gradients is relative, and the February event managed a negative gradient between EUG and PDX that was equivalent to, or even steeper, than the positive gradients seen between MDF and EUG during the December event. These features point to an intense, compact cyclone for February, and a much broader low for December. Another factor is the difference in time between the three traces. The February storm moved very quickly, and the cross sections changed dramatically at one-hour intervals. For the December storm, to roughly get the same magnitude of change, four-hour intervals were selected. The difference in storm speed may, in part, account for some of the difference in peak winds between the events, with the slower storm having slower wind velocities. Thus, despite much lower pressures in the December event, which suggests an intense cyclone, the shallower February storm had much more punch. Of course, pressures had been lowered all over the Pacific Northwest by the much bigger December 15th cyclone during the afternoon, and the December 16th SVS appears to have recieved a benefit from this in terms of low barometric readings. A better measure may be the maximum pressure drop at each storm's core during cyclogensis. The February cyclone's core experienced drop of about 12-15 mb in pressure, say 1010 mb to 995, as it developed and raced toward Oregon. The December event underwent a drop of about 5-6 mb, say 984 mb to 978. Thus, relatively speaking, the February storm was the deeper storm by a factor of about two to three. Note on pressure data: Sea-level pressure readings were sometimes spotty for the study stations during this storm. Data holes were filled by extrapolating from altimeter readings that were usually available, or, if altimeter was also missing, averaging between readings in the observations before and after the one that had the missing number. For CVO and KLS, altimeter was the only pressure measure available. Sources: Pressure data are from the National Weather Service, Eureka, Portland and Seattle offices, METAR, and the National Data Buoy Center real-time meteorological data, surface maps for the December 16, 2002 storm (for determining central pressure drops) are from the NOAA online FAX charts server, and surface maps for the February 7, 2002 storm were obtained from the National Climatic Data Center. |
|
Table 1 and Table 2, below, offer a look at the hard numbers for each storm's pressure gradients, which is simply another way of looking at the data depicted in Figures 7 and 8. The numbers clearly show much stronger values--a clearer signature--during the February 7, 2002 event. This includes fairly sharp negative gradients as the storm made landfall, with a sudden switch to strongly positive when the cyclone's center had moved northeast into the Cascades. The peak gradient of +6.1 for the EUG-CVO measure isn't even approached during the December storm, which could only manage a +2.0 at 09:00, long after the storm center had moved past. During the December event, Eugene's peak gust of S 35 mph happened near 00:54 on December 16th, and Corvallis' S 30 mph near the 01:35 observation. At the 01:00 hour, the EUG-CVO gradient was a mere +0.3 mb. Quite a difference from the peak gust of 70 mph at 16:40 on February 7th at Eugene as the EUG-CVO gradient approached the +6.1 mb for the 17:00 hour! Thus, it appears that gradient, or lack thereof, was the primary reason for lower wind speeds during the December 16, 2002 SVS. For the December 16, 2002 event, the MFR-RBG and RBG-EUG measures became fairly strong, which correlates well with the 40 to 55 mph gusts seen at Klamath Falls, Medford and Sexton Summit. This is a hint that gradients far south of the cyclone's center were stronger, something that will be looked at more closely in a later section. Sources for Tables 1 and 2: Pressure data are from the National Weather Service, Portland, METAR reports. |
Valley Pressure Gradients, December 15-16, 2002, Times are PST | |||||||
| Time | MFR-RBG |
RBG-EUG |
EUG-CVO |
CVO-SLE |
SLE-UAO |
UAO-PDX |
PDX-KLS |
| 18:00 | +3.4 |
+1.2 |
+0.4 |
+0.7 |
-0.9 |
-0.3 |
+1.5 |
| 22:00 | +2.4 |
+1.1 |
-0.4 |
+0.0 |
-1.4 |
-0.3 |
+0.6 |
| 02:00 | +3.6 |
+2.5 |
+0.5 |
+0.7 |
-0.9 |
+0.0 |
+0.2 |
| 06:00 | -1.9 |
+2.4 |
+1.7 |
+1.8 |
+0.3 |
+1.3 |
+0.6 |
| 10:00 | -0.5 |
+0.9 |
+0.8 |
+0.7 |
+0.4 |
+1.1 |
+1.2 |
| Notes: None. | |||||||
Valley Pressure Gradients, February 7, 2002, Times are PST | |||||||
| Time | MFR-RBG |
RBG-EUG |
EUG-CVO |
CVO-SLE |
SLE-UAO |
UAO-PDX |
PDX-KLS |
| 15:00 | +2.8 |
+1.7 |
+0.3 |
-2.0 |
-0.8 |
-1.2 |
-0.7 |
| 16:00 | MM |
MM |
-0.3 |
-2.0 |
-1.0 |
-2.1 |
-1.4 |
| 17:00 | MM |
MM |
+6.1 |
-1.4 |
-0.1 |
-1.9 |
-3.2 |
| 18:00 | MM |
MM |
+2.4 |
+2.7 |
+4.1 |
+0.6 |
-2.3 |
| 19:00 | MM |
MM |
+2.7 |
+1.0 |
+2.0 |
+1.7 |
+2.4 |
| Notes: RBG stopped reporting pressure after 15:00, which resulted in the missing readings. | |||||||
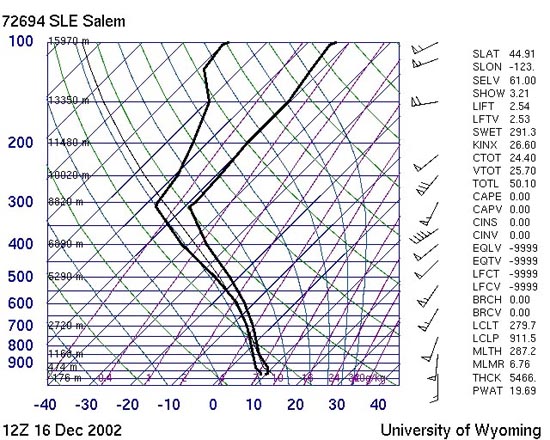
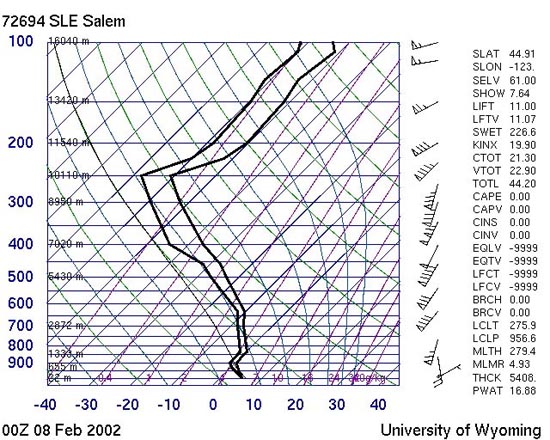
Upper air conditions at Salem are shown in Figure 17 and Figure 18, below, for each storm. The sounding for the December storm was taken at 04:00 PST, which is about one to two hours after the cyclone's center passed through the Mid-Willamette Valley. The sounding for the February storm was taken at 16:00 PST, about an hour before the cyclone's center passed through the valley. Upper-level wind conditions are in fairly close agreement between these two storms. In fact, many of the conditions are roughly in line. Thicknesses, precipitable water, lifted condensation level temperature are all fairly close. Lifted indexes (LIFT)--a measure of thunderstorm potential--are different, but both are positive, indicating that deep convection was unlikely in both storm events. The SWEAT index (SWET)--which takes into account low-level moisture, convective instability, jet maxima, and warm advection--for the December storm, however, indicated at least some possibility of a light thunderstorm, with the February storm still unfavorable. Incidentially, stations at Astoria, North Bend and Crescent City reported thunderstorms early in the day on December 15th, between the two big cyclone events of the 14th-15th. Source for the Skew-T plots: University of Wyoming. |
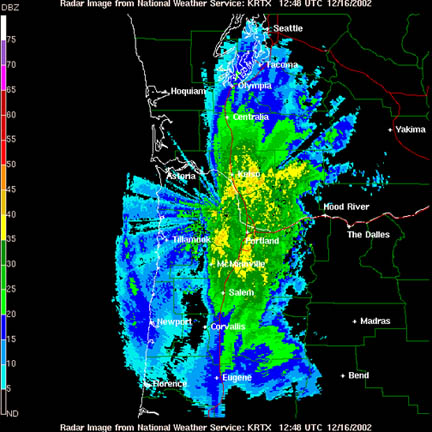
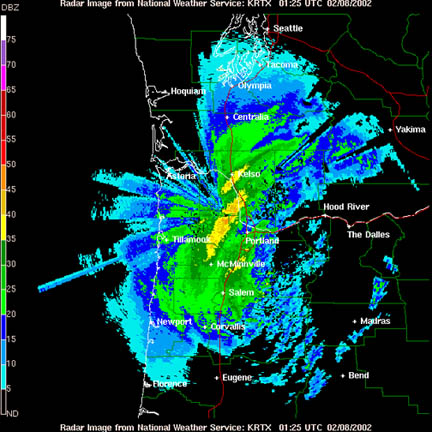
Rainfall was heavy ahead of both storms as their development enhanced the leading cloud fields. Based on data from my own unofficial rain gauge located on the northwest foot of Mt. Tabor, about 1.15" of rain can be attributed to the December 16, 2002 storm, with about 0.25" of that falling during the passage of the bent-back occlusion, making for a fairly hefty 0.80" for the leading precipitation. The totals from the same guage (but from a location about 15 miles south) for the February 7, 2002 storm were about 1.14" for the storm with about 0.59" of that falling in association with the bent-back occlusion. This data suggest a more intense bent-back with the February storm, and more leading precipitation with the December event. Considering that the February storm moved through the region more quickly, rainfall during the event would have to have been correspondibly heavier to result in an equivalent total to the December storm's leading rainfall. With the lower value of 0.55", it appears rain intensities between the storms may have been similar. That the bent-back precipitation for the February storm exceeded the slower-moving December storm by a large margin is an indicator of a more intense frontal system. When time permits, a closer look at official rainfalls totals will be done. Figure 19 and Figure 20, below, Doppler radar images of the bent-back occlusion precipitation for the December (top) and February storms (bottom), show some similarity. Heavier rains were more concentrated along the bent-back for the February event, but in these two cases peak intensities appear about the same, with 40-45 DBZ for the December storm, and 45-50 DBZ for February. The December event failed to produce the snowfall witnessed during the arrival of the bent-back occlusion for the February storm, but temperature drops did occur with the December occlusion. Using my unofficial thermometer, the temperature fell from 47.1º F at 05:01 on December 16th to 43.3º F at 07:43 as cold rain continued to add about 0.04" to 0.08" an hour to the gauge. During the February storm, I noted 43º F at 15:44 as the storm's center was making landfall, a temperature that had dropped to 34.5º F by 19:04 with snow, and then to a low of 33.9º F at 19:15. With a total drop of about 9º F, the February occlusion produced over twice the temperature swing than the December event. Another indicator of a stronger occlusion during the devastating February storm. Source: Dopple radar images courtesy of the National Weather Service, Portland. |
|
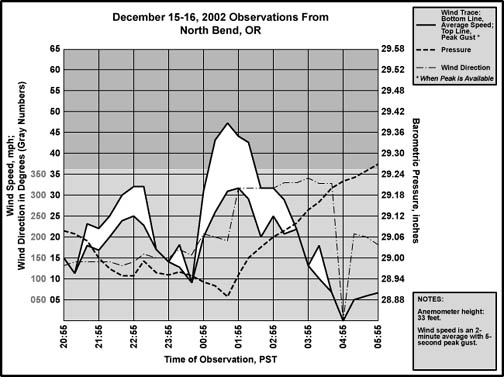
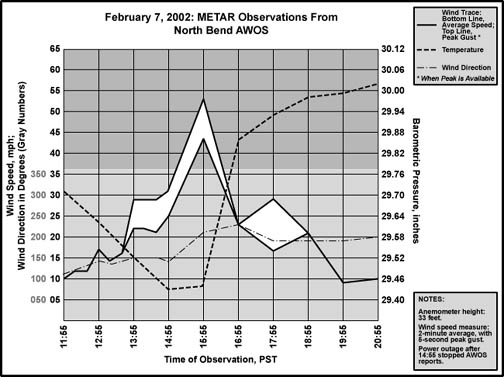
A Look at the Coast, Arcata to Quillayute The wind and pressure conditions at North Bend, OR, are graphed out in Figures 21 and 22, below, for the December and February storms. The most striking difference between the storms is in the pressure traces. It took the December storm over four hours to produce a relative pressure elevation that was on par with the one-hour surge of 0.42" witnessed during the February cyclone. During the February event, winds shifted from southeast to south-southwest, then southwest in a fairly routine fashion as the baromter bottomed out and then started to climb. For the December storm, there's a brief period of southerly winds near the barometric minimum, and then a surge of WNW winds that lasts for nearly three hours. This suggests that the bent-back occlusion struck North Bend with more of a broadside during the December storm. The February event , it seems, only grazed the location with the bent-back. Note: During the February storm, the North Bend AWOS stopped reporting after 14:55, probably due to a power failure. This would have resulted in a large data hole after that time period, save for the fact that hourly observations were still be taken by hand at North Bend, data which are thankfully used in the meteogram. From a number of unofficial sources, peak gusts of 75 to 95 mph were suggested for Coos Bay Area. If this was the case, then these terrific winds probably occurred between 15:55 and 16:55, during the hour of the massive pressure surge. Source: For these and the following meteograms (Figures 23-24) in this section, all data is from the National Weather Service, Portland office, METAR reports, and the National Data Buoy Center, realitime meteorolgical data. |
|
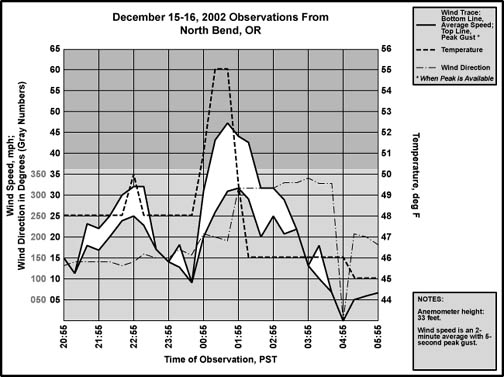
| There's evidence of a double-dip in the pressure trace for the December storm, with a 0.03" jump at 23:15, long before the minimum at 01:35. The first barometric climb was probably due to the passage of the storm's leading front, as suggested by Figure 23, below, which plots temperature against wind. Note that at 22:55, there was a brief temperature spike to 50º F in association with a period of elevated winds of 25 mph gusting to 32 out of the southeast. The time 22:55 also happens to contained the first barometric low point of 28.95", and the brief jump to 28.98" happens over the next 20 minutes. These conditions appear to signify a weak front: the storm's leading occlusion. After the occlusion passed, the pressure declined again. From 00:55 to 01:35, a much stronger climb in temperature occurred, with a jump of 7º F to 55º, in association with strong south to south-southwest winds that peaked at 47 mph by 01:35, which also happened to be the time of the final 28.89" barometric minimum. Then the wind shifted to the west-northwest, and the temperature crashed 9º in 20 minutes to 46º. The pressure surged upward afterwards. The low had passed its closest point to North Bend, and dragged its trailing bent-back occlusion through the area. And the double-dip in pressure was complete. |
|
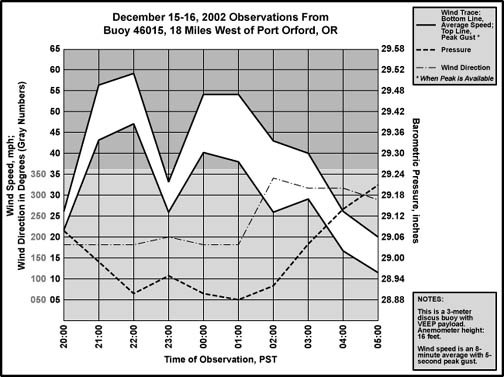
| The double-dip turned up at other places on the Southwest Coast. Figure 24, below, shows the conditons at Buoy 46015, which is located 18 miles west of Port Orford, OR. The double-dip signature is strong, and showed up quite well in the hourly data. Wind conditions show a remarkable relation to those at North Bend, save that the strongest values, gusts to 59 mph, were achieved during the arrival of the leading front. Temperatures climbed from 56.7º F to 59.4º during this first surge of wind, and then dropped back to 57.6º at 23:00, when winds had decreased to 34 mph in gusts, and the barometer had jumped to 28.95" from 28.90" in the hour previously. Then the barometer started to fall again, reaching 28.88" by 01:00 with south winds elevating to 54 mph in gusts. The temperature climbed to 60.4º F during this second bout of south winds. The center of the cyclone had reached its closest point to the Port Orford buoy. After 01:00, winds shifted to the west-northwest, began to slow, the temperature crashed to 52.3º F, and the barometer began a climb that would soon cover 0.10" an hour for several observation periods. The ever-familiar bent-back had arrived, finishing a strong double-dip signature at Port Orford. |
|
| The double-dip turned up inland as well, but didn't show up as strongly in the official data. An argument could be made for the slight 0.01" rise in the Corvallis pressure data at 23:55. On my own unoffical barometer, the double dip showed up more strongly than this. At 01:36, the barometer briefly read 28.91" before starting a climb that reached 28.94" at 01:55. Then the pressure fell again to 28.91" by 02:16. The 40-minute period over which the double-dip happened at my location wouldn't show up well in the hourly data. This probably explains why Corvallis, with 20-minute observations, is among the few inland stations to indicate any kind of double-dip. Eugene's flat readings of 28.93" from 00:55 to 01:55 suggest a possible double-dip masked by the hourly resolution of the data. |
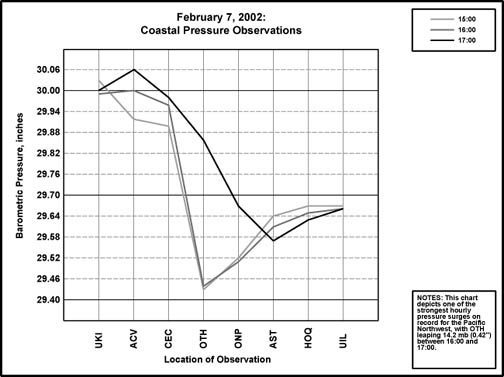
Moving to coastal gradients, Figures 25 and 26, below, show south-to-north pressure cross sections for each storm for three separate hours. As with the interior cross sections, the coast readings prove to be much more extreme in gradient and speed-of-change during the February 7, 2002 cyclone. Note that the December 16, 2002 readings, which look as dynamic as the February storm's in the graphic, represent 4-hour intervals, while the February pressures mark much shorter 1-hour intervals. A steep, cliff-like, gradient is situated about 100 miles further south during the December storm when compared to the February event--from UKI to CEC, compared to CEC-OTH. This appears to have been enough of a difference to spare most of Oregon the damaging winds witnessed in California during the December storm. Strongest winds were experienced in a broad swath between 100 to 300 miles south of the cyclone's center, which fits the position of the steepest gradient. For the February storm, the concentration of steep gradient to the region between CEC and OTH appears to have kept the strongest winds confined to a tighter belt reaching out to about 125 miles south of the center on the coast, and about 50 miles in the interior. The major 1-hour pressure surge of 14.2 mb (0.42") is evident in the February graphic--there is the feeling that, as the storm reached its closest point to OTH, the rapidly dropping barometer was like a tightening spring, with a sudden leap back to more relaxed values upon release as the cyclone raced away. Sources: Pressure and wind data for the February 7, 2002 and December 16, 2002 storms are from the National Weather Service, Eureka, Portland and Seattle, METAR reports, and the National Data Buoy Center, realtime meteorological data. |
|
Tables 3 and 4, below, show the pressure gradient numbers for the two storms. Like with the interior stations, the signature of the February 7th storm is much stronger when compared to the December storm, with healthy negative gradients north of the low, and powerful positive gradients south. For both storms, over time, many negative gradients switched to positive as the centers moved northeastward, putting the stations in the southwesterly gradient behind the low. The CEC-OTH measure, which is over a distance of about 120 miles, reaches phenomenal levels during the February storm. The reading of +17.6 mb (about 0.15 mb per mile) at 16:00 is among the highest readings for that measure. The Columbus Day Storm of 1962 achieved a whopping +19.3 mb (0.16 mb per mile) for this part of the coast. During the February 2002 storm, note the sudden reduction to +4.0 mb for the CEC-OTH gradient in the hour after the maximum gradient, a reflection of the massive 14.2 mb 1-hour pressure surge that occurred at OTH. Not even the Columbus Day Storm managed such a gradient change, with a maximum hourly change from +15.6 mb at 16:00 to +8.2 at 17:00. For the CEC-OTH measure, the December 2002 storm doesn't even come close to achieving the kind of gradients and pressure swings seen during the February event. There is a fairly sudden drop in the CEC-OTH gradient from +5.1 mb to +1.0 between 01:00 and 02:00 on December 16th, a reflection of a fast, but not atypical, pressure rise of about 3.0 mb in an hour at OTH. The difference in gradients between the two storms is so significant that it is the best explanation of the lower wind speeds during the December event. For Oregon, that is. The area where the December 16, 2002 storm shines is for the ACV-CEC measure, and southward. With a +8.5 mb peak, this storm managed twice the gradient of the maximum +4.1 mb seen during the February storm. Indeed, +8.5 mb beats the +6.8 mb maximum during the Columbus Day Storm. With such a strong reading, it's a wonder that peak gusts were generally in the 60 to 65 mph range in Humboldt and Del Norte counties, and not higher. The peak gradient for the measure SFO-ACV was +19.7 mb at 22:00 during the December storm, which is not quite as strong as the +22.0 mb recorded during the Columbus Day Storm, but still fairly extreme. For comparison, the February 7, 2002 storm produced a relatively gentle +11.1 mb gradient for the SFO-ACV measure, a reflection of the storm's more compact nature. During the February storm, gusts peaked at 37 mph at San Francisco, while the December storm threw winds as high as 61 mph at the City by the Bay. Sources: Pressure and wind data for the February 7, 2002 and December 16, 2002 storms are from the National Weather Service, Eureka, Portland and Seattle, METAR reports, and the National Data Buoy Center, realtime meteorological data. Pressure data for the Columbus Day Storm was obtained from the National Climatic Data Center, unedited surface observation forms. |
Coastal Pressure Gradients, December 15-16, 2002, Times are PST | ||||||
| Time | ACV-CEC |
CEC-OTH |
OTH-ONP |
ONP-AST |
AST-HOQ |
HOQ-UIL |
| 18:00 | +4.4 |
+4.5 |
-0.1 |
+1.1 |
+0.2 |
+4.3 |
| 22:00 | +4.4 |
+5.4 |
-3.1 |
-2.6 |
+0.7 |
+1.6 |
| 02:00 | +8.5 |
+1.0 |
+1.3 |
-1.3 |
-0.9 |
+0.8 |
| 06:00 | +2.2 |
+1.0 |
+2.9 |
+4.2 |
+0.3 |
+1.6 |
| 10:00 | -0.4 |
+1.1 |
+1.7 |
+3.2 |
+2.2 |
+2.0 |
| Notes: ONP pressures from C-MAN station NWPO3. OTH pressures from C-MAN station CAR03. CEC pressures for 02:00 and 06:00 were missing, and data from buoy 46027, 10 miles NW of CEC, were used to fill the gaps. | ||||||
Coastal Pressure Gradients, February 7, 2002, Times are PST | ||||||
| Time | ACV-CEC |
CEC-OTH |
OTH-ONP |
ONP-AST |
AST-HOQ |
HOQ-UIL |
| 14:00 | +4.1 |
+6.4 |
-2.6 |
-2.3 |
-1.5 |
+0.4 |
| 15:00 | +0.6 |
+15.9 |
-3.0 |
-4.1 |
-1.2 |
+0.0 |
| 16:00 | +1.3 |
+17.6 |
-2.2 |
-3.6 |
-1.4 |
-0.2 |
| 17:00 | +2.8 |
+4.0 |
+6.4 |
+2.7 |
-1.2 |
-1.0 |
| 18:00 | +1.6 |
+4.4 |
+5.2 |
+5.1 |
-0.3 |
-0.8 |
| Notes: ONP pressures from C-MAN station NWPO3. | ||||||
A Closer Look at the California Pressures Tables 5 and 6, below, summarize the gradients for the December and February storms for a number of measures from San Francisco north. Peak values for the December storm--which were all captured in the table even with the 4-hour sample rate, save for STS-UKI which peaked at +4.0 at 23:00--are significantly higher than the February event. As mentioned above, the +8.5 mb for the ACV-CEC is higher than that produced by the Columbus Day Storm. The +11.2 mb value for the UKI-ACV measure is strong, but it doesn't best the Columbus Day Storm's steep reading of +16.1 (established at 11:00). Surface pressures weren't noted in the STS observation forms during the 1962 time period. One measure that can be used for comparing the December 2002 cyclone to the Columbus Day Storm for the area south of UKI is the SFO-UKI measure. In this case, the December cyclone wins by a small margin with a peak of +8.7 mb at 23:00, just 0.8 mb above the +7.9 reading established during the tempest of '62 at 14:00. In conclusion, gradients during the December 16, 2002 cyclone approached, and sometimes exceeded, the levels established during one of the most destructive windstorms in the history of Northern California, that of October 12, 1962. For the February 7, 2002 storm, California gradients weren't particularly extraordinary, which fits with the lower peak gusts during this event. Sources: Pressure and wind data for the February 7, 2002 and December 16, 2002 storms are from the National Weather Service, Eureka, Portland and Seattle, METAR reports, and the National Data Buoy Center, realtime meteorological data. Pressure data for the Columbus Day Storm was obtained from the National Climatic Data Center, unedited surface observation forms. |
| ||||||||||||||||||||||||||||||||||||||||||||||||||||||||||||||||||||||||||||||||
December 15-16, 2002: General Storm Data Table 7, below, lists the barometric minimums for the December 15-16, 2002 storm at selected sites. Though these readings aren't records, they are quite low. Many of these numbers mark the lowest readings in several years at their respective locations. Sources: National Weather Service, Eureka, Portland and Seattle offices, METAR reports, and the University of Washington archived surface observations. |
|
Table 8, below, lists the maximum gradients for some standard measures during the December 15-16, 2002 cyclone. Many of these gradients were achieved long after the center had passed to the northeast, when the modest gradient of the storm's southwest quadrant was carried through the region. During the time interval when the storm approached the Southwest Oregon coast and neared the Willamette Valley, from 22:00 to 01:00, negative gradients abounded at many of these stations. Peak negative gradients included: -5.7 for OTH-AST at 22:00 on the 15th, -0.3 for AST-UIL at 01:00 on the 16th, -3.6 for OTH -UIL at 23:00 on the 15th, -2.4 for EUG-PDX at 23:00 on the 15th, -2.2 for PDX-SEA at 01:00 on the 16th, and -1.7 for SEA-BLI on the 16th. The pre-storm negative gradient for the AST-DLS measure is hard to separate from the earlier storm on the 15th, and appears to be -5.2 at 21:00 on the 15th. Sources: National Weather Service, Eureka, Portland and Seattle offices, METAR reports, and the University of Washington archived surface observations. |
|
Table 9, below, summarizes the peak winds for the December 15-16, 2002 cyclone taken from the METAR reports. "Peak Wind" is a 2-minute average, and "Peak Gust" is a 5-second average. NWS Eureka, in their daily climate summaries, reported a peak gust of 60 mph for Eureka / Arcata on December 15th, and a peak of 49 mph on December 16th. At 09:55, Portland had sustained winds of 18 mph gusting to 22 out of 200º at 09:55 as the low tracked across Eastern Washington--events at the bent-back occlusion were put in the table in favor of these post-storm southwesterlies. The daily climate summary for December 16th, valid at 14:00 on the 16th, also reports the later southwesterly values as Portland's highest for the day. Portland was on the periphery of areas north that recieved their strongest winds out of the south to southwest long behind the storm, and areas south that recieved their strongest winds before or immediately during the arrival of the storm's bent-back occlusion in the early morning. Sources: National Weather Service, Eureka, Portland and Seattle offices, METAR reports, and the University of Washington archived surface observations. |
| Location | Peak |
Direction |
Obs Time of |
Peak |
Direction |
Obs Time of |
| California: | ||||||
| Arcata | 32 |
200º |
02:53 HRS, 16th |
41 |
200º |
02:53 HRS, 16th |
| Oregon: | ||||||
| North Bend | 32 |
320º |
01:55 HRS, 16th |
47 |
190º |
01:35 HRS, 16th |
| Astoria | 20 |
260º |
09:55 HRS, 16th |
31 |
260º |
07:31 HRS, 16th |
| Medford | 17 |
120º |
02:53 HRS, 16th |
38 |
200º |
04:53 HRS, 16th |
| Eugene | 22 |
220º |
03:53 HRS, 16th |
35 |
180º |
12:54 HRS, 16th |
| Salem | 23 |
280º |
04:34 HRS, 16th |
32 |
280º |
04:34 HRS, 16th |
| Portland | 17 |
310º |
04:41 HRS, 16th |
22 |
310º |
04:41 HRS, 16th |
| Washington: | ||||||
| Quillayute | 15 |
250º |
10:17 HRS, 16th |
23 |
250º |
10:17 HRS, 16th |
| Olympia | 15 |
210º |
14:54 HRS, 16th |
21 |
210º |
14:54 HRS, 16th |
| Sea-Tac | 18 |
200º |
13:56 HRS, 16th |
28 |
200º |
13:56 HRS, 16th |
| Bellingham | 16 |
170º |
11:22 HRS, 16th |
23 |
170º |
11:22 HRS, 16th |
| AVERAGE | 20.6 |
231º |
31.0 |
223º |
References Dec 16 2002 |
Last Modified: March 9, 2003 You can reach Wolf via e-mail by clicking here. | Back | |