Intense Cyclones Over the Northeast Pacific December 14-16, 2002 compiled by Wolf Read |
|
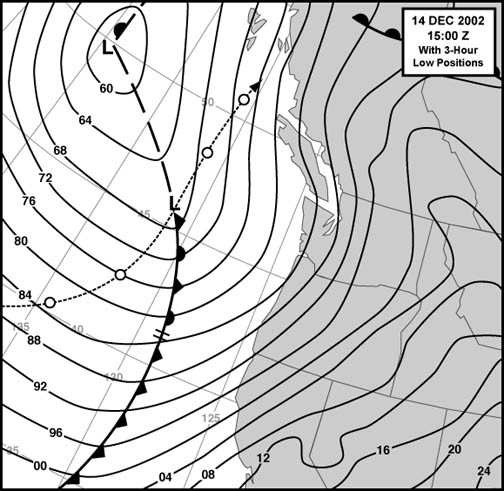
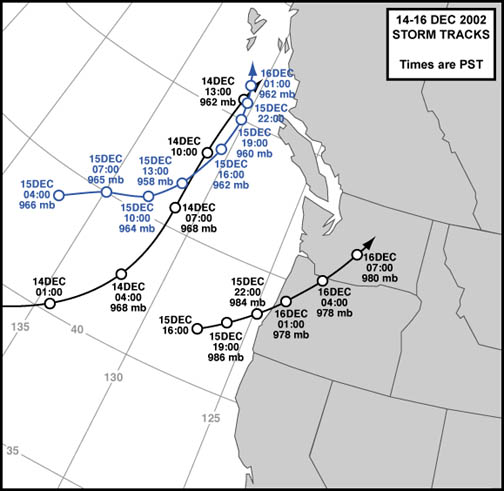
During the time period December 14-16, 2002, three cyclones threatened the Pacific Northwest with high winds. All these storms were secondary features spun off parent lows to the north. The third event could also be seen as a tetiary development. The first two lows were particularly strong, and had minimum central pressures below 960 mb. With tracks just outside of 130º W, much of the region was spared damaging winds, except on the immediate coastline. Also, development of the third low along the second's strong cold front relaxed pressure gradients across Oregon and Washington, sparing many interior sections the 40 to 50 mph gusts originally forecast. Data from offshore buoys, however, reveals the strength of the first two systems. The final low of the series wasn't as deep, reaching 978 mb. The significance of this cyclone is that its center followed a similar track to the destructive February 7, 2002 South Valley windstorm. Apparently due to having weaker gradients around the core, and slower speed, this repeat event didn't produce the powerful winds seen in February. However, data collected yields some nice comparisons between events. While the low relaxed gradients to the north, this same development tightened the gradients southward across Northern California. Wind along the coast gusted into the 60-mph-range from San Francisco to Port Orford. Figure 1, above, shows the paths that these lows followed. These tracks are derived from the National Weather Service surface analysis maps for the Pacific and North America. December 14, 2002: A Fast-Moving Secondary Low On December 13th, a deep sub-960 mb low moved into the Gulf of Alaska, dragging a long cold front that reached across 20º of latitude south and east of its center. A wave developed along the trailing end of this cold front and rapidly swung around the base of the parent low, yielding the situation depicted in Figure 2, below, by 07:00 PST. The wave underwent cyclogenisis as it curved to the northeast and then north, and moved rapidly through the outer waters of Oregon and Washington. Source: National Weather Service, North American surface analysis maps for 14DEC2002. |
|
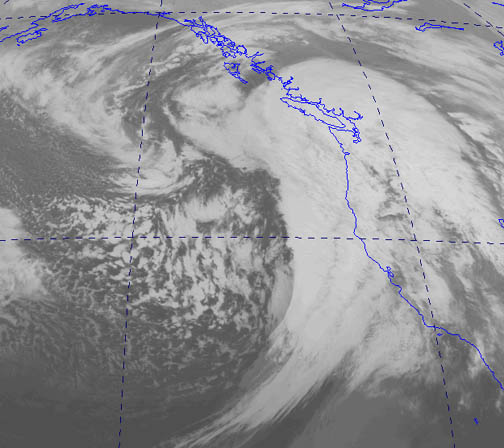
| The 8-km resolution satellite picture, Figure 3, below, shows the cloud conditions at the same time as the surface map above. The bright white cloud sheld along the cold front is the mark of strong development. Off the Oregon coast, a hook, or bent-back occlusion, can bee seen near the storm's center. Had the surface cyclone been about 3-5 degrees longitude closer to the coast, this system might have been a potent windstorm. With the low so far offshore, the sharp gradients over land reamined strongly east to southeast, which prevented a powerful southerly gale from setting up in the interior valleys. Source: All satellite photos in this section are courtesy of the University of Washington Archives for weather data. |
|
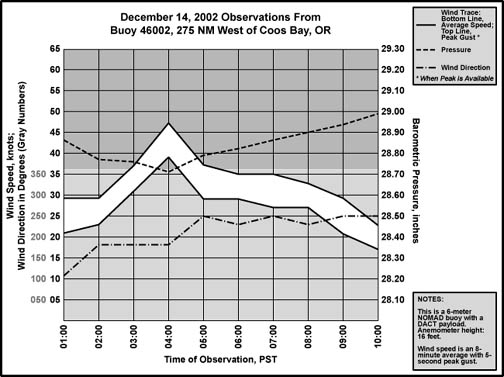
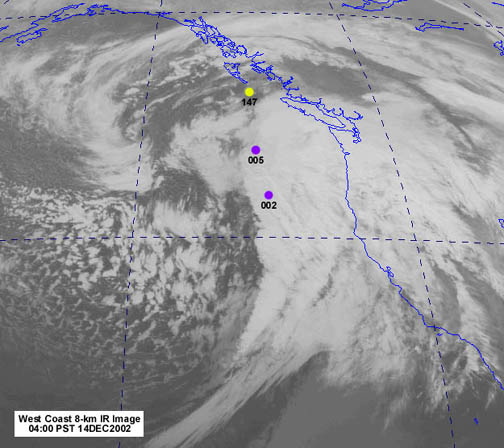
The storm center tracked very close to the outer weather-monitoring buoys operated by NOAA and Environment Canada, which are stationed near the critical 130º W longtidue line. The potency of this cyclone was revealed at these monitoring sites. The data from three buoys are examined here. The locations of these stations are indicated in the satellite photos below. Buoy 46002, Oregon, 257 nautical miles west of Coos Bay, was among those first in line for the storm's wrath. The meteogram for this station is shown in Figure 4, below, with a satellite photo, Figure 5, taken near the time of minimum pressure, below the meteogram. In the satellite photo, the strong cold front is near the station, with a developing hook stretching out to the northwest of the buoy. The low center was very close to 002, and was passing to the west on its northward track. The baromter fell to 28.71", a fairly low reading, though not unprecendented for the area. The peak rate of declension was -0.13" (-4.4 mb) per hour for two consecutive hours from 23:00 on the 13th to 01:00 on the 14th, and maximum climb was a +0.08" (+2.7 mb) per hour from 04:00 to 05:00 on the 14th. Sustained wind gusts reached 47 knots (54 mph) from the south at the time of minimum pressure. Wind direction shifted to the west-southwest as the barometer began to climb, the mark of a storm center to the northwest. Within an hour of maximum winds, ocean wave height reached 30 feet at this location. Source: Meteorological data for Figures 4, 6 and 8 are courtesy of NOAA's National Data Buoy Center. |
|
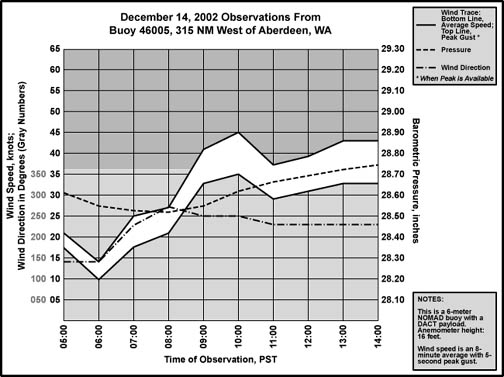
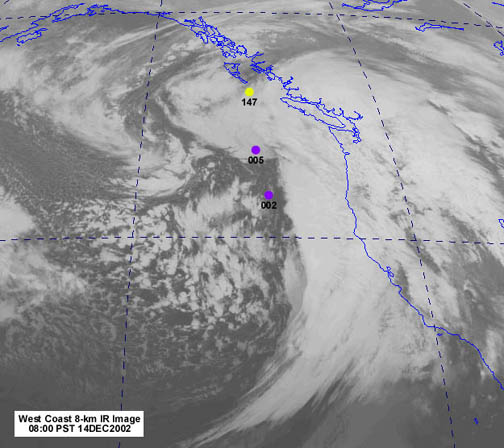
| Buoy 46005, Washington, 315 nautical miles west of Aberdeen, was next in line. The meteogram for this station is shown in Figure 6, below, with a satellite photo, Figure 7, taken near the time of minimum pressure, below the meteogram. The lowest barometric reading, a striking 28.52", happened at 08:00, about four hours after the low point at station 002. Peak rate of fall was -0.09" (-3.0 mb) per hour from 01:00 to 02:00, and maximum climb was +0.07" (+2.4 mb) per hour from 09:00 to 10:00. Station 005 is right under a bent-back back occlusion that looks more developed than previously. With peak winds of 45 knots (52 mph) happening after the pressure low, and from a west-south-west direction, it seems the cyclone's center passed to the west of this station as it did with 002, or nearly overhead. With the surge of strong westerly winds, it appears this station got "stung," or nearly so, by the "poisonous tail" of the bent-back, as some experts call this phenomenon. Rates of pressure rise, however, aren't usually fast in this case, suggesting a marginal stinging event (a stronger case will be examined for the December 15th cyclone, Figure 14 in the next section). |
|
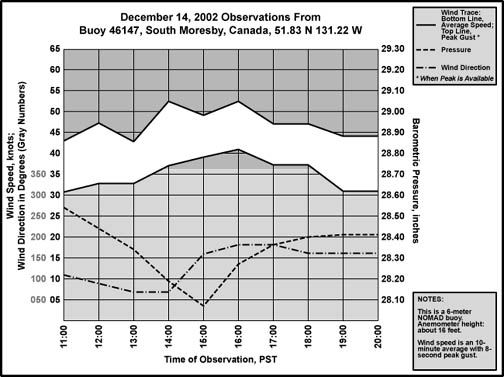
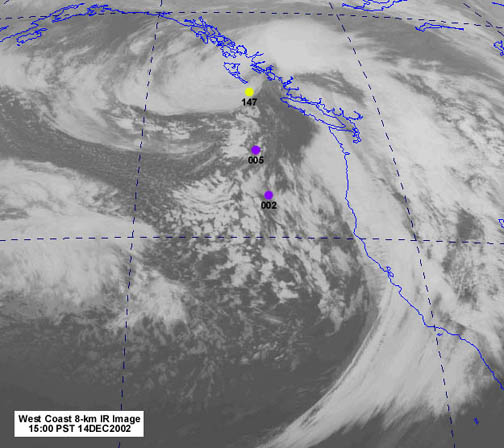
| Buoy 46147, South Moresby, an Environment Canada station, indicates a storm that continued to intensify after it passed 005. The meteogram for 147 is shown in Figure 8, below, with a satellite photo, Figure 9, taken near the time of minimum pressure, below the meteogram. The lowest barometric reading, an incredible 28.07", happened at 15:00, about seven hours after the low point at station 005. The low pressure, which converts to 950.6 mb, is on par with the lowest official readings during the landfall of the "Long Island Express" hurricane in New England on September 21, 1938 [1]. If the December 14th reading is accurate, then it also suggests that the central pressure obtained from the NWS surface maps and used in Figure 1 are about 10 mb high at the north end of the track. Peak sustained gusts reached 52 knots (60 mph) first out of the east-southeast, then switching to south and eventually south-southeast. The change to a southerly direction happened right at the barometric low point, and was preceeded by a rapid fall of barometer which peaked at a rate of -0.15" (-5.1 mb) per hour. There was a corresponding surge of +0.20" (+6.7 mb) in an hour after the barometric low point. These tendencies suggest an intense, fast-moving, system. The pressure rise more-or-less levels off after 18:00 at around 28.41". The pattern of wind direction does not support a bent-back attack from the west side of the cyclone. The cyclone appears to have passed immediately to the west of the station, which might be deemed contradictory, for the satellite photo seems to suggest that what appears to be a big, blobby bent-back is right over the station. Closer examination of the image reveals the possibility that the low center is just east of the the South Queen Charlottes, with the tip of the bent-back curling around the base of the low and over Buoy 147. Thus, this may be a case of a southern brand of bent-back attack. Finally, it appears that this cyclone left the area in a hurry, as pressures quickly went back to the levels supported by the sub-960 mb semi-permanent parent cyclone that was roughly west of the station, with southeast-wind-supporting isobars curved sharply around the low in the area of the station. Maybe the secondary low became absorbed by the primary during the night. |
|
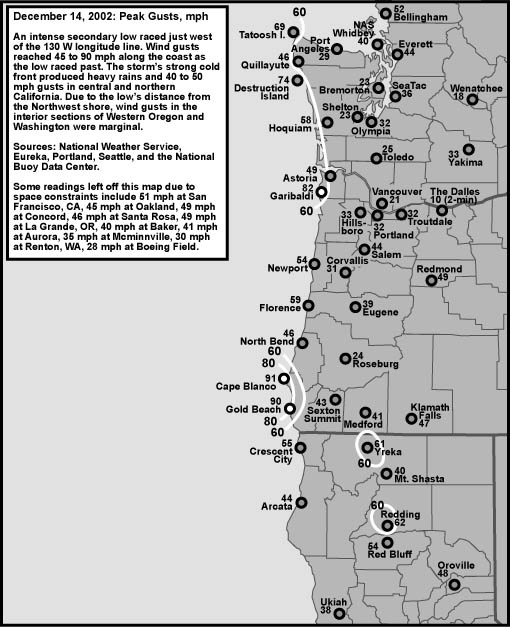
| Moving from the ocean to the Pacific Northwest, Figure 10, below, a peak gust map for the region, reveals that the strongest winds tended to hug the coastline, espcially along exposed headlands, with gusts in the 45 to 90 mph range. The fastest bursts in the interior sections west of the Cascades happened in the typical wind-prone areas like Bellingham, Everett and Salem, with readings in the 40 to 55 mph range. Other interior sections experienced typical winter storm winds with gusts from 20 to 35 mph. The high 50 to 65 mph gusts in the Northern Sacramento Valley are a fairly standard occurrence with a distant cyclone of this strength. The Sacramento Valley has a decent orientation for a southeast pressure gradient, unlike the more north-south trending valleys like the Willamette. The storm's distance from the coast kept the strongest gradients in a southeast direction. Had the cyclone's center tracked closer to the coast, the gradients could have shifted to a more southerly orientation as the low passed to the north, and allowed for stronger winds in the Northwest's interiror valleys. Data source for peak gusts: National Weather Service, Eureka, Portland and Seattle. |
|
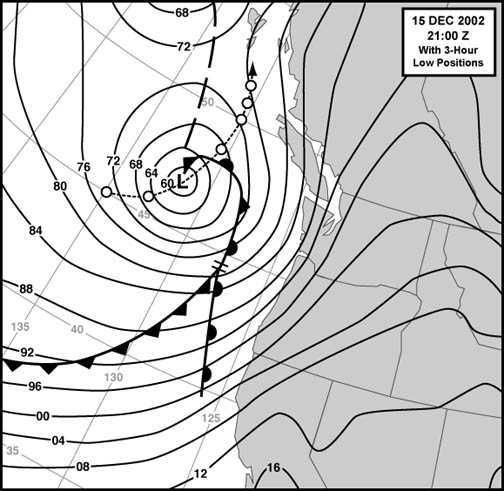
In conclusion, the strong, fast-moving December 14, 2002 cyclone spared the Pacific Northwest by tracking west of the 130º W longitude line, where it spent most of its fury on official weather buoys. Nevertheless, strong winds raked the immediate coast in typical winter storm fashion, with gusts of 75 to 90 mph in particularly exposed locations. People in the populated interior sections underwent their daily activities during a straightforward blustery day, velocities that relegate this storm to the annals of obscurity, like so many wet season cyclones. December 15, 2002: A Possible Strong Gale Fizzles The cyclone of December 15, 2002 had some promise for a significant windstorm, especially in Washington, but other events interviened. Figure 11, below, shows surface conditions at 13:00 PST, about the time when the strongest winds were starting along the coast and interior valleys. There's a nice closed low, with a central pressure somewhere around 957 mb, swinging around an equally deep parent in the Gulf of Alaska. This was a very potent system, with the promise of even stronger winds for the Pacific Northwest than those of December 14th, even though the low was traking along a path similar to the first system. However, the pattern was very unstable during this episode of storms. Off the Oregon coast, a triple-point indicated along the storm's frontal system. Just south of the triple-point, a wave had started to develop. The broader spacing of the isobars from about 42º N to 39º N is an indication of this developing wave near the triple-point. This process would eventually slow the main front down, and relax pressure gradients over much of Oregon and Washington, just as the parent cyclone was positioning itself for the strongest winds in the Pacific Northwest. And the winds faded. Map source: National Weather Service, North American surface analysis maps for 15DEC2002. |
|
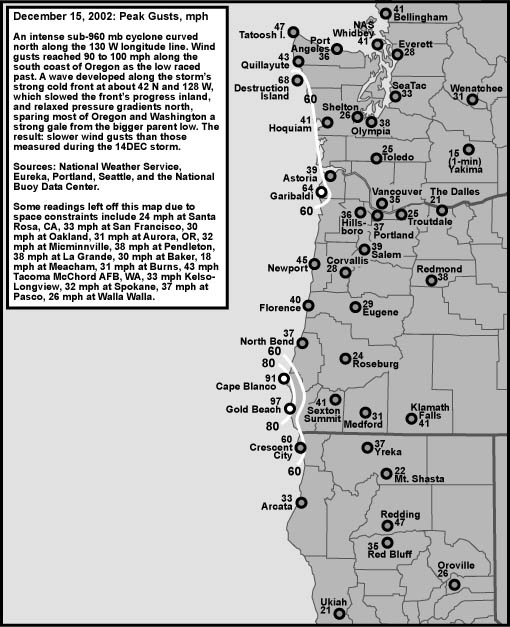
| Peak gusts for this storm are indicated in Figure 12, below. For the Willamette Valley, the wind forecast from the National Weather Service, Portland, was for 20 to 35 mph with possible gusts to 50 as the strong cold front crashed ashore. The sudden development of the wave--in this case termed a "sub-grid" feature (small enough that the sparse network of buoys offshore didn't pick up the development very well)--halted the front's progress, and smoothed out the gradients. Gusts in the Willamette Valley didn't quite make it to 40. This despite the fact that air surges were approaching 100 mph on the South Oregon Coast during the afternoon, before the developing wave changed local wind conditions. As mentioned, there was strong instability in the overall weather pattern at this time, with the tendency of waves to develop along trailing frontal systems. A wave slowed down a front in a similar manner on December 12th, and there's some indication that it was trying to happen again during the December 14th storm. This time, on December 15th, the wave went into full-blown cyclogenesis, but this is the story for the section on the December 16th storm. Data source for peak gusts: National Weather Service, Eureka, Portland and Seattle. |
|
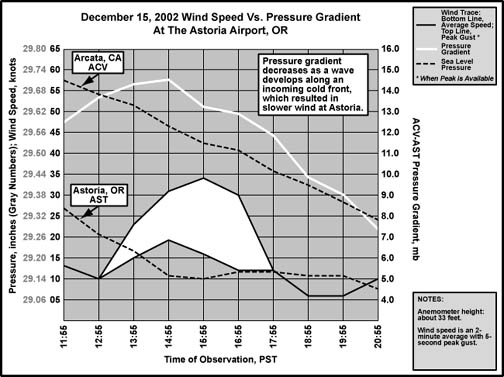
| A nice example of the developing wave interfering with the pressure gradient and peak wind speeds can be seen in data from the Astoria Airport, and the Arcata Airport, Figure 13, below. In this instance, Astoria's pressure was declining at a faster rate than Arcata's up until 14:55, when the barometer leveled off at the northern station. This was the time of maximum gradient, and winds at Astoria had responded to the +14.3 mb reading with a sustained velocity of 19 knots gusting to 34 (22 mph gusting to 39). However, after the 14:55 leveling at Astoria, Arcata's barometer continued to fall as the wave developed and began to near the southern station. Astoria's greater distance from the developing wave kept the station out of the area of decreasing pressure until late. This allowed Arcata to "catch up," which led to a reduction in the ACV-AST gradient and a corresponding decrease in wind speed at Astoria. The developing wave also slowed down the cold front, the weather feature that was supposed to bring the strongest winds to Northwest Oregon. The final outcome of the new wave: the strong 60 to 70 mph gusts forecast for Oregon's North Coast, including Astoria, did not occur. Source: Meteorological data for Arcata and Astoria are from the National Weather Service, Eureka and Portland, taken from METAR postings. |
|
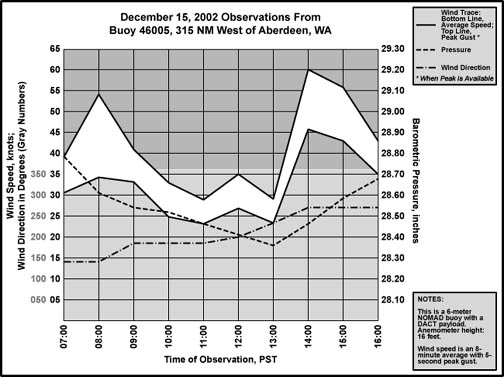
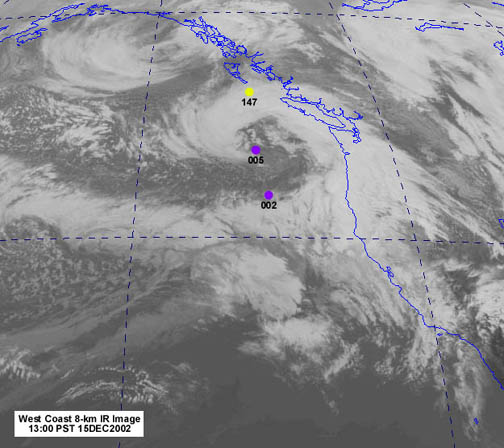
| Moving offshore, events on December 15th bring the discussion back to buoy 46005 some 315 nautical miles off of the Washington coastline. Figure 14, below, shows the wind and pressure conditions at station 005 during the December 15th storm. After being raked with a bent-back occlusion with sustained gusts to 45 knots (54 mph) just 30 hours before, the new cyclone also dragged its own bent-back occlusion through the region. This repeat, however, is much more intense. There's a period of strong southeast to south winds as the low moved in out of the southwest, with gusts reaching as high as 62 mph at 08:00 PST. The pressure underwent a rapid fall at this time, achieving a -0.17" (5.7 mb) drop in the single hour ending at 08:00. Winds decreased markedly after 09:00 and maintained about 25 knots (29 mph) until about 13:00, with the barometer continuing to drop. The pressure low was 28.37" (960.7 mb) at 13:00, an indication that the center of the cyclone was nearly over the station. The satellite picture, Figure 15, below, is from this timeframe. The image from space is a beautiful example of a strong low with a well-developed bent-back occlusion. And the bent-back just touches the region around 005. The final result is clear in Figure 14: By 14:00, west winds had jumped to 47 knots gusting to 60 (54 mph gusting to 69), much stronger than the bent-back occlusion winds of the day before. Barometric pressure raced upwards after 14:00, peaking at +0.13" (4.4 mb) an hour from 14:00 to 15:00. Sources: Meteorological data for Figure 14 is courtesy of NOAA's National Data Buoy Center. The satellite photo is courtesy of the University of Washington Archives for weather data. |
|
In summary, the December 15, 2002 cyclone had a lot of promise for strong, even extreme winds, in the Pacific Northwest, but failed to realize its potential when a wave developed along the system's trailing cold front off of Southwest Oregon and relaxed pressure gradients over the region. Like its predecessor the day before, most of this cyclone's fury was relegated to the offshore waters, and some select spots along the coastline. Of particular insterest is that this cyclone offered up a nice example of high winds along a bent-back occlusion at buoy 46005. And, by developing the wind-deadening wave along its front, this storm spawned the next event in the series. December 15-16, 2002: Return of the South Valley Storm The secondary (tertiary?) cyclone of December 15-16, 2002 was the weakest low of the three covered in this study. Peak winds in Oregon and Washington were generally below high wind criteria, save for some places on the South Coast, and east of the Cascades which ended up south of the storm's center. The December 16th SVS wouldn't have been that noteworthy save for the fact that it contributed to lowering windspeeds during the cyclone of the 15th, and, more importantly, that it followed a path that nearly matched the destructive February 7, 2002 SVS event. Cyclones using a northeast route through the heart of Western Oregon are rare. To have two storms follow this route in the same year is itself noteworthy. Because of its track, this storm offers a nice dataset to directly compare to the earlier event. Some interesting patterns emerge. Also, this SVS contributed to the tightening of gradients south of Coos Bay, and this, combined with the incoming chunk of cold front that the newborn cyclone stole from the December 15th storm, produced a significant windstorm in Northern California from the San Francisco Bay Area northward. Due to the unique nature of this event, the examination has been given its own web page: December 16, 2002. |
References [1] Information on the September 21, 1938 hurricane is from Simpson, Robert H. and Riehl, Herbert, "The Hurricane and its Impact," 1981, p 123, Louisiana State University Press. |
Last Modified: March 5, 2002 You can reach Wolf via e-mail by clicking here. | Back | |