|
December 25, 2005: The Christmas Day Gale compiled by Wolf Read |
|
|
|
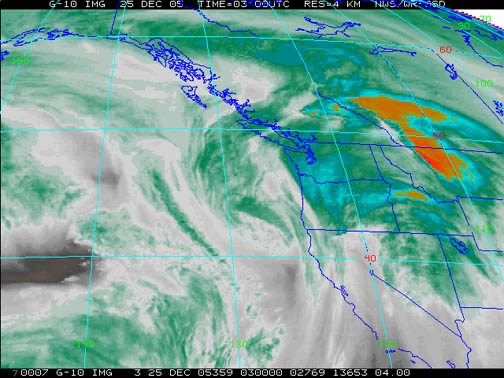
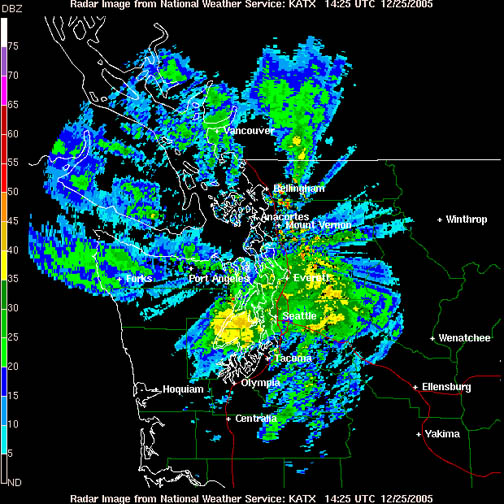
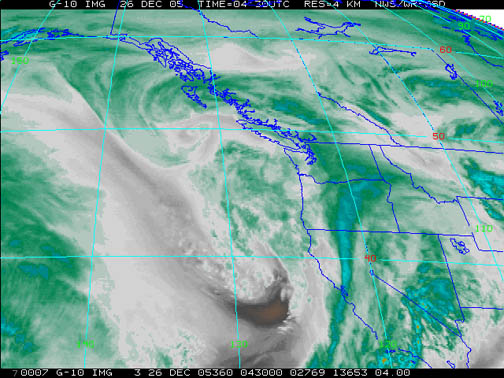
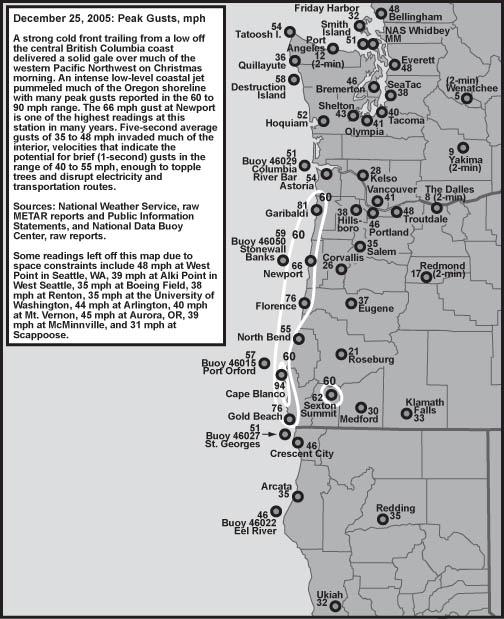
On Christmas morning of 2005, a strong cold front trailing from a cyclone off of the central British Columbia coast rapidly swept into the Pacific Northwest. This vigorous atmospheric wave brought with it a powerful gale on the Oregon coast, and a strong gale to large sections of the interior. With a blast to 66 mph, the Newport airport had one of its fastest gusts since the January 16, 2000 windstorm. The Florence Coast Guard recorded a punishing 76 mph burst, and Garibaldi received a surge to 81 mph. These values all mark a strong low-level coastal jet that set up ahead of the incoming front. Such jets are generated when airflow off the Pacific Ocean interacts with the steep terrain on the coast. Notice the lower peak wind readings at the nearshore buoys: 51 to 59 mph. Inland, official 5-second gusts generally ranged from 35 to 48 mph with some exceptions. These velocities indicate the possibility of brief (1-second) gusts in the range of 40 to 55 mph. Though such winds are not considered "high wind criteria" by the NWS, these values can topple large trees, especially with saturated soil conditions, and cause widespread if but scattered disruption of infrastructure. The Northwest Interior of Washington seemed to receive the most consistently strong gale among the inland sections, with 5-second gusts of 40 to 48 mph along the I-5 corridor, though parts of the Portland Metro area had similar values. The Mid- and South-Willamette Valley was generally spared the heavier winds, as was a large part of the southwest Washington interior, both places generally getting gusts in the range of 26 to 37 mph. This front arrived on the heels of an unusually warm airmass, which brought temperatures well into the 60s on Christmas Eve. Heavy rain, if but for a short time, accompanied the cool Pacific band as it moved inland and quickly shunted away the pleasant, mild air. Here are my journal notes about the Christmas Day gale: |
|
|
|
|
|
|
|
|
December 25, 2005: Comparative Meteorological Details |
|
General Storm Data Barometric Minima Table 1, below, lists the barometric minimums for the December 25, 2005 storm at selected sites. Many Pacific Northwest windstorms have produced significantly lower readings. The most depressed pressures in the Northwest during the Christmas Day gale were along the tip of the Olympic Peninsula, and included 29.35" (993.9 mb) at 05:00 on the 25th at Tatoosh Island, and 29.38" (994.9 mb) at Destruction Island at 03:00. Sources: National Weather Service, Portland and Seattle offices, METAR reports, and the National Data Buoy Center, historical meteorological data. |
Table 1 Notes: [1] Last of two hourly occurrences at Medford, the second having been noted at 20:00 HRS on the 24th. |
|
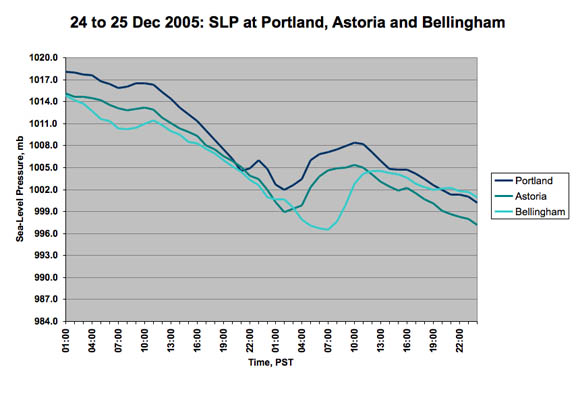
Figure 5, below, shows the pressure trends at three different stations that were strongly effected by the cold front. Portland had a classic double-dip: in this case, the first dip was accompanied by a reduction in east winds, a shift to the NNW and then a period of calm. East winds resumed afterward. It appears that the front had a double structure, which didn't show up as strongly on the coast, at Astoria. Perhaps it was the passage of the leading warm front--however, there was no warming after the first pressure dip. The warm air may have been overriding the pool of cold air pouring out of the Columbia River Gorge. Interestingly, the primary pressure minima for both Portland and Astoria nearly coincide in time (note that these are hourly obs). At Portland, the temperature hovered around 48-49ºF during the main dip in pressure. Then, with the passage of the main frontal boundary, the wind quickly escalated from the south, the pressure jumped, and the temperature shot up from 49ºF to 63ºF in one hour ending at 04:55 PST. The hypothesized warm air aloft may have mixed down. Temperatures dropped off into the mid-50s in a few hours. The front arrived at Bellingham later than it did at Astoria or Portland, as evidenced by the later pressure minimum. The front had a bit of a negative tilt, and swept in a ENE direction, making for a later arrival time up north.
|
|
Pressure Gradient Maxima Table 2, below, lists the maximum gradients for some standard measures during the December 25, 2005 cold front. Gradients for this storm weren't unusually strong. An important measure for estimating the wind velocity potential for the Northern Willamette Valley, the EUG-OLM, gradient, reached +8.7 mb (+0.26") at 05:00 on the 25th. Observed wind readings in many areas significantly exceeded what would be expected from this storm's gradients alone. Clearly other mechanisms worked to enhanced the surface wind velocity, such as good upper-air support. Cape Arago (CARO) sits in for North Bend, and the Eel River Buoy (46022) is used in place of Arcata. Sources: National Weather Service, METAR reports, and the National Data Buoy Center. |
Table 2 Notes: [1] Last of two occurrences, the other being at 03:00 on the 25th. |
|
Pressure Tendencies Table 3, below, lists the maximum hourly pressure tendencies recorded at eleven key stations during the December 25, 2005 event. None of these tendencies stand out next to past windstorms, and are pretty typical of the average winter storm. Sources: National Weather Service, METAR reports, and the National Data Buoy Center. |
Table 3 Notes: [1] The -1.7 mb fall at Quillayute is the last of two hourly occurrences, the other having happened at 02:00 HRS on the 25th. [2] The -1.7 mb fall at Bellingham is the last of two hourly occurrences, the other having happened at 00:00 HRS on the 25th. |
||||||||||||||||||||||||||||||||||||||||||||||||||||||||||||||||||||||||||||||||||||||||||
|
Peak Wind and Gust Table 4, below, lists the peak wind and gust for eleven key stations in the Pacific Northwest, their direction, and their time of occurrence. "Peak Wind" is a 2-minute average, and "Peak Gust" is a 5-second average. By my own personal methodology, a wind event rates the term "windstorm" when the average peak gust of these eleven stations reaches 39.0 mph (gale force) or higher. The December 25, 2005 cyclone ranked as a minor windstorm. Minor windstorms have an average of 39.0 to 44.9, moderate windstorms have an average of 45.0 to 54.9, and major windstorms are those that reach or exceed 55.0. Only a handful of storms have made the majors, including December 12, 1995, November 14, 1981 and October 12, 1962. Of particular interest is how this windstorm compared to some of the others in recent memory. More specifically, how much time has passed since an event of equal or stronger magnitude occurred. With an average peak gust of 41.3 mph, the December 25, 2005 windstorm had less impact than the January 29, 2004 event, which had an average peak gust of 42.6 mph at the eleven key stations used in this comparative data section. And, compared to many other events, Jan 2004 wasn't particularly strong. This informs that the Christmas Day storm simply doesn't stand out among a host of windstorms through history, even compared to events in the same winter season, such as January 1, 2006 and February 4, 2006. However, the narrow band of exceptionally high wind on the coast during December 25, 2005, with many areas receiving 65 to 80 mph gusts, was significant. This is another example that, sometimes, windstorms can be quite local. In this regard, the December 25, 2005 storm is similar to the December 27, 2002 event that ranked a bit lower at 40.3. The 2002 storm focused on the Oregon coast and the Puget Lowlands, resulting in a significant gale for the Seattle area, while having quite a weak showing in other parts of the Northwest, such as around Bellingham.The 11-station average peak gust method tends to emphasize the wind events that strike the biggest region. Note that, with a conversion from 5-second to the "instant" gusts recorded before the Automated Surface Observation System, the December 25, 2005 event actually ranks as a moderate windstorm with an adjusted value of 49.1. For more explanation on how the 5-second and 1-second gust measures play into the kind of storm ranking system I describe here, see "Adjustments to Modern Storms." Also, peak wind is the highest value noted in the regular and special reports, and may not reflect the true maximum 2-minute average. For example, Portland's actual peak 2-minute wind was 36 mph on the 25th, as noted by the ASOS automatic recording capability. Before ASOS, there wasn't always a means to witness the actual maximum wind, and it was often taken from the regular and special observations. The methodology is done similarly in this table to provide information that is more comparable to the storms that occurred before ASOS (pre-mid-1990s). Sources: National Weather Service, Eureka, Portland and Seattle offices, METAR reports, and Public Information Statements. |
| Location |
Peak |
Direction |
Obs Time of |
Peak |
Direction |
Obs Time of |
| California: | ||||||
| Arcata |
23 |
170 |
-- HRS, 25th |
35 |
170 |
-- HRS, 25th |
| Oregon: | ||||||
| North Bend |
35 |
200 |
01:15 HRS, 25th |
55 |
200 |
01:35 HRS, 25th |
| Astoria [1] |
29 |
190 |
04:13 HRS, 25th |
54 |
180 |
02:55 HRS, 25th |
| Medford |
17 |
180 |
00:53 HRS, 25th |
30 |
200 |
00:35 HRS, 25th |
| Eugene |
20 |
150 |
01:54 HRS, 25th |
37 |
170 |
03:02 HRS, 25th |
| Salem |
23 |
190 |
02:56 HRS, 25th |
35 |
190 |
02:37 HRS, 25th |
| Portland |
31 |
200 |
03:55 HRS, 25th |
46 |
190 |
03:51 HRS, 25th |
| Washington: | ||||||
| Quillayute |
24 |
220 |
06:59 HRS, 25th |
36 |
180 |
03:49 HRS, 25th |
| Olympia [2] |
26 |
200 |
06:05 HRS, 25th |
41 |
210 |
06:10 HRS, 25th |
| Sea-Tac |
28 |
210 |
06:56 HRS, 25th |
38 |
190 |
07:22 HRS, 25th |
| Bellingham |
32 |
180 |
08:53 HRS, 25th |
48 |
170 |
07:30 HRS, 25th |
| AVERAGE |
26.2 |
190 |
41.3 |
190 |
||
| [1] Peak wind at Astoria is the last of three occurrences, the others having occurred at 03:25 and 02:55
[2] Peak wind at Olympia is the last of two occurrences, including out of 190 degrees at 05:54 PST. |
||||||
|
Peak Gusts in the Seattle Area on Christmas 2005: Pathetic Table 5, below, lists Seattle-area peak gusts, in mph, for recent storms. The data reveal that, for the greater Seattle area, the Christmas Day windstorm didn't have the punch of many other events in recent memory, some memorable and not-so-memorable. The December 27, 2002 cyclone struck much of the area far more strongly. And, of course, the January 16, 2000 and March 3, 1999 windstorms are a significant cut above even the December 27, 2002 event. More recent events on January 1, 2006 and February 4, 2006 also struck the Seattle area with more force than the Christmas Day storm of '05, but even these two didn't have the punch of events from earlier years. Note, for the December 25, 2005 windstorm, data are missing for Tacoma McChord, and peak gust for the Tacoma Narrows Airport is used. |
| Storm |
Tacoma McChord
|
SeaTac Airport
|
Renton
|
Boeing Field
|
West Point
|
U of W ATG
|
Everett Paine
|
Average
|
| 04FEB2006 |
47
|
47
|
44
|
47
|
66
|
48
|
52
|
50.1
|
| 01JAN2006 |
41
|
49
|
40
|
40
|
54
|
40
|
45
|
44.1
|
| 25DEC2005 |
40
|
38
|
38
|
35
|
48
|
35
|
48
|
40.3
|
| 27DEC2002 |
51
|
52
|
49
|
48
|
59
|
56
|
58
|
53.3
|
| 16JAN2000 |
60
|
52
|
53
|
54
|
69
|
55
|
60
|
57.6
|
| 03MAR1999 |
55
|
60
|
51
|
52
|
68
|
MM
|
57
|
57.2
|
|
Last Modified: February 18, 2006 You can reach Wolf via e-mail by clicking here. | Back | |