January 1, 2004
Southwest Oregon compiled by Wolf Read |
|
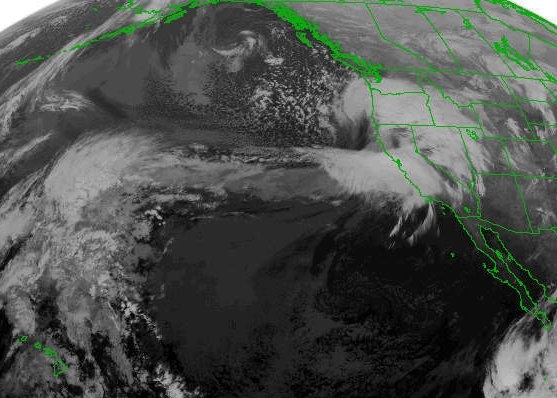
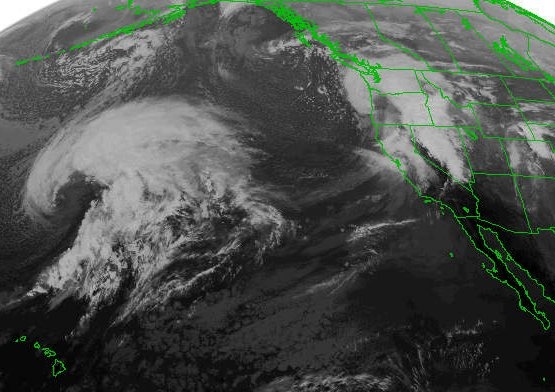
A rapidly deepening cyclone landed ashore in Curry County, OR, with a 986 mb center. For many places in the Northwest, especially in Central and East Oregon and much of Idaho, this was the big event of the winter. Comments in the National Climatic Data Center's Storm Data publication for January 2004, clearly indicate the exceptional nature of this disturbance: "An incredible storm concluded a very active holiday weather week in southeast Idaho," and, "An extraordinary winter storm struck Oregon and Northern California on January 1, 2004." Though it should be noted that, for Northern California, this storm event was not as intense as the string of storms that occurred during December 14-16, 2002. The January 1st storm brought extreme southerly winds and heavy rain to Northern California and Southwest Oregon, a blizzard to Oregon's south central section and eastward, and thundersnow to Southeast Idaho accompanied by zero visibilities from blowing powder during a lashing gale. Heavy snow blanketed the Blue Mountains and Columbia Basin, and funneled westward to The Dalles where at least 8" accumulated. Cold air pulled straight through the Columbia River Gorge and other Cascades gaps pooled in the Willamette Valley north of the cyclone's path, and a brief period of heavy snow dropped 2 to 6 inches over much of the region, whisked along on a brisk northerly breeze. Many people in Northwest Oregon will recall the devastating ice storm that occurred from January 5th to 7th. The January 1st cyclone helped set the stage for the big ice event. The heavy blanket of fresh snow laid across much of the Pacific Northwest helped to create a strong pool of cold air that would be the genesis of the great ice storm. For the 2003-04 storm season, the January 1st storm caused the lowest pressure readings and strongest barometric tendencies across much of Northern California and Oregon. As if an echo from February 7, 2002, this cyclone developed explosively as it raced inland, and then maintained integrity even as it was raked by the rugged terrain of the west. Satellite images bore an uncanny resemblance to those taken nearly two years earlier. The January 1st low still had considerable strength as it moved into Montana and Wyoming. For those interested in more details of the snow and ice from this time period, see George Taylor's report "Snow/Ice Event, December 29, 2003- early January, 2004". This summary includes some nice photographs. Figures 1 and 2, below, are infrared satellite photos of the January 1, 2004 cyclone, top, and the February 7, 2002 storm, bottom, both taken at about the time that the prospective cyclones were making landfall in Southwest Oregon. The resemblance is striking, though there are differences. Like people, each storm is unique, and these two events each brought their own brand of hazardous weather to the Pacific Northwest. |
|
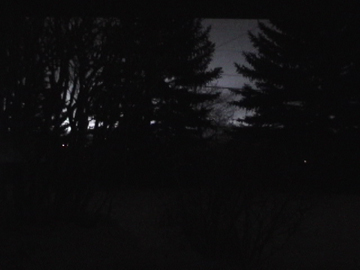
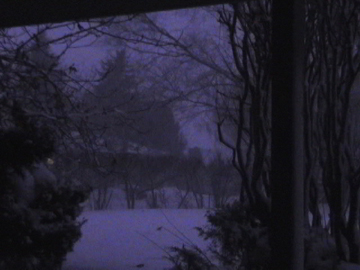
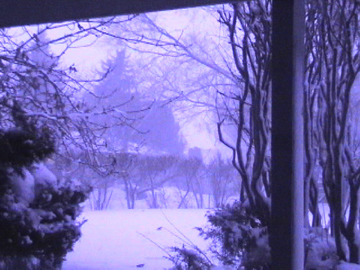
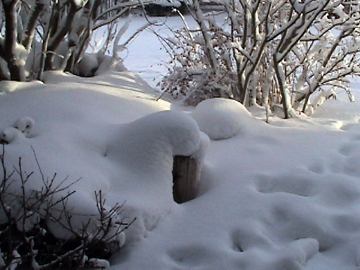
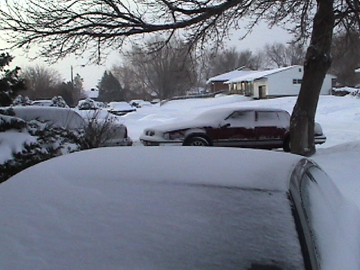
| The January 1, 2004 storm caught me visiting family in Pocatello, ID, a location that put me in ground zero of a spectacular display of Nature's raw power. Here's what I noted about this storm in my journal: |
|
|
|
|
|
|
|
|
|
|
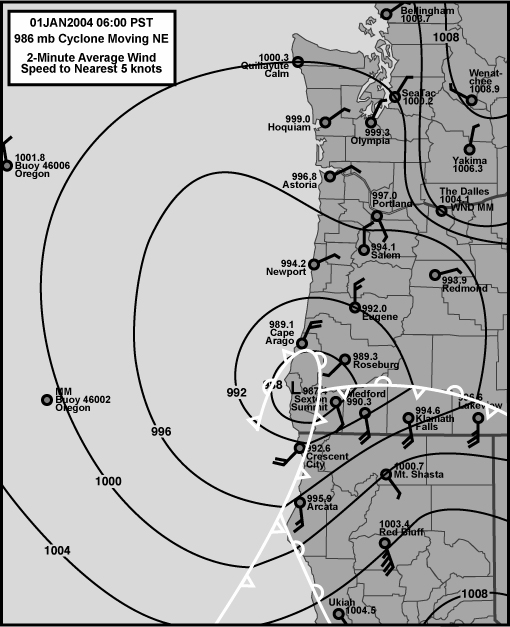
January 01, 2004: Meteorological Details The surface map for 06:00 HRS PST is shown in Figure 10, below, landfall of a potent storm. Note the closely-packed isobars along the low's southeast side. Has this system tracked 200 miles north, a fairly potent windstorm may have been the result in the Willamette Valley, with gusts approaching 60 mph based on the storm's results in Northern California. Also of interest are the tightly packed isobars on the low's northeast side, with a focus in the vicinity of the Columbia River Gorge. The area of higher pressure in Eastern Washington is the result of cold air pooled at the surface. Some of this chilled air was pulled eastward through the Gorge, then southward down the Willamette Valley. The result: snow, with a half foot falling in many areas. |
|
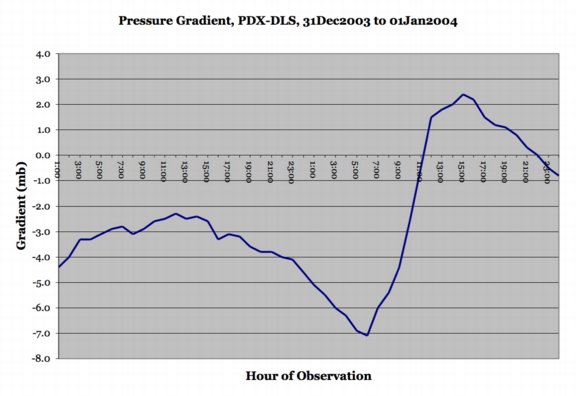
| Figure 11, below, shows the trend in the PDX-DLS pressure gradient as the January 1, 2004 cyclone progressed northeastward across Oregon, one view of a west-east orientation across part of the state. A fairly strong negative gradient developed as the low moved ashore. This favored east winds through the Gorge, which resulted in cold air in the Columbia Basin pouring into the Willamette Valley. The gradient quickly switched to positive when the cyclone crossed the Cascades, a situation that favors west winds. The cold air didn't stick around long in the Willamette Valley, and snow changed to rain at many locations before the precipitation broke. The positive gradient only lasted for a short while; values are typically weakly negative during the winter. |
 |
| Figure 12, below, shows the trend in the OTH-AST pressure gradient as the January 1, 2004 cyclone progressed northeastward across Oregon, one view of a south-north orientation across the state. As the low passes to the south of the two coastal stations, the gradient rapidly goes negative. Once the low moves inland and sweeps to the northeast, eventually lifting north of both stations, the gradient quickly switches back to positive. Rapid gradient switches such as those depicted below characterize an intense storm. |
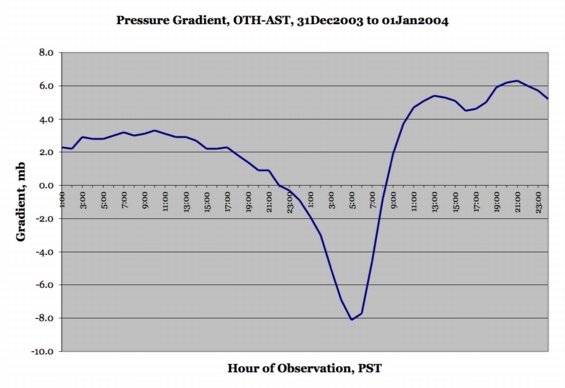 |
Figure 13, below, shows the ACV-OTH gradient next to the OTH-AST. With the low passing north of Arcata, the ACV-OTH gradient goes strongly positive at the same time that the OTH-AST goes negative. This is the mark of a fairly intense cyclone landing in Southwest Oregon. |
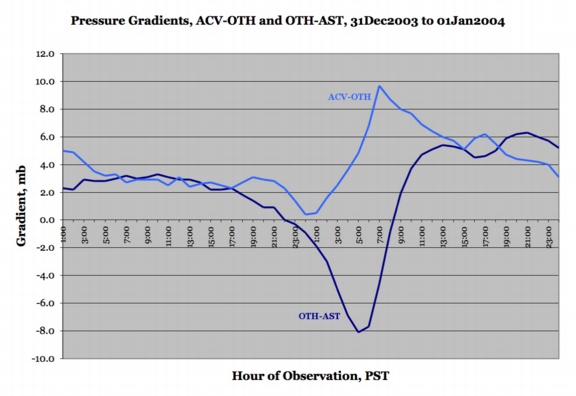 |
Figure 14, below, puts the 2004 storm in perspective. The ACV-OTH and OTH-AST gradients for the January 1, 2004 cyclone (blue tones) are compared to a major event on November 10, 1975 (orange and brown). Note how the change of scale (required to fit the 1975 storm on the graph) has compressed the curves for the 2004 for storm. The times on the x-axis are for the 1975 event; to line up the maximum gradient periods, the 2004 lines start at 19:00 PST 31DEC2003. The 1975 storm is the most extreme Southwest Oregon cyclone for the period 1948 - 2003, and the intensity of its gradients far exceed the 2004 event. Though the 2004 cyclone was strong, the 1975 storm serves to remind us that events with significantly higher intensity are possible. |
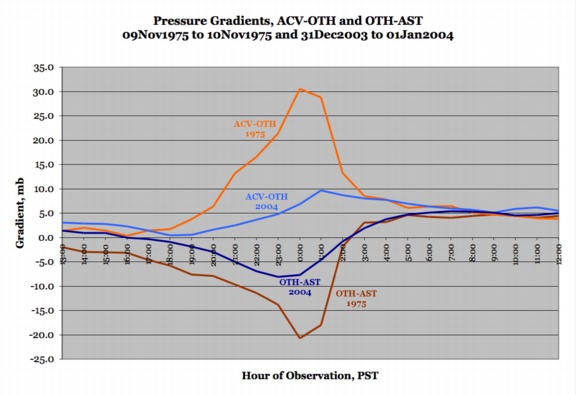 |
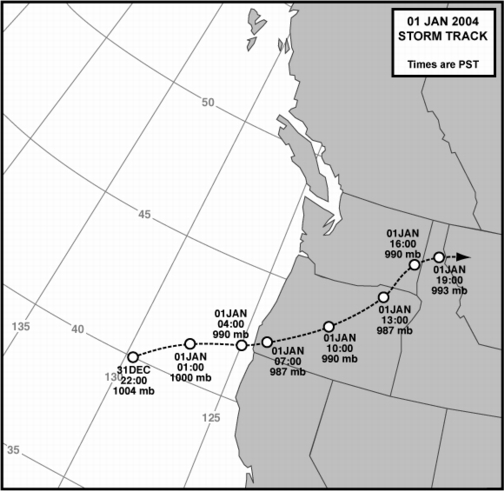
Figure 15, below, plots the cyclone's path, based on NCEP surface maps and satellite photo interpretation. The wobbly pattern is typical of midlatitude storms. Of interest is the storm's slowdown right as it made landfall in Southwest Oregon. This probably spared Northern California a stronger gale. The cyclone, being carried on a strong jet, resumed its fast pace as it crossed the Cascades and dropped into Central Oregon. Another slowdown occurred as the low encountered the Rockies and began to weaken. |
|
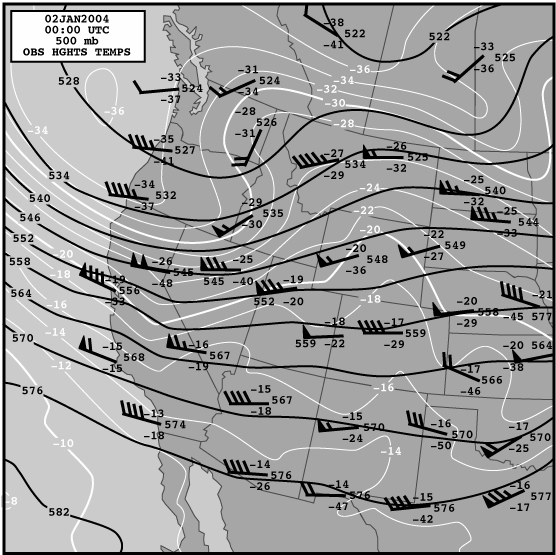
Figure 16, below, shows the upper-air conditions at 500 mb for the time 16:00 PST January 1, 2004. The surface cyclone developed along a baroclinic band, part of which is evident over northern California going westward offshore--the region where the isotherms (white lines) are nearly parallel the height lines (black), indicating a quasi-baroclinic (almost barotropic) situation at the time of this aupper-air map. The surface cyclone is in southeast Washington at the time of this frame, right in a region where tightly-packed isotherms cut across the height lines--a strong baroclinic zone where a large pool of cold air is advecting eastward, one of the ingredients for strong cyclogenesis, and one of the reasons for the low's persistence as it entered the mountainous west. |
|
General Storm Data Table 1, below, lists the barometric minimums for the January 1, 2004 storm at selected sites. Though these values are quite low, especially in Oregon, a number of Pacific Northwest windstorms have produced significantly lower readings. The most depressed pressures during this storm were in southwest Oregon, and included 29.20" at Roseburg at 06:53, and 29.16" at Buoy 46027 at 05:00 PST and at Sexton Summit at 05:56. Sources: National Weather Service, Eureka, Portland and Seattle offices, METAR reports, and the National Data Buoy Center, historical data. |
Table 1 Notes: [1] Data from the Cape Arago C-MAN station. [2] Last of two occurrences in a row. [3] Last of two occurrences in a row. |
 |
Table 2, below, lists the maximum gradients for some standard measures during the January 1, 2004 cyclone. Negative readings dominate, owing to the storm's southern track. Unlike other storms on similar paths, such as November 10, 1975 and February 7, 2002, the January 1, 2004 event didn't develop gradients of an extreme nature. The key measures for this comparison are the ACV-OTH and OTH-AST gradients. The gradient values for the 1975 storm are 2.5 to 3 times stronger! And 07FEB had twice the ACV-OTH gradient; interestingly, the 2004 storm had a slightly stronger negative gradient for OTH-AST than 07FEB, by about a millibar. Though still below the -6.9 mb (-0.20") reading produced by the 1975 storm, the gradient of -5.6 mb (-0.17") across the Willamette Valley on January 1, 2004 is fairly decent for a negative reading. Local instant gusts of north 30 mph probably occurred in some areas of the valley. Sources: National Weather Service, Eureka, Portland and Seattle offices, METAR reports, the National Data Buoy Center historical data, and the National Climatic Data Center, unedited surface observation forms (for historical storm pressure data). |
Table 2 Notes: [1] Max positive gradient +6.3 mb at 21:00 HRS. [2] Last of two hourly occurrences, the other having happened the hour before. Also, max positive gradient +6.5 mb at 21:00 HRS. [3] Max negative gradient -3.3 mb at 04 and 05:00 HRS. [4] Max positive gradient +6.9 mb at 13:00 HRS. [5] Max negative gradient -2.0 mb at 04:00 HRS. |
Pressure Tendencies Owing to its southern track, the January 1, 2004 event, favored Southwest Oregon and Northwest California with the strongest pressure changes. The values mark a strong pressure couplet in the southern section, with only modest tendencies in the northland. The low's slowdown as it moved ashore likely reduced the potential magnitude of the pressure swings. Even so, the -4.0 mb (-0.12") hourly drop at Medford is a fairly intense value for that station; the Columbus Day storm and the November 10, 1975 cyclone didn't even produce a downward tendency of this magnitude. Source: National Weather Service, Eureka, Portland and Seattle offices, METAR reports, and the National Climatic Data Center, unedited surface observation forms (for historical storm pressure data). |
Table 4 Notes: [1] Data are from the Cape Arago C-MAN station. Also, the +3.0 mb rise is the last of two hourly occurrences in a row. [2] The -2.6 mb hourly fall is the last of two hourly occurrences in a row. [3] The -1.4 mb hourly fall is the last of two hourly occurrences in a row. The +1.1 mb hourly rise is the last of three occurrences, the others having happened at 16 and 20:00 HRS. [4] The -1.8 mb hourly fall is the last of two hourly occurrences in a row. The +1.4 mb rise is the last of three hourly occurrences, the other two having happened at 14 and 15:00 HRS. |
||||||||||||||||||||||||||||||||||||||||||||||||||||||||||||||||||||||||||||||||||||||||||
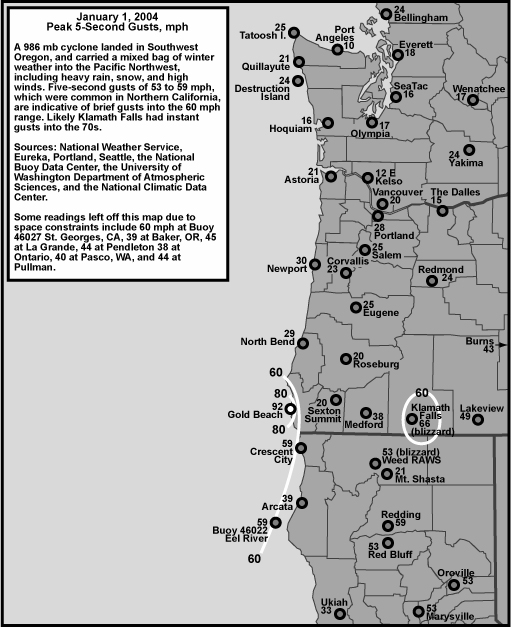
Table 5, below, lists the peak wind and gust for eleven key stations in the Pacific Northwest, their direction, and their time of occurrence. "Peak Wind" is a 2-minute average, and "Peak Gust" is a 5-second average. By my own personal methodology, a wind event rates the term "windstorm" when the average peak gust of these eleven stations reaches 39.0 mph (gale force) or higher. Due to its very southern track, the January 1, 2004 cyclone didn't make the cut. This, however, does not mean that the storm wasn't strong; simply not many stations in this limited list were under the south-of-the-low gun. Moderate windstorms have an average of 45.0 to 54.9, and major windstorms are those that reach or exceed 55.0. Only a handful of storms have made the majors, including December 12, 1995, November 14, 1981 and October 12, 1962. Note that the newer 5-second gust adopted by the NWS alters the meaning of the kind of storm ranking system I describe here. See "Adjustments to Modern Storms." The tendency for north and northeast winds in much of the Northwest is a classic snow pattern (the average values for wind directions listed below are generally meaningless for this storm because the NE and NW values tend to cancel, putting much of the weight to the southerly values). Note that the southerly peak winds at Eugene and Portland were late in the day, when the pressure gradient had reversed from negative to positive behind the cyclone--winds were northerly at these stations earlier in the day, when snow occurred. Snow fell in many locations, including Seattle, Olympia, Portland, Salem, Eugene and even Medford. Sources: National Climatic Data Center, Unedited Local Climatological Data. Some of the times listed in the table below are approximate. |
| Location | Peak |
Direction |
Obs Time of |
Peak |
Direction |
Obs Time of |
| California: | ||||||
| Arcata | 32 |
240 |
06:09 HRS, 1st |
39 |
240 |
06:09 HRS, 1st |
| Oregon: | ||||||
| North Bend | 22 |
260 |
11:50 HRS, 1st |
29 |
290 |
12:52 HRS, 1st |
| Astoria | 18 |
060 |
06:55 HRS, 1st |
21 |
070 |
06:55 HRS, 1st |
| Medford | 31 |
140 |
06:53 HRS, 1st |
38 |
130 |
06:53 HRS, 1st |
| Eugene | 21 |
180 |
19:54 HRS, 1st |
23 |
180 |
19:54 HRS, 1st |
| Salem | 22 |
360 |
08:07 HRS, 1st |
25 |
300 |
10:56 HRS, 1st |
| Portland | 21 |
200 |
23:55 HRS, 1st |
28 |
210 |
23:55 HRS, 1st |
| Washington: | ||||||
| Quillayute | 15 |
360 |
11:53 HRS, 1st |
21 |
350 |
11:53 HRS, 1st |
| Olympia | 15 |
350 |
09:54 HRS, 1st |
17 |
360 |
09:54 HRS, 1st |
| Sea-Tac | 14 |
020 |
07:56 HRS, 1st |
16 |
050 |
07:56 HRS, 1st |
| Bellingham | 21 |
030 |
13:53 HRS, 1st |
28 |
040 |
13:53 HRS, 1st |
| AVERAGE | 21.1 |
200 |
25.9 |
202 |
Last Modified: October 20, 2015 You can reach Wolf via e-mail by clicking here. | Back | |