The Strong Windstorm of January 16-17, 1986 |
|
| ||||||||||||||||||||||||||||||||||||||||||||||||||||||||||||||||||||||||||||||
| ||||||||||
| The January 16-17, 1986 windstorm produced the strongest wind gust--52 mph--that I ever recorded at my monitoring station. I had at least one anemometer operating from Fall of 1982 until I moved a few miles further east in July of 1986, and, though a number of storms threw the needle into the 40-50 mph range, none produced gusts higher than 50 until 1986. The strongest gust before this storm had been a brief peak of 50 mph during one of the events in the December 1982 storm train (which will be detailed one day). January 16-17, 1986 was not the strongest windstorm I had witnessed from this location: by sheer number of trees down, the November 1981 windstorms had been the most damaging and, judging by SeaTac's peak gust of 67 mph, probably produced higher gusts than 52 mph at my location, but, alas, I had no wind monitoring system at the time. In any event, the three preceeding storms in January 1986 had honed my preparedness for recording these events, and, so, the January 16-17, 1986 windstorm became the most extensively monitored to date. Here's some of the data: |
|
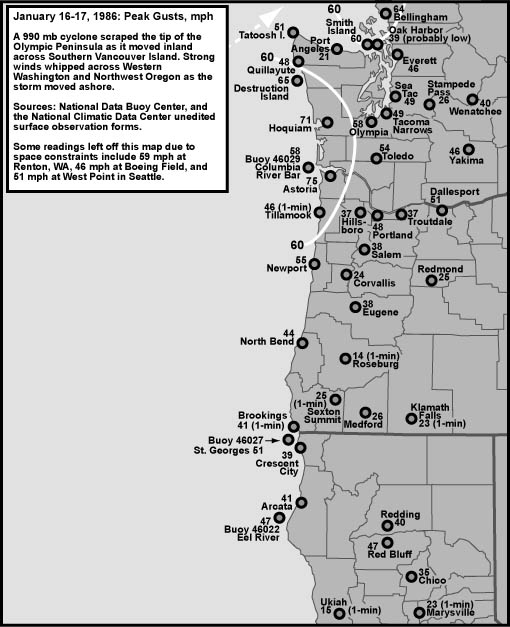
In continuing with the quick examination of pressure gradients in this series of storms, note that at 16:00 HRS, when the winds began to pick up across Western Washington and Oregon, the pressure at Forks was 995 mb, while far to the south, at North Bend, it was 1011 mb, making for a S to N difference of 16 mb. By 19:00 HRS, when the first large gusts were being felt at my location, and many others in the Puget Lowlands, the pressures were 992 mb at Forks, and 1015 mb at North Bend, making for a gradient of 23 mb, second only to the 24 mb seen in the January 5-6 storm, and this would climb to a peak of 25.3 mb in the next hour. The 992 mb reading at Forks converts to about 29.29", and this fell to 29.26" in the next hour, the lowest surface pressure reading from any of the January 1986 storms at the five pressure reporting sites. By 04:00 HRS the next day, with the low filling and pressures rising across the region, the gradient had lessened to 10 mb, and winds were relatively light. General Storm Data Table 1, below, is a list of pressure minimums for eleven Pacific Northwest stations. The late, and deeper, minimums for Quillayute and Bellingham mark a quick night-time deepening of the cyclone as it approached land. Many other stations show a secondary drop in pressure as this strengthening takes place, but, at most places, it wasn't enough to produce minmums greater than those generated by the storm's leading front. Source: all pressure data are from the National Climatic Data Center, unedited surface observation forms. |
|
| The minimum pressure at the Tatoosh Island C-MAN station was 29.25" at 20:00 on the 16th. At Tatoosh, winds peaked at 51 mph out of 150º at 16:00 as the storm approached. There was a sudden shift to 220-240º in the hours of 21:00 to 22:00 with much weaker gusts of 30 mph, and the barometer started rising fairly quickly, the mark of the low passing to the east of the station. It seems that deepening low center tracked fairly close to Tatoosh, which strengthened the gradients over Washington on the evening of the 16th. The storm's maximum gradients are shown in Table 2, below, for ten key measures. |
|
Table 2 Notes: [1] The AST-DLS gradient appears to have gone positive between 23:00 on the 16th and 06:00 on the 17th, but this is uncertain due to station closure every night. PDX-DLS reached at least +2.1 mb at 06:00. The positive gradient would account for the strong west wind (gusts to 51 mph) that hit The Dalles. |
Table 3, below, shows the maximum hourly pressure tendencies for the January 16-17, 1986 windstorm. These mark some of the weakest tendencies among the windstorm examined in this web volume. Which, in a way, makes them interesting. Apparently, not every windstorm needs to generate fast pressure swings to create a gale. This cyclone appears to have been plodding along, which accounts for the big difference in time between maximum fall and maximum rise. The gradients gradually built up as the storm moved inland, with a resultant gale. The later peak delension at Quillayute (and Tatoosh for that matter) appear to be due, in part, to the cyclone deepening as it approached landfall. This brief strengthening apparently pushed the gradients "over the edge" in Washington, accounting, in part, for the late peak gusts in the region. Quillayute's peak 1-hour climb of +4.4 mb (+0.13") was matched at Tatoosh Island. |
| ||||||||||||||||||||||||||||||||||||||||||||||||||||||||||||||||||||||||||||||||||||||||||
Table 3 Notes: [1] The maximum hourly fall of -1.7 mb at North Bend is the last of two occurrences, the other having happened the hour before. The maximum hourly climb of +1.7 mb is the last of three occurrences. |
Table 4, below, shows the peak wind and gust,direction, and time of occurrence, at eleven key stations for the January 16-17, 1986 windstorm. "Peak Wind" is a 1-minute average, and "Peak Gust" is an instant (approximately 1-second) average. By my own personal methodology, a wind event rates the term "windstorm" when the average peak gust of these eleven stations reaches 39.0 mph (gale force) or higher. The January 16-17, 1986 event ranked as a moderate windstorm. Moderate windstorms have an average of 45.0 to 54.9, and major windstorms are those that reach or exceed 55.0. Only a handful of storms have made the majors, including December 12, 1995, November 14, 1981 and October 12, 1962. This ranking favors those cyclones that follow a northward path close to the U.S. Pacific Coast, and for good reason--such storms affect the largest land area, and therefore are potentially the most destructive. A front associated with the storm struck Portland in the evening with lightning, and the station's peak wind gust of 48 mph. This front apparently wasn't as strong south of the Rose City, and wind gusts did not exceed levels achieved earlier in the day as the cyclone slowly edged toward the Northwest. As the front moved northeast, lightning was also reported through much of Western Washington, with brief strong, gusty winds. Peak wind speeds, however, were generally achieved post-front in the Evergreen State. |
| Location | Peak |
Direction |
Obs Time of |
Peak |
Direction |
Obs Time of |
| California: | ||||||
| Arcata | 18 |
190º |
14:52 HRS, 16th |
41 |
170º |
11:57 HRS, 16th |
| Oregon: | ||||||
| North Bend | 28 |
180º |
05:51 HRS, 16th |
44 |
220º |
11:51 HRS, 16th |
| Astoria | 36 |
210º |
19:50 HRS, 16th |
75 |
210º |
19:45 HRS, 16th |
| Medford | 17 |
180º |
08:52 HRS, 16th |
26 |
180º |
10:58 HRS, 16th |
| Eugene [1] | 22 |
240º |
20:50 HRS, 16th |
38 |
180º |
13:17 HRS, 16th |
| Salem | 21 |
170º |
11:50 HRS, 16th |
38 |
230º |
13:13 HRS, 16th |
| Portland | 28 |
200º |
18:58 HRS, 16th |
48 |
200º |
18:52 HRS, 16th |
| Washington: | ||||||
| Quillayute | 25 |
170º |
20:07 HRS, 16th |
48 |
170º |
18:44 HRS, 16th |
| Olympia | 32 |
200º |
20:51 HRS, 16th |
58 |
200º |
20:42 HRS, 16th |
| Seattle [2] | 29 |
200º |
23:52 HRS, 16th |
49 |
190º |
21:37 HRS, 16th |
| Bellingham [3] | 35 |
180º |
23:52 HRS, 16th |
64 |
180º |
23:18 HRS, 16th |
| AVERAGE | 26.5 |
193º |
48.1 |
194º |
Table 4 Notes: [1] Peak wind of 22 mph at Eugene is the last of two occurrences, the other having happened at 12:50 out of 180º. [2] Peak wind of 29 mph at Sea-Tac is the last of three occurrences. [3] Peak wind of 35 mph at Bellingham is the last of two occurrences, the other having happened at 19:52 out of 180º. |
Examination of the January 16-17, 1986 Tree Damage In some of the study's woodlots, tree damage was quite extensive. Before entering into any significant discussion, here's the catalog (woodlots not listed escaped heavy damage from this storm): Southern Woodlot Specimen #: 16JAN1986001 Field Description: Before the storm, this tree was a live, strong, and healthy birch. It snapped clean, leaving a few strips of bark dangling on the trunk. The top's base landed 9' from it's parent trunk and fell over on an old bigleaf maple (Acer macrophyllum) windfall (which came down in the Thanksgiving day 1983 windstorm), leaving the birch top semi-propped up. The top was 32' long. Conclusion: No clear biological reason for this tree to have been singled out by the wind. --- Southern Woodlot Notes: Many red alder (Alnus rubra) and bigleaf maple (Acer macrophyllum) twigs, and a few small branches, were torn off in this windstorm. An alder that had been sawed through to about 1/4 it's diameter fell in this storm. The alder was starting to rot, but it was still alive. The alder split along the saw-line. Of the few Douglas-firs (Pseudotsuga menzesii) and western hemlocks (Tsuga heterophylla) in this woodlot, they only lost a few small twigs and branches. --- --- --- Trillium Forest Specimen #: 16JAN1986002 Field Description: All that is left of this tree is a bare, straight trunk with two, small, protruding, dead branches. Everything came off and was flung to the ground with violence. About 40' of the top hit the ground with such force that it pounded a hole 1' deep in the ground and then bounced out of it, falling down onto a group of sapling bigleaf maples. Upon hitting the ground, it shattered (a main portion snapped 16' from the base) and its pieces and branches were spread across the main trail. This top landed about 12' away from the tree. The branch, however, landed only two feet away and got stuck in the ground like a spear. But, being under the top, it was shoved over and parts of it also landed in the main trail. The branch was 36' long. The tree itself was a very healthy specimen, showing no signs of rotting or disease. Conclusion: No clear biological reason for this tree to have been singled out by the wind in a forest of many. Maybe a localized region of high wind speeds (see next two specimens). --- Specimen #: 16JAN1986003 Field Description: Even though this tree lost most of its top, it still retained two of its large branches, but they do not even equal half the size of the top itself. About 25-30' of the top struck ground three feet from the trunk and landed on some sapling bigleaf maples, branches exploding, splintering, shattering. This tree was another example of a nicely healthy bigleaf maple. Conclusion: No clear biological reason for this tree to have been singled out by the wind in a forest of many. Maybe a localized region of high wind speeds (see specimens above and below). ---
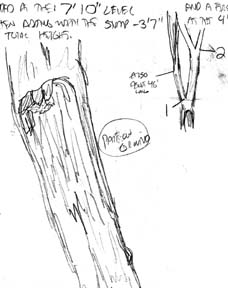
Field Description: This forked tree had its bark stripped away from the base to 8' on one side. This promoted disease and it had started rotting. The tree probably would have been dead in 3 to 4 years. The tree had two forks: one was right by the base where the tree split, and one was 16' up from the first fork. This fork was still partially alive before the winds broke the tree. Length of broken part of tree: 46'. Conclusion: Tree probably broke due to past bark damage and subsequent wood decay. Break may also be associated with localized strong winds (see the two specimens above). Field Sketch: Shown to the right, depicts the main forks of the tree, as well as the base of the broken top. ---
Field Description: This branch was the last one that the tree had, for the tree lost its top to a long-ago windstorm. The branch landed 10' from the tree, then bounced 3' to the side of the impact point. Some of the branch's trip shattered as it ploughed through a nearby bigleaf maple that otherwise came through the storm undamaged. The tree to lose the branch was relatively healthy, but obviously suffered heartwood exposure due to the decapatation from the long past windstorm. The branch was 49' long--a tree in its own right. Conclusion: Branch probably broke due to past loss of parent tree's top and subsequent exposure of heartwood to the elements. Branch, growing to compensate for the tree's missing top, may also have gotten too large for the base to support it. Field Sketch: Shown to the right, slightly above, depicts the branch's break, indicating its width. --- Specimen #: 16JAN1986006 Field Description: About 58' of this tree was flung down a hillside, crashed through an old western red cedar (Thuja plicata) stump (flattening it), and shattered 30' below the base of the parent trunk. All in all, it was blown about 12' away from the parent trunk. Though the tree was a living specimen, there was some heartwood rot in the region of the break. Conclusion: Tree probably failed due to heartwood rot in the region of the breaking point. --- Specimen #: 16JAN1986007 Field Description: The largest of two forks, roughly 30' long, snapped down and was suspended in some bigleaf maple (Acer macrophyllum) saplings. The birch tree is dead, and even has some fungi growing in it, though the wood still seems strong. Conclusion: Tree probably failed because it had died and begun to rot before the storm. ---
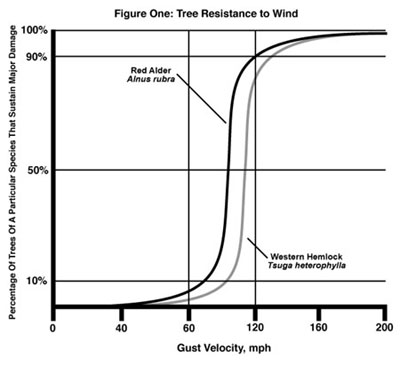
Field Description: This was a very healthy tree, its live wood and heartwood showing no signs of infection or rotting. The drawing (coming soon) shows, to a degree, how the middle section came into being, but it most likely snapped off when the tree twisted as it fell. The circumference measurement for the middle section is based on measuring just half of the way around, for that's all there was. The level of breakage was measured from the base of the very tall split in the remaining trunk. The middle section accounts for nearly 10', so the top above that broke more at the 30' level. The top hit soil 8-10' from the tree. Conclusion: No clear biological reason for this tree to have been singled out by the wind in a forest of many. Field Sketch: To the right, slightly above, shows the base of the broken top, and the 7-8' long split on the trunk. --- Specimen #: 16JAN1986009 Field Description: This branch, which was about 30' long, broke from a healthy tree that was at least 55' tall. The branch landed one foot away from the tree's base, then fell over. Conclusion: No clear biological reason for this branch to have been singled out by the wind. --- Trillium Forest Notes: Many bigleaf maple (Acer macrophyllum), red alder (Alnus rubra), western hemlock (Tsuga heterophylla), and Douglas-fir (Pseudotsuga menzesii) twigs were torn off of trees throughout the Trillium Forest by the current windstorm. There is no furthur significant tree damage in this woodlot. For the Trillium Forest, the January 16-17, 1986 windstorm was the most damaging since November 14-15, 1981, though the 1981 storm was significantly more damaging, especially to large conifer trees. --- --- --- Mine Forest Specimen #: 16JAN1986010 Field Description: This healthy tree had a quad system of trunks, each about equal in height and full of branches, so the stems retained upright the top that fell. The parent trunk was split right down the middle as one of its top's main branches ploughed right through it like a metal wedge through a log. The top landed within 1' of the tree's base. Conclusion: No clear biological reason for this top to have been singled out by the wind, especially in light of the fact that three equal-sized tops didn't sustain any damage. --- Specimen #: 16JAN1986011 Field Description: This dead birch popped so cleanly, with a break so flat, that I at first thought it had been cut down. But close inspection showed a rough surface along the break, unlike what a saw would make. This tree was about 30' tall, and about 10' of the top snapped off upon impact with the ground. Conclusion: This tree probably succumbed to the wind because it had died years before the storm. --- Specimen #: 16JAN1986012 Field Description: The primary red alder snapped in the gale and 37' of its top landed on a red alder sapling (20' fell), and young black cottonwood (46' fell). All three trees fell into a small perinnial creek, each one snapping, not uprooting. The primary red alder spit into three sections when it broke: top, split1, and split2, the latter two being large 1/2 diameter-thick wedges sheared from the trunk. Both splits landed behind the top, with split1 stiking ground 5' from the tree's base, and split2 landing next to the top, about 12-15' away from the parent trunk. These large wedges, which were 9.5' long in the case of split1 and 7.5' long in the case of split2, happened right where this otherwise healthy alder tree had a slight bend in its trunk (see illustration--coming soon), probably a response to a slumping of the hillside long ago. The sapling red alder that the primary's top landed on snapped clean, and the black cottonwood's base still reamained attached to the stump. The sapling red alder had been uprooted in a long ago windstorm and blown flat. The apical meristem then turned upward to grow to its present height of 20' above ground level when its much larger neighbor broken and snapped the struggling alder clean. Every tree involved in this pileup was very much alive and healthy. Conclusion: This primary red alder may have broken in the gale due to the slight S-shaped curvature of its trunk, which is where the tree split. The S-shaped curve was apparently strong enough to endure previous, lesser storms. --- Specimen #: 16JAN1986013 Field Description: This tree was about 45' tall. All this red alder's main roots snapped, so there was hardly any root-ball lifted above ground. The tree was suspended in a group of black cottonwood (Populus tricocarpa) saplings that line the same creek mentioned in specimen 16JAN1986012, causing some light branch damage to the poplars. The ground around the area had been saturated by the rainfall associated with all the January storms, and it wouldn't be surprising if more trees wouldn't uproot in possible future storms. This red alder had been alive and healthy before the storm. Conclusion: Since the primary roots snapped, ground saturation may not be the cause. It is concievable that when specimen 16JAN1986012 fell, it opened up this tree to a more direct assault, but the locations are wrong for a south wind window--this area might have recieved locally higher winds, as it also includes the specimen below. --- Specimen #: 16JAN1986014 Field Description: This tree was about 24' tall. This young, live, healthy red alder uprooted with nearly its entire root mass, and then was caught in some nearby older red alders, doing no damage to them. The ground in vicinity is saturated, as mentioned in specimen above. Upon examining the root ball, it didn't seem that large for a tree of the height that it was. There were no large cracked roots--they were all contained in the clod of soil lifted by the tree's fall. This tree probably could be re-planted. Conclusion: Though root mass may have been small, indicating losing competition with neighbors, no attempt was made to do a comparative root-extent study of the surrounding trees, so the reason why this tree uprooted while most in the area did not is unclear. --- Mine Forest Notes: This woodlot also sustained lots of live and dead branch damage. Such sheddings were lying everywhere. A large, dead, bigleaf maple (Acer macrophyllum) fell in the middle part of the forest, but it was too rotted to be noteworty, and thus was not measured, which was a painstaking process in the 35-45º F temperatures behind the storm. One area of the forest had a minor mudslide during the upcoming rains of January 19th. --- --- --- Discussion of January 16-17, 1986 Windstorm Tree Damage The January 16-17, 1986 windstorm lasted 1.5 times longer than the next biggest event on January 5-6, 1986, and produced ten wind gusts higher that the 5-6th's peak of 47 and many more within a few mph below this mark. The peak gust of 52 mph potentially could have produced 1.22 times the force of the earlier storm's peak of 47. Even so, the January 16-17th storm, from here on out called Storm 4 (with the 5-6th being Storm 2), only produced one more case of significant tree damage than Storm 2. Before exploring some new ideas, I'll come back to some familiar concepts and questions. First, six of the fourteen specimens (43%) had fairly clear reasons for breakage--strange shapes, disease, earlier death. That leaves eight seemingly healthy trees that were severely damaged in this storm (note that this is one more than in Storm 2). Assuming there were no hidden maladies, then it seems that there's a spectrum of resistance within different species of trees. In other words, no two trees are exactly alike. Clearly not a surprise. I'll come back to this below, as it appears to be a critical idea when considering wind resistance in trees. If Storm 4 had been the first, or only, storm in the series, would it have taken out all the trees lost in the first 3 events? Again and impossible question to answer, but it seems likely that it would have broken most of them--maybe the few uprootings wouldn't have happened due to the ground being less saturated. This would have given Storm 4 a damage total of, say 27-31 trees in all the study sites--a number in the range of the best-guess estimate of 30-50 trees blown down in the November 1981 windstorms. Though it is again noteworthy that Storm 4 did not cause any major damage to the large conifers in the region, whereas the two 1981 storms, and especially the first one on November 14th, uprooted and snapped many large western hemlocks (Tsuga heterophylla) and Douglas-firs (Pseudotsuga menzesii) in the Trillium Forest and Eric's Forest. This offers one possible way of categorizing large wind events: it seems to take a certain level of wind to blow down large conifers fairly regularly over a wide area, and that level, judging by the limited experience represented by the 1981 to 1987 time period that I was watching the study site woodlots closely, is when peak gusts exceed 60 mph at many NWS stations. Thus, if conifers start raining down wholesale, then it's probably the mark of one of the rarer, truly big, storms, which seem to have a 10 to 20 year separation. Note also that, when winds increase above 60 mph, there's a point where literally all trees will be blown flat in a process called swathing. This typically requires sustained winds of around 90 mph, which often produce gusts of 120. Winds this strong in the Pacific Northwest are often localized and only rarely affect a broad region, such as the entire western half of a state--this might define a 150-300 year storm. Conifers can and do fall in gales below 60 mph, but often only in isolated events, and probably in cases where there's been some clear weakening of the tree due to damage and disease, or, as in the case of the December 1990 north gale, a strong wind coming from an unusual direction. Wind direction is important. One of the interesting, and unexpected, results of this study is that fact that different woodlots seemed to be hit harder by different storms. The Forest suffered the most damage in Storm 1. In Storm 2, the Northern and Southern Woodlots suffered the most damage. In Storm 4, it was the Trillium Forest and Mine Forest. These are important facts. What are the reasons for the difference? What caused an unequal distribution of broken trees in the separate and nearly-equal-sized woolots for each storm? Indeed, how did the largest woodlot, the Trillium Forest, escape much damage in Storm 2 when two smaller woodlots suffered significant breakage. One possiblity is slight differences in wind direction during each of the different storms. Wind striking at one angle, say 180º or due S, likely strikes a specific set of trees more strongly than, say, a similar velocity of wind that blows some 15º more to the SW. My methodologies were too rough to make any definitive conclusions about this idea. And there are also other possible explanations. Winds in Pacific Northwest storms can be fickle. It's possible that those woodlots that suffered the greatest damage in each storm were hit by locally stronger gusts than other areas. Indeed, with most of the Storm 4 tree damage clustered in fairly tight areas of the Trillium and Mine Forest woodlots, this might be the better explanation. In storm 4, there were a significant number of bigleaf maples (Acer macrophyllum) heavily damaged by the winds, something new. Before, damage was being mostly done to red alder (Alnus sinuata) and paper birch (Betula papyrifera). I am left considering a situation where the first three storms cleaned out most of the weak specimens of red alder and paper birch with wind gusts that weren't quite strong enough to begin affecting the weaker members of the bigleaf maple clan. When Storm 4 hit, the winds were finally strong enough to start taking out the weaker bigleaf maples, while also reaching a level to break the stronger, but still relatively weaker (than the average) red alders and paper birches. This is only a guess based on limited data. But I'm left imagining a situation where, among a population of trees, a species' resistance to wind, when plotted, is distributed along an S-curve that asymtotically approaches 100% as the wind climbs ever higher, with a rapid escalation in the amount of tree damage between, say 60 and 120 mph. In Franklin, Dorothy, "West Coast Disaster," several articles that mentioned windfall assessments after the Columbus Day Storm of 1962 for the Willamette Valley and Southwest Washington Interior indicated about 50% of trees lost or damaged (see especially p. 104, 105, 107, and 134). This figure includes city park assessments, outlying areas, and orchards where losses ranged from 30-75% depending on tree type. Anemometers near these locations generally registered peak wind gusts in the 85-95 mph range, with a few areas, such as immediately around Portland, even higher, and this information puts a fairly solid constraint for this velocity of wind, and clearly indicates a rapid escalation of tree loss above the 60 mph gust mark. I suspect, also, that these S-curves are slightly different for individual species. A red alder's curve is probably centered lower than a bigleaf maple's curve, and that of a Douglas-fir (Pseudotsuga menzesii) is even higher than the maple. Thus, as a storm blows down trees of several different species, the signature of the different curves would be a higher number of the weaker species up until the point where the wind is so strong as to wreck all tree species wholesale. Figure 1, below, illustrates this concept with hypothetical curves for two species. |
|
This kind of curve shouldn't be too surprising. Using the standard evolutionary game, trees should have evolved good resistance to the kind of maximum winds that would be expected within their lifetimes. Using wind data from the National Climatic Data Center for the Portland Airport for the period 1959-1995 (37 years), Gusts of 46 mph (40-knot) or more occur literally every winter, often several times a winter around the minimum cutoff, and interior trees generally are able to endure these kinds of winds. Gusts of 55 mph (48-kt) or more are a bit rarer, say a 1-1.5 year event for interior locations, still a small chunk of time compared to most tree's life spans, and most trees do well in these kinds of winds. Wind gusts of 69 mph (60-kt) or more happen roughly every 5-6 years, which is enough time for trees like red alders and paper birches to start reproducing, so their ability to endure such wind isn't as critical as, say, conifers, which often take longer to begin seeding. Winds of 78 mph (68-kt) or more occurr about once a decade at the Portland Airport, and 83 mph (72-kt) or more about once every two decades. Other stations examined, SeaTac Airport and Eugene Mahlon Sweet (23 and 24 year periods respectively) didn't recieve winds of 60 knots or higher in their time periods-of-record, a suggestion that the Portland Airport may be a bit more wind-prone than other interior locations, and the return frequencies listed here may be a bit high, especially for the faster, 60-knot-plus velocities. If the Seattle Naval Air Station wind data is added to the SeaTac data, making the run from 1948 to 1995, with 1970-1972 missing, some 45 total years, then one instance of 60-knot-plus winds is added, which, very rougly so, suggests a return period of once every four to five decades for Seattle. Some of this difference may be due to the fact that the Portland Airport experiences high east winds out of the Columbia River Gorge on occasion, and the other two stations are sheltered, to some extent, from such winds by the Cascade Mountains. One to two decades, however, is a rough minimum time fir trees like Douglas-fir to begin reproducing. Note that a lot of windfalls do happen in storms that produce gusts of 69-83 mph, but still the majority of trees remain standing. Angiosperms are generally shorter-lived trees than gymnosperms. Many red alders, black cottonwoods, and paper birches do not live beyond 40 to 80 years (though, occasionally, they reach two centuries), and these trees seem among the most suseptable to gales. The logest-lived Oregon white oaks are around 500 years or so, and they endure high winds better than many of their angiosperm relatives. Trees like Douglas-firs and western hemlocks can reach 1,000 to 2,000 years, and they appear to be among the trees to endure high winds the best. Looking at higher categories of wind, one can only really guess at the return periods. Wind gusts of 90 mph or higher in the interior probably only happen once every half century or so, and 120 mph gusts or higher might be once a century or two. Fifiy to one hundred years is plenty of time for conifers to grow tall and distribute many seeds--and it is only at the high-winds represented by this time interval that entire forests start collapsing. Again, a fair warning about the concepts being portreyed here: I'm working with very limitied data, and with figures off of the top of my head, so consider this all a very, very, very hypothetical model. Of course, in getting back to the tree data that I collected, there is the possibility that the first three storms had weakened most of the trees that Storm 4 heavily damaged. Since I wasn't tracking how much strain individual trees were taking in the January 1986 storms, my methods can not eliminate this possibility. However, the evidence suggests otherwise. First, wood is pretty resilient to bending without sustaining any critical damage, especially "green", living, wood. Second, if windstorms weakened a tree's wood, then one would expect a heavier toll of trees from subsequent storms. Storm 3 hardly blew down a tree despite its occurrence just five days after the fairly strong Storm 2. And storm 5, detailed below, which happened just 2 days after the powerful Storm 4, didn't significantly damage a single tree, despite having gusts exceeding that of Storm 1. If any weakening was happening in the study site trees, it wasn't very evident. Indeed, probably the only significant weakening these kinds of storms can do is to break a tree's rootlets, reducing the tree's hold on the ground. Thus one might expect more uprootings over time as the winter months progress--but there is little evidence even for this method of tree weakening, though the data from this study are very limited. The information obtained up to Storm 4 is enough to start defining a method of estimating peak wind gusts by amounts of tree damage broken down by species. Table 3, below, separates trees into three categories in terms of the amount of major-tree-damage events observed. Note that this table has been compiled from experience that goes beyond the January 1986 windstorms and includes personal, and often not emperically controlled, observations of trees for all large wind events between February 1981 and May 1987--thus explaining the inclusion of tree species that made few or no appearances in the January 1986 study. Treat the table as a hypothesis that needs to be tested further. This table could only realistically be taken to 65 mph from my own experience, plus the observation, from a report at NWS Seattle on the February 12-13, 1979 Olympic Peninsula windstorm, that large-scale blowdown begins to occur with wind gusts reaching 120 mph (i.e. about 90% blowdown). Between 65 and 120 mph, I would expect to see a rapid escalation of damage down the different categories, but this is only a prediction, not an observation. My best guess would put heavy damage occurring to the left-side-of-the-table trees at around 80-85 mph, with the conifers holding out to 95-100 mph. The words I'm using in the table aren't very specific, so I'll try to quantify them here. Rare might be about 1 tree heavily damaged out of 5,000 members of its species, Light might be 1 tree in 500, Light-Moderate might be 1 tree in 100, Moderate might be 1 tree out of 50, Moderate-Heavy would be 1 tree in 10, Heavy would be around 1 tree in 5, and Extreme would be about 9 trees in 10. I hope to go back to the study woodlots sometime soon and do my best to quantify the number of trees by species; then I can check my estimations on these figures. When the tree count is done, I'm fairly certain this chart, or the category definitions above, or both, will be altered. Until then, this'll have to do. |
| ||||||||||||||||||||||||||||||||||||||||||||||||||||
Last Modified: February 26, 2003 You can reach Wolf via e-mail by clicking here. | Forward to Jan 19, 1986 | Back to Jan 10, 1986 | Back to Jan 1986 Intro | |
 Specimen #: 16JAN1986004
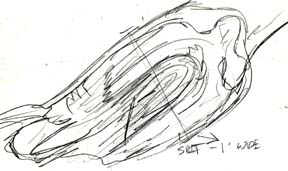 Specimen #: 16JAN1986005
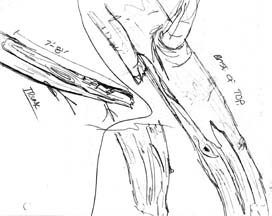 Specimen #: 16JAN1986008