Three Weeks of Intermittent Storms a perspective by Wolf Read |
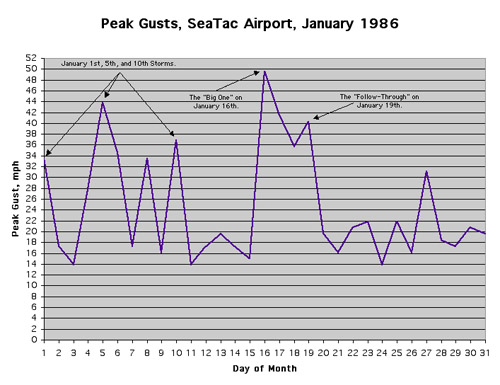
Introduction January, 1986, contrasts sharply with the entire year of 1985, which had been under the steady influence of drought, and the languishing aspects of air stagnation, as well as repeated invasions of continentally modified air. New Year's Day, in fact, brought with it a storm of modest strength, almost as if the weather had some sense for our arbitrary placing of calendar years, and had determined to keep 1985 dry, while adding a wet note to 1986. And after this first storm raked the Pacific Coast, more followed, with significant wind and rain events centered around the 5th, 9th, 16th, and 19th at my Renton, WA, location. Like November 1983, we were at the recieving end of a long storm train, one that continued, with only a short break here and there, up to the 19th, when the jet dove south to give California and SW Oregon a few direct hits, especially in the last days of the month. Sine the time my interest in windstorms showed, I've always been interested in how wind and trees interact. During 1986 I began my firts pursuits toward systematically measuring tree damage. Due to the added scope, this web page strays from the tradition of one primary topic to a page, and is broken down into sub sections for each event in the storm train. Note that information and discussion about these storms, and their effects on trees, build in sequence with the storms, so it is highly recommended that they be read in chronological order. For those just interested in the meteorological details: Of the storms in January 1986, I've detailed the January 16-17th event most like the other pages on this website, as it was the strongest. A peak gust map, and General Storm Data tables are available for this event. Eventually, I'll at least add a peak gust table for the other events examined in these pages. Wind and Trees, a Preliminary Study During the 1984-1987 timeframe, I had a fairly consistent system for recording and measuring the strength of windstorms, as well as specific and easily identifiable woodlots to examine and record tree damage (from here on out known as my "study site"). The study site included six woodlots, which are here ordered closest to furthest from my anemometer: The Forest, Eric's Forest, Southern Woodlot, Northern Woodlot, Mine Woods, and Trillium Forest. Each woodlot was roughly the same size, usually about 50-100 feet deep, and maybe a tenth to two tenths of a mile long. The Trillium Forest was the only one to break this pattern--it probably encompassed a half square mile, but I generally only monitored a western portion of the forest which was maybe 200-300 feet deep and a quarter mile long. Each of these woodlots were at a similar elevation to my monitoring station (about 460 feet), along the lip of the hill on the east side of the Kent Valley. The Trillium Forest was the highest in elevation, reaching the east edge of the hill above Maple Valley Road. The Mine Forest was the lowest, and was situated along the west edge of the hill just above the I-405 "S-curves". The Northern Woodlot was situated the furthest north from my location, and marked the south border of Phillip Arnold Park and the north edge of the Puget Power transmission line corridor. The Southern Woodlot was due south of the Northern Woodlot, though still north of my monitoring station, and marked the southern border of the Puget Power transmission line corridor. Eric's Forest, an extension of The Forest northeast of my location, was a greenbelt on the east side of my block; it was the most wind-protected, with much of it sitting in a hollow formed by Eric's Creek. The Forest, due east of my location, was visible from my window, and was maybe 50 yards away at its closest. Most of these woodlots were within one mile of my anemometers, with the Trillium Forest probably extending to 1.5 miles. I knew all these woodlots well: I had been visiting them almost every day since 1980 as I walked my dogs and did other explorations. With these sites established, I had a fairly good comparative setup for an examination of how trees respond to various wind events. The January 1986 storm series offered a unique opportunity to examine how a series of storms in close succession affected woodlands. This page examines the information that I collected years ago, as well as other aspects of the five principal wind producers out of the storm series (this info being added over time!). A Method of Gauging Local Windstorm Strength: I wasn't fortunate enough to have recording anemometers during the January 1986 storms, but was very interested in capturing these events in total. Thus, I was obliged to watch my anemometer gauges (I had an analog and digital set made by Trade-Wind Instruments) during the entire length of these storms and record each gust by hand, with quick notations of time on each page (I'd usually circle a cluster of gusts and give them the final time). As a very energetic lad who was into many things, I wasn't always up to this challenge of patience (especially when a friend showed up for a session of role-playing games). From these records, I'd tally the total number of gusts for each level in mph, starting at 30 mph, and then muliply the speed by the total. Thus, if ten 30 mph gusts occurred during a particular storm, I'd mulitply 10 X 30 mph to get a figure of 300. If six gusts of 31 mph also happened in the same storm, I'd add the figure 6 X 31 (186) to the 300 yielded from the 30 mph gusts, for a total of 486, and so on. The total sum of all the gusts above 29 mph yielded what I called the Gust Level. I then set up a somewhat arbitrary system where, in essence, every 300 points would yield a 0.1 value on what I called the Windstorm Level. The scale was set up such that a level 10.0 windstorm would be something like the Columbus Day Storm (at my best guess--judging by the storms of 1986, I way underestimated the 1962 storm). Though my scale wasn't logrithmic, the Richter Scale offered the ideals. A Level 8.0+ windstorm was a fairly powerful event. A level 2.0-3.0 fairly minor. The sample storm included here, with the 486 power level, would yield a meager 0.162 windstorm level. Inconsiquential. This system may yield too much weight on the lower windspeeds, as indeed, the wind force increases with the square of the velocity, but, there also seems to be a correlation, albiet a rough one, between the number of lower gusts to that of the storm's peak veolicty. One note in favor of the system is that the storm's duration is built-in. In any event, this figure, as well as the peak gust, will be present for each of the five storms, and these figures yield the best measure I was able to obtain at that time period. These days, I'm more inclined to look at peak gust, simply because it is easier <g>. The Storms Graph 1, below, shows the daily peak gust at Sea-Tac airport for January 1986. Locations further north and south that fell under the influence of these storms have different profiles. See Table 8 in the Appendix at the end of this document, for more discussion on the variance typically seen in Pacific cyclone wind speeds. Source: National Climatic Data Center Climate Visualization Database. |
|
Last Modified: February 26, 2003 You can reach Wolf via e-mail by clicking here. | Back | |