The Queen Charlotte Sound Extratropical Cyclone of March 10, 2016

compiled by

Wolf Read and Charlie Phillips


1.0 Introduction


1.1 Background

Figure 1.1 above Peak gusts (mph and km/h) for the March 10, 2016 windstorm. Wind speeds are largely from long-term surface airways weather observation sites, data buoys, lighthouses and C-MAN stations, with limited data from other networks (e.g. RAWS). Stations with long histories are preferred because of the research focus on intercomparison of historic storms. Numbers preceded by a tilde (~) represent the highest gust report in a dataset that has been interrupted at the height of the storm--usually data loss is from power outages. Values in italics are gusts estimated from peak wind, usually 2-minute or 5-minute, using a 1.3 gust factor. Stations with high-wind criteria gusts (≥58 mph or 93 km/h) are denoted with white-filled circles. Isotachs depicting ≥60 mph (~100 km/h) gusts are included to highlight the regions that had concentrations of the indicated magnitudes. The track of the extratropical cyclone center is shown (yellow arrow). Click on the map to see a larger version. Here is a map listing the station names.


The first of two strong extratropical cyclones that affected Cascadia in the space of three days, the March 10, 2016 storm tracked nearly due north just inside 130ºW and skirted past the north end of Vancouver Island (Figure 1.1). Low-pressure systems on tracks this far to the west typically do not trigger high windstorms in the most populated areas of the region. This storm was an exception, producing high-wind criteria gusts in the range of 60-70 mph (95-115 km/h) from Everett northward into parts of Metro Vancouver. There were a few reports of 80 mph (130 km/h) gusts around Bellingham at well-exposed sites. The Puget Lowlands received gusts largely in the range of 40-50 mph (65-80 km/h). Further south, including in the Willamette Valley, peaks were not quite as strong, ranging from 30-45 mph (50-70 km/h). The northwest California and southwest Oregon coast generally received 45-60 mph (70-95 km/h) gusts, with higher speeds at exposed headlands. The northwest Oregon and southwest Washington coast was the focus of some particularly strong wind gusts, generally ranging from 65-85 mph (105-135 km/h). From Quillayute north, gust speeds were more in the range of 50-60 mph (80-95 km/h) up to the central coast of Vancouver island. Near the track of the low-pressure center, winds of the same magnitude as the main strike zone on the Washington and Oregon coast raked the north end of Vancouver Island.

The intense winds on the northwest Oregon and southwest Washington coastlines is an outcome reminiscent of the December 02-03, 2007 Great Coastal Gale but not as long-lasting or as strong. A coastally-trapped low-level jet appears to have contributed to the extreme winds during both events. Interestingly, the primary low-pressure centers in both cases tracked into the Queen Charlotte Sound, indicating that more distant storms can provide the ingredients for low-level jets along the shores of the Pacific. The two storms were both quite deep, having minimum central pressures ≤965 hPa (28.50" Hg) during their developmental cycle. Deeper cyclones tend to have larger fields of strong winds (Figure 1.2), giving them further reach and greater potential for producing extreme gusts in the region than more typical ≥980 hPa (28.95" Hg) lows.


Figure 1.2 above WRF-GFS 4 km domain three-hour forecast of wind speed, direction and sea-level pressure for the March 10, 2016 windstorm (a) and the March 13, 2016 event (b). The March 10th storm, with a 976 hPa (28.82" Hg) central pressure, has a much larger field of ≥35-knot winds than the March 13th storm that has a shallower 986 hPa (29.12" Hg) minimum pressure. Click on the map for a larger version. Images courtesy of the University of Washington Department of Atmospheric Science.


Other windstorms that have followed a similar track include an intense 957 hPa (28.26" Hg) extratropical cyclone on December 15, 2002 that did not produce the same level of winds in the interior observed on March 10, 2016. Part of the reason for this was the development of a strong wave on the storm's leading frontal system that ended up relaxing pressure gradients over the Pacific Northwest. Barometric pressure fell to extreme lows in the interior, including 978.3 hPa (28.89" Hg) in Salem, but with peak wind gusts in the 20-35 mph (30-50 km/h) range, typical of an average winter storm.


2.1 Storm Impact

In the Lower Mainland of British Columbia, one woman was killed in Port Moody when a tree fell on her house (Crawford and Morton 2016). Rainfall and high tides contributed to flooding in Boundary Bay, Beach Grove and the downtown Ladner waterfront. At least nine homes were inundated in Delta as streets flooded. Numerous trees and branches struck power lines, causing widespread power outages. Schools were closed in Abbotsford, Mission and Surrey. BC Hydro reported around 129,000 customers without power at peak, or about 6.8% of the customer base, in the Lower Mainland, Sunshine Coast and on Vancouver Island at the height of the storm (BC Hydro 2016).

The region around Bellingham, Washington, suffered widespread tree failures, causing road closures and power outages (Bellingham Herald 2016). One tree fell across I-5, and another blocked the Mt. Baker Highway. Disrupted electrical service caused school closures, including Whatcom Community College, and shut down businesses. Winds ripped off part of the front of a Home Depot store. Three fishermen were rescued by the Coast Guard after their boat broke from its moorings during the storm. High elevation gusts up to 109 mph (175 km/h) forced the closure of the Mt. Baker Ski area.

Trees also fell in the Puget Sound area, including across railroad tracks used by the Sounder Northline commuter trains, halting service (Seattle Times 2016). Road closures occurred in Snohomish County and power outages forced school closures. At least 51,000 Puget Sound Energy customers without power during the storm, and for Seattle City Light some 9,000.

Along the Oregon and Washington coast, an alder tree crashed onto an occupied pickup truck being driven on Highway 26, killing a man (Daily Astorian 2016). Pacific Power reported 29,000 customers were without electricity at the height of the storm (Pacific Power 2016). Gusts reached 97 mph on Radar Ridge and windthrown trees blocked highways throughout the region (Chinook Observer, 2016). A tree fell on a house in Ocean Park.


2.0 Synoptic Analysis


2.1 Storm Track


Figure 2.1 above Storm track estimation largely based on surface maps provided by the US. NOAA Weather Prediction Center, and satellite photo interpretation. Faded blue track depicts a secondary low-pressure center that followed very close to the primary low. Date and time in PST and central pressure in hPa (mb).


The extratropical cyclone developed in the Northeast Pacific far off of the northern California coast (Figure 2.1) and moved northeast to 130ºW off of the coast of Washington. The low intensified approximately 18 hPa (0.53" Hg) over nine hours on its approach to the Washington offshore waters, then deepend another eight hPa (0.24" Hg) over the next six hours to 965 hPa (28.50" Hg) as it turned north and tracked just inside 130ºW toward the Queen Charlotte Sound. Deepening at ≥24 hPa in 24 hours puts this storm in the cyclogenic bomb category. Continuing on a nearly due north track, the storm system maintained its intense depth for several hours. This persistence of depth may have contributed to the strong winds over parts of southwest British Columbia as the low moved into the Queen Charlotte Sound, a position that supports strong SE winds along the Georgia and Queen Charlotte Straits. The storm did not begin filling until it passed the north end of Vancouver Island, likely due to increasing terrain interaction as the mature low neared the British Columbia mainland. The low lost 11 hPa (0.32" Hg) of central pressure in the six hours before landfall, and then nine (0.27" Hg) more in the next three hours after reaching the coast.

Interestingly, a secondary low-pressure center developed to the southwest of the primary one. As the primary tracked northeast and then north along 130ºW, this new low rotated counter-clockwise around the base of the initial cyclone. In some ways, this is reminiscent of the December 15, 2002 storm mentioned in the introduction, though the secondary low on March 10, 2016 seems more associated with the primary's bent-back front as opposed to developing along a frontal triple-point. Indeed, the March 10th secondary low appears to merge with the bent-back front of the primary just before reaching the south Vancouver Island coast. Unlike on December 15, 2002 when the secondary low landed in Oregon causing a relaxation of pressure gradients most especially in those areas between the primary and secondary lows, the March 10, 2016 secondary low stayed far offshore and may have enhanced surface pressure gradients along the coast over northwest Oregon and southwest Washington, helping support the observed extreme winds. The pressure gradient over the North Interior and Lower Mainland may also have been enhanced by this secondary low, or at least energy contributed to the bent-back front as it swept inland. The northeast to north-northeast trend of strongest winds (i.e. Astoria to Bellingahm) is reminiscent of Olympic or south Vancouver Island lows on a northeast track--this is comparable to the direction of motion of the secondary low and subsequently the large bent-back front of the primary after the absorption of the secondary. Remnants of the secondary low may have had enough influence on pressure gradients to reduce peak gust speeds over much of southern Vancouver Island, while helping enhance winds from the south Washington coast to the Lower Mainland and southward about a hundred or so miles (~150 km).


2.2 Satellite Photos


Figure 2.2 above Satellite photo composite of: a) four km resolution visible; b) four km water vapor; c) four km enhanced infrared; and d) 1 km visible for 2330 UTC (1530 PST) on March 09, 2016 for the first three and 1500 UTC (0700 PST) March 10, 2016 for the 1 km visible.


Figure 2.3 above Satellite photo composite showing four km resolution water vapor images for: a) 1530 UTC (0700 PST) on March 09, 2016; b) 1300 UTC; c) 0300 UTC on March 10, 2016; and d) 0830 UTC.


Satellite imagery reveals an extratropical cyclone developing over the Northeast Pacific under a strong southwesterly jet stream on the east side of an upper-level trough on March 9, 2016 (Figure 2.2). The storm had a well-developed dry slot, and clearly defined leading frontal systems. The scale of this extratropical cyclone was roughly on par with other big events of recent history, such as the 2006 Hanukkah Eve Storm, though there appears to be less upper-level moisture. The form of the March 10, 2016 windstorm is more similar to the February 4, 2006 event due to both storms having a south-southwesterly to southwesterly jet stream. Frame d depicts the view at daybreak on March 10, 2016, with the tip of the bent-back front moving across the Olympic Peninsula and southern Vancouver Island. Showers are widespread south of this feature, in the wake of the leading cold/occluded front.

The March 10, 2016 extratropical cyclone followed a fairly classic evolution, save for the development of a secondary low south of the main center (Figure 2.3). The incipient cyclone developed far off of northern California, with a baroclinic leaf form and a strong jet stream rushing in out of the southwest, carrying a high cloud shield well ahead of the storm in a classic warm frontal configuration (Figure 2.3a). As the system tracked toward British Columbia, the low continued strengthening with an enhancing dry slot and well-defined bent-back front (Figure 2.3b). Eventually two centers of circulation became evident, the primary nearing the north tip of Vancouver Island and the secondary to the south, off of the central Oregon coast (Frame 2.3c). The last vestiges of the secondary cyclone moved just off of the Washington coast, soon to be absorbed into the large bent-back front that wrapped around the primary low (Frame 2.3d). The leading cold/occluded front swept ashore between frames 2.3c and 2.3d.


3.0 Storm Data


3.1 Peak Wind and Gust


Location Latitude (ºN) Peak Wind (2-min) Peak Gust (3 or 5-sec)
Direct (°) Speed (kt) Speed (mph) Speed (km/h) Time (PST) Day (PST) Direct (°) Speed (kt) Speed (mph) Speed (km/h) Time (PST) Day (PST)

Coast
KACV 40.98 180 26 30 48 1453 9 200 40 46 74 1509 9
KCEC 41.78 190 31 36 57 2209 9 180 42 48 78 2204 9
KOTH 43.42 190 27 31 50 1735 9 170 46 53 85 1815 9
KONP 44.58 210 33 38 61 2255 9 190 48 55 89 1655 9
KAST 46.16 190 36 41 67 1955 9 220 64 74 119 1904 9
KHQM 46.97 160 38 44 70 1853 9 160 53 61 98 2132 9
KUIL 47.94 180 26 30 48 0353 10 180 46 53 85 0353 10
46087 48.49 179 40 46 75 0540 10 170 51 58 94 0532 10
CWEB 49.38 150 39 45 72 2200 9 160 48 55 89 2147 9
Coast Max 210 40 46 75 220 64 74 119
Coast Min 150 26 30 48 160 40 46 74
AGR
Coast Avg 180 32.9 37.9 61 182 48.6 55.9 90 1.48
 
Interior
KRBL 40.15 160 26 30 48 0054 10 150 38 44 70 0811 10
KMFR 42.38 150 23 26 43 1853 9 150 32 37 59 1808 9
KRBG 43.23 180 16 18 30 1553 9 160 22 25 41 1552 9
KEUG 44.13 230 24 28 44 0013 10 220 36 41 67 0127 10
KSLE 44.91 210 20 23 37 0056 10 190 37 43 69 0026 10
KPDX 45.60 110 20 23 37 1353 9 200 31 36 57 0405 10
KKLS 46.12 180 15 17 28 0055 10 160 27 31 50 1935 9
KOLM 46.97 180 20 23 37 2254 9 210 32 37 59 0339 10
KSEA 47.44 190 24 28 44 0853 10 170 39 45 72 0526 10
KNUW 48.35 170 39 45 72 0356 10 170 56 64 104 0358 10
KBLI 48.80 150 36 41 67 0453 10 150 58 67 107 0353 10
CYYJ 48.64 230 18 21 33 1332 10 200 34 39 63 2100 9
CYVR 49.03 150 24 28 44 0700 10 170 35 40 65 0700 10
CYXX 49.18 170 36 41 67 0900 10 170 57 66 106 0900 10
CYQQ 49.72 140 32 37 59 0614 10 150 43 49 80 0614 10
Interior Max 230 39 45 72 220 58 67 107
Interior Min 110 15 17 28 150 22 25 41
AGR
Interior Avg 170 24.9 28.6 46 173 38.5 44.3 71 1.55
Coast/Interior Avgs 1.06 1.32 1.05 1.26
24-Sta Max 230 40 46 75 220 64 74 119
24-Sta Min 110 15 17 28 150 22 25 41
AGR
11-Sta Avg 173 28.1 32.4 52.1 177 42.5 48.9 78.6 1.51
24-Sta Avg 175 28.5 32.7 52.7     177 43.2 49.7 80.1 1.52  


Peak Wind/Gust Table Notes
Peak wind as reported in the hourly and special observations, to keep consistency with earlier records.
Wind is a 2-minute average for all listed stations, save for some NDBC platforms.
Gust for US stations is a 3-second (s) average, save TTIW1/46087 which is a 5-s average. Canadian gust is 3-s.
YVR, YYJ, YXX and YQQ peak gust from the daily data. Timing based on peak in the hourly and special obs.
Buoy 46087 is used in place of TTIW1 as the latter stopped reporting wind in early 2014.

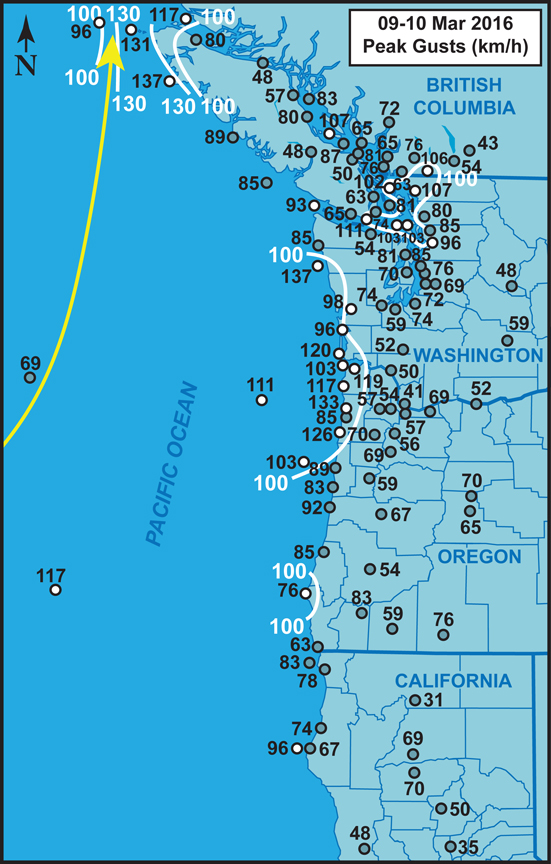
Table 3.1 above For 24 key stations in the study region, peak wind and gust (knots, mph and km/h), with direction (º) and time of occurrence (PST). Regional and overall maximums, minimums and averages are provided, along with the legacy 11-station average. Average gust ratios (average wind/average gust), or AGR, are also included. Wind direction average is based on vector components.


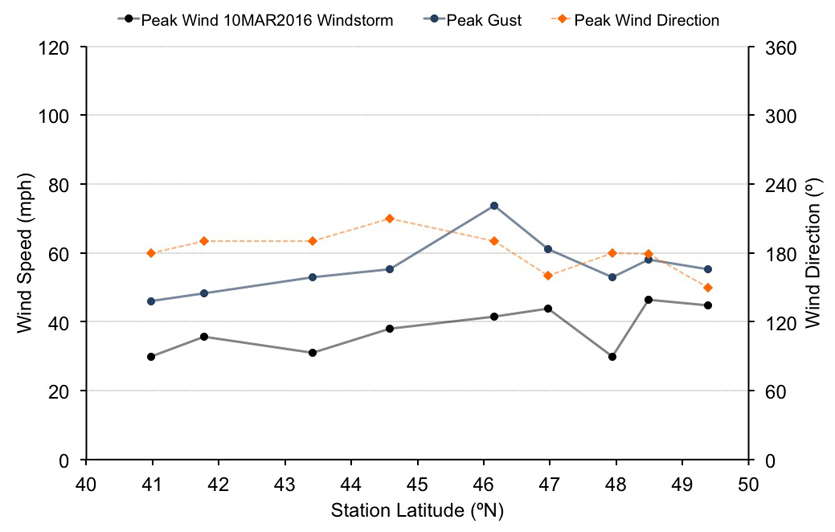
Figure 3.1 above Peak wind (mph), peak gust and peak wind direction (º) for coastal stations arranged by latitude.


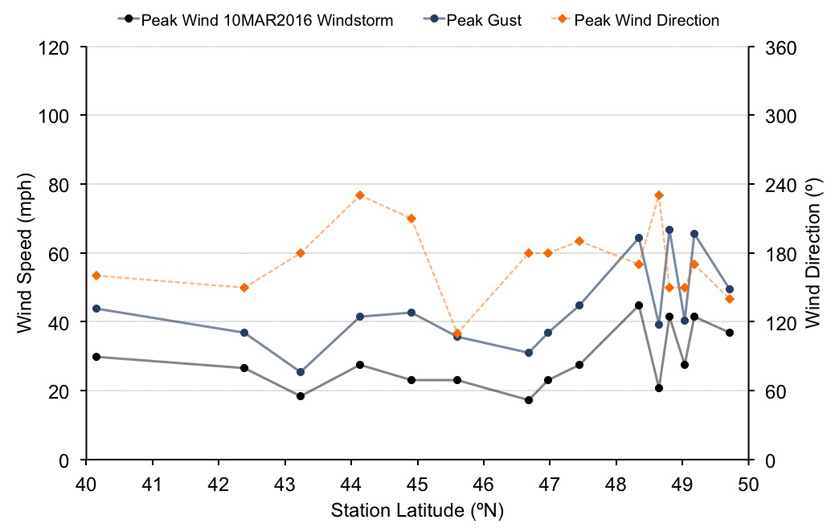
Figure 3.2 above Peak wind (mph), peak gust and peak wind direction (º) for interior stations arranged by latitude.


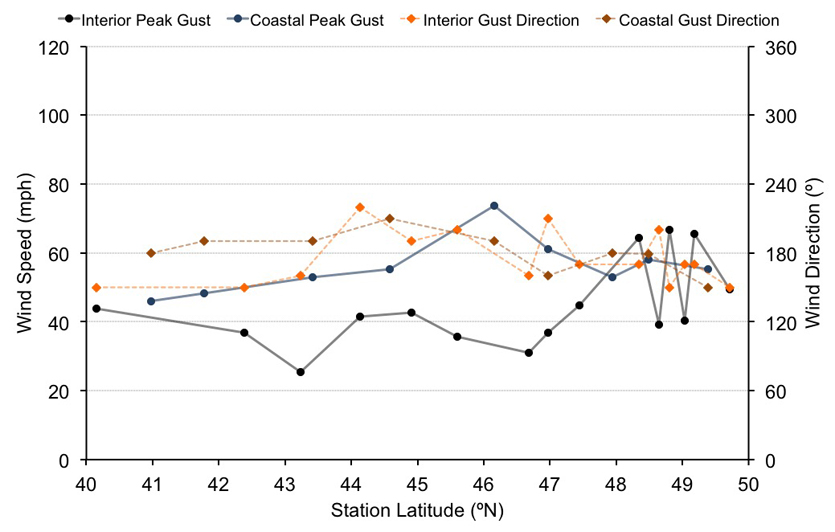
Figure 3.3 above Peak wind (mph) and peak wind direction (º) for coastal and interior stations arranged by latitude.


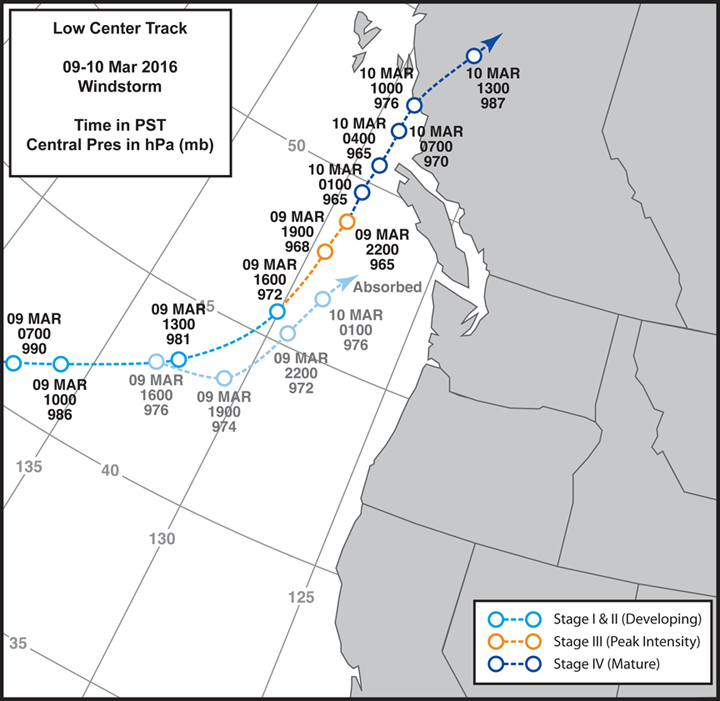
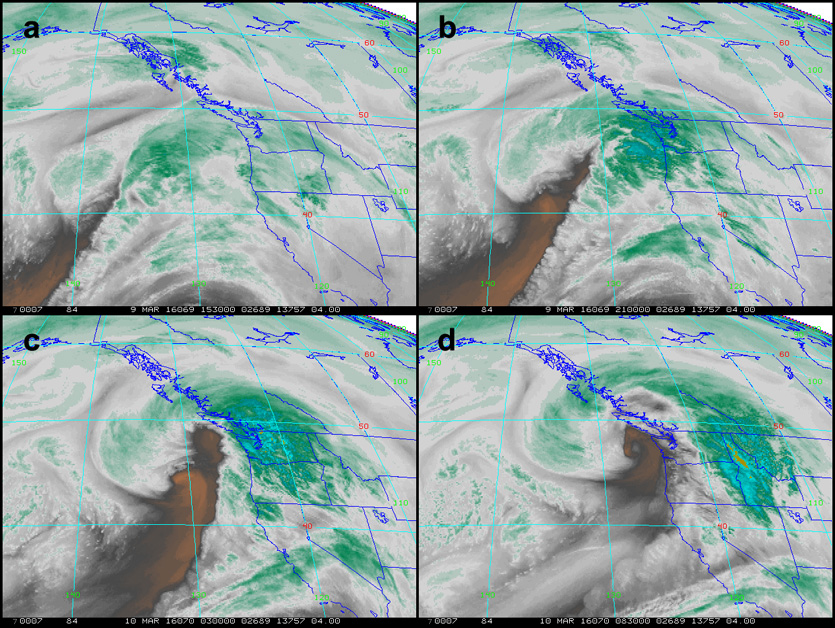
With a 24-station average peak wind of 32.7 mph (53 km/h) and average peak gust of 49.7 mph (80 km/h) from the S, the March 10, 2016 windstorm in overall terms performed about average for Northwest windstorms (Table 3.1, Figure 3.1). However, given a relatively distant track near 130ºW as the low-pressure center moved northward, the wind speeds were actually rather strong and indeed quite unusually so in some locations.

The region of intense winds on the northwest Oregon and southwest Washington coasts is reminiscent of the Great Coastal Gale of December 2007. As with the earlier storm, a coastally trapped jet contributed to the high readings. Also, as noted above, the secondary low that swung around the base of the primary appears to have helped strengthen pressure gradients in the region afflicted by the intense wind gusts. The main low of the December 2007 event also tracked through the Queen Charlotte Sound--perhaps this is a repeating pattern for extreme winds for the region from approximately Newport, OR, to Hoquiam, WA.

In the interior, winds were particularly intense north of Seattle (Figure 3.2), the standard outcome for a classic "southeast sucker" and typically the result of extratropical cyclones following tracking far from the coast. In the main strike zone, some stations were dramatically favored over others for high winds, not an entirely unusual situation among the rugged terrain of the Pacific Northwest. This is looked at more below.

Peak gusts on the coast were markedly higher than in the interior up to about the latitude of Seattle, then the situation reversed to some extent (Figure 3.3). The secondary low appears to have relaxed pressure gradients enough on the central and southern coast of Vancouver Island to prevent more extreme winds from occurring, while at the same time supporting intense southeasterly winds in the Georgia Strait and Northern Inland Waters. Northern Vancouver Island, overrun by the intense pressure gradient surrounding the core of the intense March 10, 2016 extratropical cyclone, was not spared intense winds like the southern 2/3 of the Island.

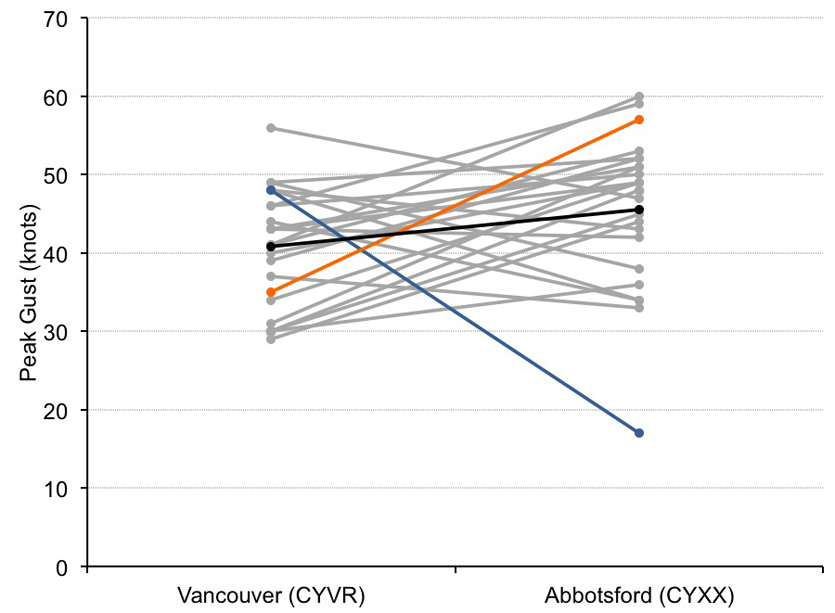
Figure 3.4 above For 24 southeasterly high windstorms that affected the Victoria, Vancouver and Abbotsford region from 1994-2015, the peak gusts (knots) at Vancouver and Abbotsford. The majority of the storms are depicted in gray to show the range of variability. The average peak gust at the two locations for all the storms is highlighted in black. The outcomes of a windstorm on November 8, 1994 and March 10, 2016 are accented in blue and orange respectively.


During the March 10, 2016 windstorm, Vancouver and Abbotsford reported dramatically different peak gusts, 40 mph (65 km/h) verses 66 mph (106 km/h) (Table 3.1). These two locations are just 37.6 straight-line miles (60.6 km) apart. On average, Abbotsford tends to have higher readings than Vancouver during southeasters, so the peak gust outcome on March 10, 2016 is not entirely unusual (Figure 3.4). However, this is the largest exceedance of Vancouver's peak gust for the 22 years 1994-2015. Interestingly, during southeasters, Vancouver sometimes receives stronger peak winds than Abbotsford. The "Looper Storm" of November 8, 1994 resulted in what appears to be the most dramatic difference in peak gusts between the two locations, with Vancouver being slammed by a 55 mph (89 km/h) gust while Abbotsford received a meager 20 mph (31 km/h).

I have not yet encountered a meteorologist to date that can provide a mechanism for the favoring of one station over the other during a specific storm, this despite being an important forecasting issue in the Lower Mainland. Anticipating the region to be most strongly afflicted by an incoming storm would be useful to interests such as electrical utilities, as it would allow them to strategically place damage-control assets ahead of an incoming extratropical cyclone with confidence.

As for a mechanism, my suspicion is that the favoring of one location, more often Abbotsford, has to do with the tendency of a cold surface layer sourced from the Fraser Valley to be emplaced over the Lower Mainland ahead of southeasterly windstorms. SE winds tend to arrive with warmer, more buoyant air that can simply lift right over any emplaced cold air. The resistance of the cold surface airmass to being eroded by increasing S to SE winds likely determines outcomes: Abbotsford is often affected by downsloping winds off of the Cascades during southeasters, and perhaps these winds are often strong and turbulent enough to break up the cold surface layer in the region sooner than Vancouver in many instances--this despite Abby being closer to the source of the cold, dense air. In Vancouver, the North Shore Mountains probably act as an air dam, leaving the region under a shield that directs the wind above the city. The depth of the cold surface layer, combined with the strength of the attacking SE winds, may determine to some extent how long it takes for the warm winds to reach the surface. If it takes long enough, strong SE winds may not hit Vancouver as the center of a given storm moves far enough away to relax local pressure gradients by the time the cold air layer has been removed. Sometimes the surface layer is weak, leaving both locations exposed early during an approaching storm. The pressure gradient orientation (pressure slope) ahead of the storm and during the SE wind onslaught may have a key role in outcomes, too. If E to NE winds are favored, then the cold surface layer can be continually reinforced. In contrast, if the pressure gradient orientation is more in favor of ESE to SE winds ahead of the storm, the source of the cold air may be cut off, allowing for a quicker erosion of the boundary layer. These are just ideas. This topic is just waiting for a detailed study--it would be a nice PhD project.


4.0 Summary and Conclusions


The March 10, 2016 extratropical cyclone developed far off of the West Coast and followed a recurving path that took the center northward near 130ºW and just west of the north end of Vancouver Island. Tracks this far from the mainland generally do not cause high winds in the interior sections of Oregon and Washington (e.g. December 15, 2002). For the most part this was the case on March 10, 2016, save north of Seattle where intense 60 to 70 mph (95 to 115 km/h) wind gusts occurred. The development of a secondary low center that tracked closer to the Washington coast, and the passage of the primary low's bent-back front likely contributed to the strong interior winds, and also gusts of 70 to 85 mph (115 to 135 km/h) on the coast. A coastally-trapped low-level jet also contributed to the coastal wind speeds. In some ways, the March 10, 2016 windstorm behaved like a lesser version of the 2007 Great Coastal Gale.


5.0 Supplemental Storm-Related Information


5.1 Storm Photos


Figure 5.1 above Intense southerly winds at the Pitt Meadows Airport flipped this airplane. The vehicle had been anchored before the storm. Photo by Trevor Batstone.


Figure 5.2 above A toppled tree is suspended on utility lines in Woodinville, WA, after gale-force gusts swept through the Puget Lowlands. Photo by Brie Hawkins.


Data Sources and Bibliography


Data Sources

Surface observations are from the National Climatic Data Center, the National Data Buoy Center, Environment Canada and the University of Washington. Surface maps used for storm track determination are from the US. Weather Prediction Center. Upper-air analysis is based on maps from the US. National Center for Environmental Prediction. Satellite photos are from the US. National Weather Service. Upper-air sounding data are from the University of Wyoming Department of Atmospheric Science.

Other References

BC Hydro, 2016: Power Outages List. Accessed March 10, 2016 at: https://www.bchydro.com/outages/orsTableView.jsp.

Bellingham Herald, 2016: Thousands still without power after storm slams
Whatcom County. Local News, Bellingham Herald, March 10, 2016, 3 pp.

Chinook Observer, 2016: Trees topple as gusts top 100 mph in hurricane-force windstorm. Chinook Observer, March 10, 2016, 2 pp.

Crawford and Morton, 2016: One dead, thousands still without power in Metro Vancouver after windstorm. Vancouver Sun, March 11, 2016, 2 pp.

Daily Astorian, 2016: Portland man killed by fallen tree during hurricane-like storm. Daily Astorian, March 10, 2016, 1 pp.

Pacific Power, 2016: Most Pacific Power Customers Hit by High Winds Have Had Power Restored. Pacific Power, News Releases, March 10, 2016.

Seattle Times, 2016: High winds left Puget Sound residents in the dark. Seattle Times, March 10, 2016, 3 pp.

Last Modified: October 18, 2016
Page Created: April 12, 2016

| Back |