The Olympic Peninsula Extratropical Cyclone of March 13, 2016

compiled by

Wolf Read and Charlie Phillips


1.0 Introduction


1.1 Background

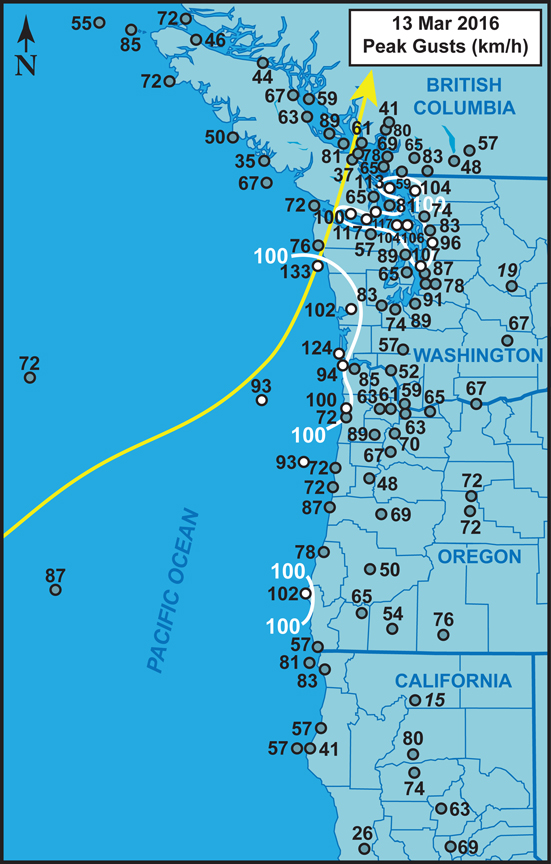
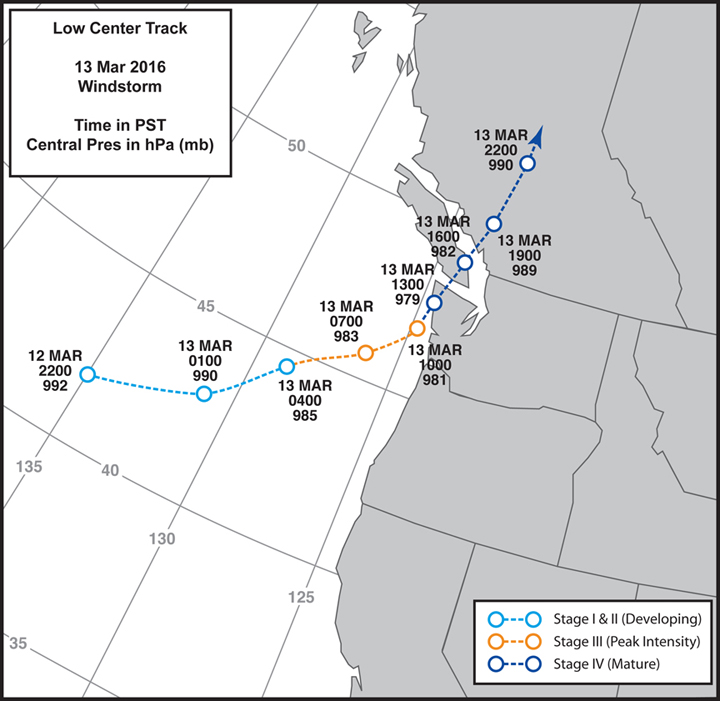
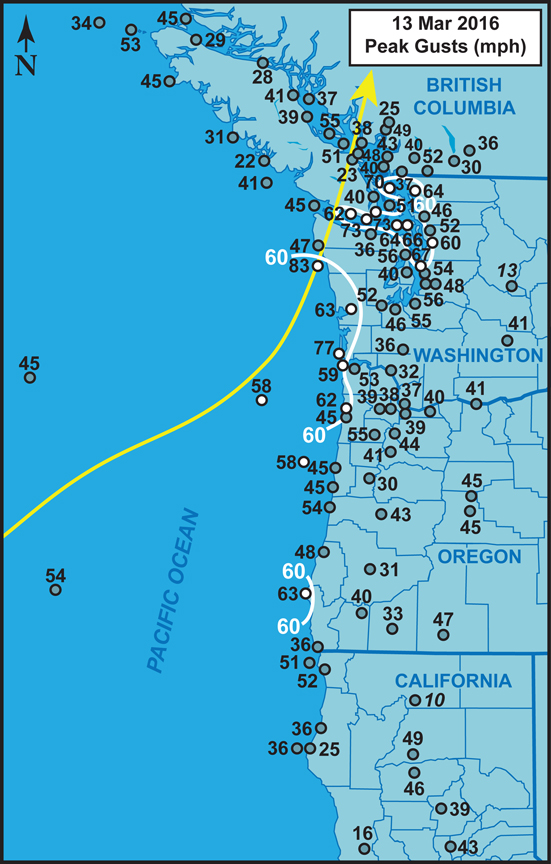
Figure 1.1 above Peak gusts (mph and km/h) for the March 13, 2016 windstorm. Wind speeds are largely from long-term surface airways weather observation sites, data buoys, lighthouses and C-MAN stations, with limited data from other networks (e.g. RAWS). Stations with long histories are preferred because of the research focus on intercomparison of historic storms. Numbers preceded by a tilde (~) represent the highest gust report in a dataset that has been interrupted at the height of the storm--usually data loss is from power outages. Values in italics are gusts estimated from peak wind, usually 2-minute or 5-minute, using a 1.3 gust factor. Stations with high-wind criteria gusts (58 mph or 93 km/h) are denoted with white-filled circles. Isotachs depicting ≥60 mph (~100 km/h) gusts are included to highlight the regions that had concentrations of the indicated magnitudes. The track of the extratropical cyclone center is shown (yellow arrow). Click on the map to see a larger version. Here is a map listing the station names.


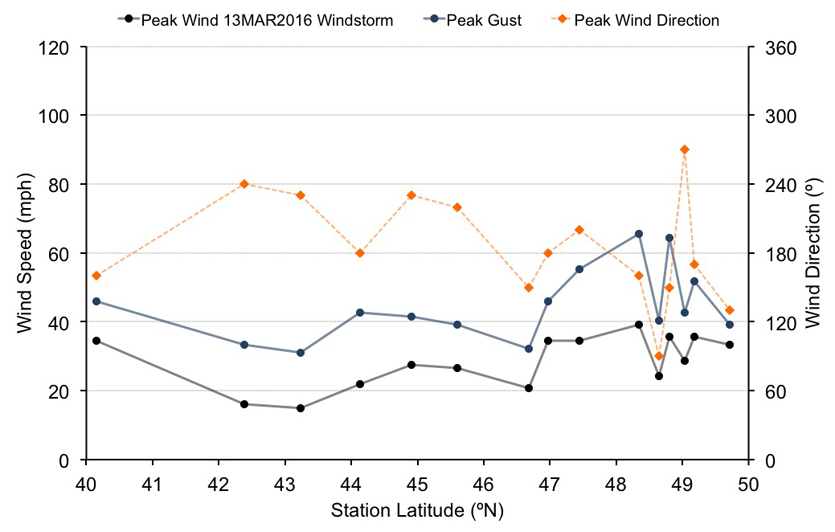
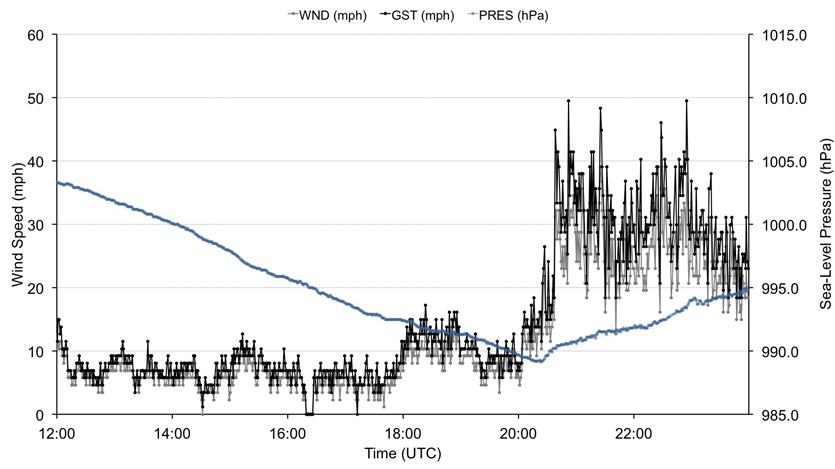
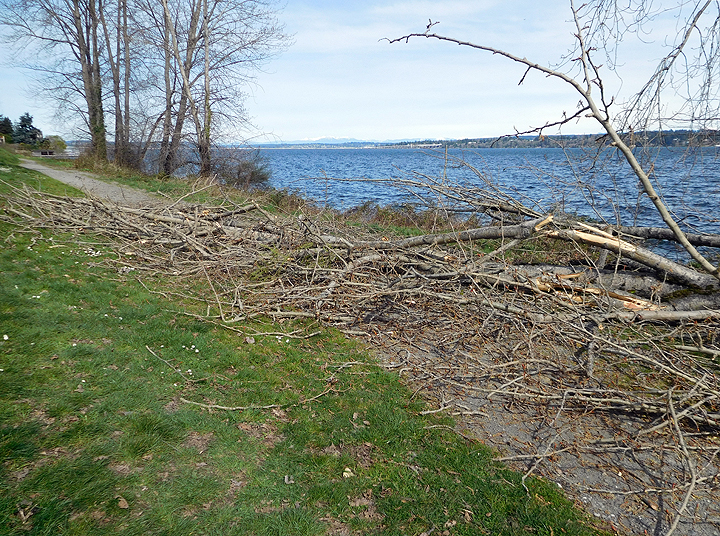
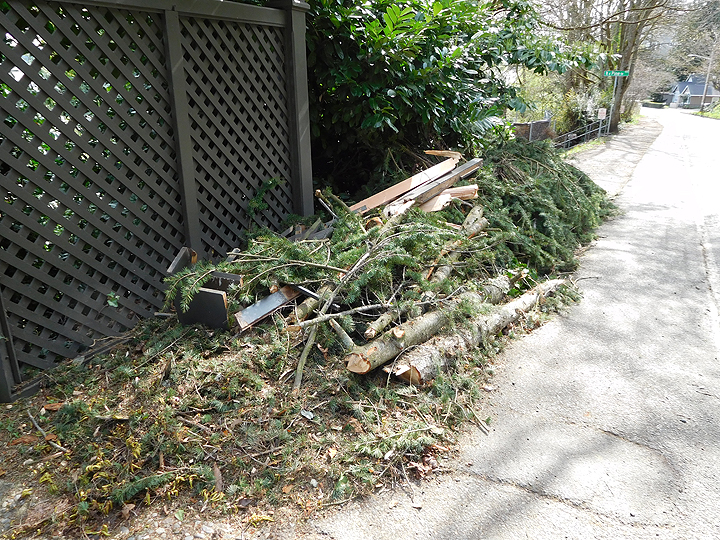
Just three days after an intense low tracked over northern Vancouve Island, lashing parts of Cascadia with high winds on March 10, 2016, another strong extratropical cyclone developed in the base of a broad and deep Gulf of Alaska (GAK) low overnight on March 12-13, 2016. The new cyclone steadily intensified as it rotated around the outskirts of the GAK low, starting out on a easterly track and then curving to the northeast off of the Oregon coast and eventually nearly due north as the storm swept onto the shores of the Olympic Peninsula of Washington (Figure 1.1). This track is a classic one for Seattle windstorms, though not to be confused with the "classic path" category used on the Storm King to refer to storms with paths similar to the 1962 Columbus Day Storm. Given the timing--arriving on the first day of "spring forward" or daylight savings time, the system could be referred to as the "Daylight Savings Storm".

The March 13, 2016 windstorm produced a rather focused band of high winds in areas that ended up on the immediate southeast side of the low-pressure center (Figure 1.1). California by and large did not receive particularly strong winds during this storm, likely due to the far offshore track. Gusts on the Redwood coast were in the rage of 35-50 mph (55-80 km/h), with similar speeds in the Sacramento Valley. Oregon received a glancing blow, with the coast receiving gusts generally 45-60 mph (70-95 km/h), and the interior 30-45 mph (50-70 km/h). The southern and central Washington coast, being brushed by the storm's strong bent-back front, received the brunt with gusts in the range of 60-80 mph (95-130 km/h). For the interior, the most intense winds of this storm just skirted north of the Puget Lowlands where wind gusts were generally 45-55 mph (70-85 km/h). The North Inland Waters region and parts of the Strait of Juan de Fuca received the brunt of the storm, with gusts of 60-75 mph (95-120 km/h). These gusts were from the SE in locations east of the Strait as the low approached and passed the region, and from the W in the Strait as the low moved inland to the north-northeast. The southern sections of Victoria, British Columbia, received these winds. The Saanich Peninsula was sheltered. Further north, peak winds were not as fast, even despite a storm track that is typically supportive of strong winds over the Lower Mainland. It almost seems like the high winds stopped at the Canadian border, with gusts in the greater Vancouver Metro area generally falling in the 40-50 mph (65-80 km/h) range. Vancouver Island's typically windy Pacific coast received relatively low gusts, as did much of the Georgia Strait mainly due to the low passing to the south and east of these regions.

Given that the March 13, 2016 windstorm developed in the base of a deep Gulf of Alaska low, and followed in the wake of a predecessor storm that moved through the region the day before, barometric pressure was already quite low over the region before the arrival of the March 13th storm. For instance, ahead of the windstorm, the highest the pressure reached at Sea-Tac Airport was 1008.5 hPa (29.78" Hg) at 2153 PST on March 12th. This would fall to a rather low 990.7 hPa (29.26" Hg) at 1253 PST (1353 PDT) on March 13th as the low passed to the west, marking a total drop of 17.8 hPa (0.52" Hg). This is strong but not extreme: Many of the major high-wind generating extratropical cyclones have produced pressure drops in the range of 25-30 hPa (0.75-1.00" Hg). Thus, despite a 979 hPa (28.91" Hg) central pressure at landfall on March 13, 2016, the storm produced an outcome more reminiscent of a storm with a 985-990 hPa (~988 hPa or 29.18" Hg) central pressure. This includes the compact nature of the region of most intense gradient, and the relatively narrow zone where winds approached and exceeded high wind criteria. Had this low deepened another 10 hPa before landfall, gusts of 60-65 mph (95-105 km/h) would likely have been more common throughout the Puget Lowlands and perhaps a bit further south.

Due to the compact nature of the storm, and the narrow region affected by high-wind criteria gusts, the track position mattered greatly in terms of wind outcomes. Had the storm landed just a little further south and/or tracked a little more northeast instead of almost due north after reaching the Washington coast, thereby bringing the tip of the bent-back front further south and east, stronger winds may have affected more of the Puget Lowlands.

The low center appears to have gone very near Destruction Island, resulting in a pressure minimum of 979.5 hPa (28.92" Hg) at 1300 PDT. Strong SE winds immediately preceded this lowest pressure, with a gust to 76 mph at 1247 PDT. The southeasterlies were followed by even more intense W winds as the low tracked inland and the bent-back front swept over the island: gusts reached 83 mph at 1505 PDT. A pressure surge of 7.5 hPa in the hour ending 1600 PDT accompanied those westerly winds, intense but not close to a record value--about on par for a strong extratropical cyclone.

The peak gust distribution of this windstorm is quite reminiscent of events with similar tracks on December 21, 1982 and November 24, 1983. The former storm occurred during the strong 1982-1983 El Nino, while the latter happened just afterwards. Synoptic patterns with persistent southwest flow occurred repeatedly around the time of the 1982-1983 El Nino. This happened again during the great two-season El Nino of 2014-2016, and the March 13, 2016 windstorm developed in one of several persistent south to southwesterly storm trains during the storm season of 2015-2016. Indeed the March 13, 2016 windstorm was one of several that occurred during the 2014-2016 El Nino, including storms on December 11, 2014, August 29, 2015, December 21, 2015 and March 10, 2016. Many of these windstorms had strongly meridional paths, reflecting the tendency for south to southwest flow.


1.2 Storm Impact

According to various media sources including KOMO news radio and The Seattle Times, the March 13, 2016 windstorm caused one fatality in Seattle due to a tree falling onto an occupied car in Seward Park. The 520 and Hood Canal Floating bridges were closed because of high winds and water splashing onto the road deck. Indeed, the 520 drawspan suffered some damage due to the crashing waves. On the Tacoma Narrows Bridge, heavy winds shoved a truck onto its side. Some ferry sailings were cancelled. Toppled trees blocked a number of roads, including I-5 southbound in Everett. Construction scaffolding at the University of Washington fell under the force of the wind and fortunately did not land on anyone. A house in Bothell was destroyed by a fallen tree. Power outages in the greater Seattle Area were widespread, especially in the north end, with numerous doused stoplights resulting in traffic slowdowns.

About 176,000 Puget Sound Energy customers, with an additional 41,000 Seattle City Light customers, were without power at the height of the storm. Southwest British Columbia outages were not particularly high, likely due to the fact that a stronger windstorm on March 10, 2016 knocked down most of the weakened tree material waiting to go. The main exception included parts of southern Vancouver Island that were swept by strong westerly winds behind the low. The difference between the two storms was large, approximately 29,000 (1.5% of the customer base) on the 13th verses 129,000 (6.8%) customers without power on the 10th.


2.0 Synoptic Analysis


2.1 Storm Track


Figure 2.1 above Storm track estimation largely based on surface maps provided by the US. NOAA Weather Prediction Center and satellite photo interpretation. Date and time in PST and central pressure in hPa (mb).


The extratropical cyclone intensified far to the south off of the southern Oregon coast (Figure 2.1) and initially moved east, followed by northeast to inside 130ºW at about 43ºN. The low continued tracking northeast to just off of the southwest Washington coast, deepening rapidly from 990 hPa (29.23" Hg) to 981 hPa (28.97" Hg) in just nine hours, marking a strong system. At this point, the low changed direction to nearly due north and tracked just off the Washington coast until landing in the vicinity of Quillayute. The system remained very strong, with some deepening up to the point of landfall. There, the storm moved over the tip of the Olympic Peninsula, then across the Strait of Juan de Fuca and through southern Vancouver Island before crossing the Georgia Strait and entering the British Columbia Mainland. As the extratropical cyclone moved onto land and interacted with the steep and complex terrain of the region, the storm began to weaken in classic fashion, gaining 10 hPa (0.30" Hg) in six hours. This likely reduced the wind impact in much of British Columbia.

This windstorm is a marginal classic-path event. A track inside 130ºW south of 45ºN, then recurving to the tip of the Olympic Peninsula followed by a nearly meridional track across southern Vancouver Island. Is just enough to put the storm in the category, though it might be considered a marginal case since the center remained quite far from much of the Oregon coast.


2.2 Satellite Photos


Figure 2.2 above Satellite photo composite of: a) four km resolution visible; b) four km water vapor; c) four km enhanced infrared; and d) one km visible images for 1630 UTC (0830 PST) on March 13, 2016 for the first three and 1645 UTC (0845 PST) for the 1 km visible.


Figure 2.3 above Satellite photo composite showing four km resolution water vapor images for: a) 0400 UTC (2000 PST) on March 13, 2016; b) 0600 UTC; c) 1430 UTC; and d) 1630 UTC. Images a and b depict the incipient cyclone developing in the base of a Gulf of Alaska low. Frames c and d show the extratropical cyclone at peak intensity, with an enhanced dry slot, well-defined bent-back front and classic comma shape.


Satellite imagery reveals an extratropical cyclone developing over the Northeast Pacific along the north side of a strong zonal jet stream in the base of an upper-level trough (Figures 2.2 and 2.3). As the low deepened rapidly, it also rotated around a large and mature Gulf of Alaska low, recurving right into the Washington coast. The storm reached peak intensity as it crossed the latitude of the mouth of the Columbia River, taking on a classic comma form with a well-defined bent-back occlusion wrapping around the southwest side. This occlusion would eventually develop a multiple spiral as the storm matured just before landfall.


3.0 Storm Data


3.1 Peak Wind and Gust


Location Latitude (ºN) Peak Wind (2-min) Peak Gust (3 or 5-sec)
Direct (°) Speed (kt) Speed (mph) Speed (km/h) Time (PST) Day (PST) Direct (°) Speed (kt) Speed (mph) Speed (km/h) Time (PST) Day (PST)

Coast
KACV 40.98 190 21 24 39 0221 29 210 31 36 57 0221 29
KCEC 41.78 190 35 40 65 0056 29 190 45 52 83 0044 29
KOTH 43.42 270 26 30 48 1255 29 230 37 43 69 1255 29
KONP 44.58 210 29 33 54 0715 29 210 39 45 72 0615 29
KAST 46.16 210 28 32 52 0923 29 210 46 53 85 0745 29
KHQM 46.97 200 39 45 72 0821 29 200 55 63 102 0832 29
KUIL 47.94 250 26 30 48 0938 29 240 41 47 76 0938 29
46087 48.49 98 31 36 57 1030 29 100 39 45 72 1022 29
CWEB 49.38 180 27 31 50 0700 29 180 37 43 69 0652 29
Coast Max 270 39 45 72 240 55 63 102
Coast Min 98 21 24 39 100 31 36 57
AGR
Coast Avg 201 29.1 33.5 54 201 41.1 47.3 76 1.41
 
Interior
KRBL 40.15 160 30 35 56 0454 29 150 40 46 74 0355 29
KMFR 42.38 240 14 16 26 1753 28 260 29 33 54 0559 28
KRBG 43.23 230 13 15 24 0253 29 230 27 31 50 0253 29
KEUG 44.13 180 19 22 35 0954 29 180 37 43 69 0959 29
KSLE 44.91 230 24 28 44 0756 29 180 36 41 67 0831 29
KPDX 45.60 220 23 26 43 0853 29 190 34 39 63 1008 29
KKLS 46.12 150 18 21 33 0815 29 140 28 32 52 0815 29
KOLM 46.97 180 30 35 56 0854 29 210 40 46 74 0831 29
KSEA 47.44 200 30 35 56 1153 29 200 48 55 89 1135 29
KNUW 48.35 160 34 39 63 1056 29 160 57 66 106 1102 29
KBLI 48.80 150 31 36 57 1153 29 140 56 64 104 1123 29
CYYJ 48.64 90 21 24 39 1400 29 170 35 40 65 1320 29
CYVR 49.03 270 25 29 46 1116 29 70 37 43 69 1116 29
CYXX 49.18 170 31 36 57 1254 29 170 45 52 83 1200 29
CYQQ 49.72 130 29 33 54 0900 29 140 34 39 63 1000 29
Interior Max 270 34 39 63 260 57 66 106
Interior Min 90 13 15 24 70 27 31 50
AGR
Interior Avg 179 24.8 28.5 46 171 38.9 44.7 72 1.57
Coast/Interior Avgs 1.13 1.17 1.18 1.06
24-Sta Max 270 39 45 72 260 57 66 106
24-Sta Min 90 13 15 24 70 27 31 50
AGR
11-Sta Avg 193 25.7 29.6 47.6 189 39.1 45.1 72.5 1.52
24-Sta Avg 189 26.8 30.8 49.6     184 40.0 46.0 74.1 1.49  


Peak Wind/Gust Table Notes
Peak wind as reported in the hourly and special observations, to keep consistency with earlier records.
Wind is a 2-minute average for all listed stations, save for some NDBC platforms.
Gust for US stations is a 3-second (s) average, save TTIW1/46087 which is a 5-s average. Canadian gust is 3-s.
YVR, YYJ and YXX peak gust from the daily data. Timing based on peak in the hourly and special obs.
Buoy 46087 is used in place of TTIW1 as the latter stopped reporting wind in early 2014.

Table 3.1 above For 24 key stations in the study region, peak wind and gust (knots, mph and km/h), with direction (º) and time of occurrence (PST). Regional and overall maximums, minimums and averages are provided, along with the legacy 11-station average. Average gust ratios (average wind/average gust), or AGR, are also included. Wind direction average is based on vector components.


Figure 3.1 above Peak wind (mph), peak gust and peak wind direction (º) for coastal stations arranged by latitude.


Figure 3.2 above Peak wind (mph), peak gust and peak wind direction (º) for interior stations arranged by latitude.


Figure 3.3 above Peak wind (mph) and peak wind direction (º) for coastal and interior stations arranged by latitude.


With a 24-station average peak wind of 30.8 mph (50 km/h) and average peak gust of 46.0 mph (74 km/h) from the S, the March 13, 2016 windstorm performed about average for this class of windstorm (Table 3.1). The legacy 11-station averages were not much different from the 24-station averages, a common outcome (the 24-station and 11-station averages are usually within one mph of each other), suggesting that this smaller list of stations traditionally used on The Storm King was sufficient to classify windstorm magnitude. In comparison to the March 13, 2016 event, the 1983 Thanksgiving Day storm had an 11-station average peak wind of 29.9 mph (48 km/h) with average gust to 49.9 mph (80 km/h) out of the SSW, the gusts being somewhat stronger on average than during the 2016 windstorm--this includes 60 mph (96 km/h) at Olympia and 62 mph (100 km/h) at Sea-Tac. The December 21, 1982 produced an average peak wind of 29.3 mph (47 km/h) with gust to 45.4 mph (73 km/h) out of the S, almost a match though the fastest interior gusts were not quite as strong as seen in 2016. The 1993 Inauguration Day Storm produced a strong 31.9 mph (51 km/h) average peak wind with gust to 52.4 mph (84 km/h) from the SSW, markedly stronger, with intense coastal gusts and strong interior gusts including 64 mph (102 km/h) at the Sea-Tac Airport.

There are, of course, differences in wind measurement methodology between the storms. During the abovementioned storms from 1982-1993, the wind was measured on analog cup-based anemometers with wind (sometimes called sustained wind) being a 1-minute average and gust being an instantaneous (~1-sec) reading. Digital sonic anemometers were in operation during the March 13, 2016 windstorm, with wind a 2-minute average and gust being a 3-second moving average. The longer period averages used in the present day would tend to favor lower readings for the same run of wind, though by how much is unclear because sonic anemometers are very sensitive to sudden changes in winds speed as they do not have the inertial response issues of cup-based anemometers. This means that the 2016 windstorm might have been closer to the 1993 Inaugural Day Storm than it at first appears, though the difference in damage outcomes suggests something less.

The peak gust at Vancouver International Airport of 43 mph (69 km/h) occurred out of 70º as the low-pressure center approached from the south-southwest. While 43 mph is not particularly fast for a windstorm, this is one of the strongest gusts out of the northeast quadrant ever recorded at Vancouver. Indeed, it is the highest since a gust of 47 mph occurred out of 90º on March 14, 1995--21 years nearly to the day.

The March 13, 2016 windstorm's narrow focus of strongest winds is somewhat evident on the coast between the latitudes of 46ºN and 48ºN (Figure 3.1). The interior surface wind response has a much more pronounced peak than the coast. This maximum is shifted a degree of latitude further north than the coastal peak, between 47ºN and 49ºN (Figure 3.2), the distribution reflecting the north-northeast track of the low-pressure center. Interestingly, the strongest winds missed both the Victoria and Vancouver International Airports while lashing nearby locations, resulting in the jagged trend-line at the north end of the interior station plot.

On average, the coast had higher peak gusts than the interior, though locally this pattern reversed dramatically north of 47ºN (Figure 3.3). Peak gust directions were roughly the same between the coast and interior, S to SW, though some stations that ended up in the low's northwest quadrant had peaks out of the E while under the wraparound cloud shield of the low, a classic response under the circumstances.

Figure 3.4 above One-minute samples of average wind (WND) and gust (GST) in mph, with wind direction in degrees (WDIR), for March 13, 2016. Times are in UTC (-7/-8 hours for PDT/PST). Data are from the University of Washington Department of Atmospheric Sciences rooftop sensor.

Figure 3.5 above One-minute samples of average wind (WND) and gust (GST) in mph, with sea-level pressure in hPa (PRES), for March 13, 2016. Times are in UTC (-7/-8 hours for PDT/PST). Data are from the University of Washington Department of Atmospheric Sciences rooftop sensor.


In the Seattle Area, the onset of the March 13, 2016 windstorm's strongest winds was quite sudden (Figure 3.4). The heavy gusts arrived right after the wind direction went through a rapid shift from E to SE then S. The strongest gusts occurred within about a half hour of the S wind arrival--to be matched later on but not exceeded. Much of the damage from this windstorm occurred during this early period.

This kind of sharp wind attack has been observed before during Pacific Northwest windstorms, including in the Seattle Area. Perhaps the strongest such example happened during the October 21, 1934 windstorm. For extratropical cyclones with a strong meridional track (i.e. north-northeast to north), southerly winds tend to ramp up very quickly when the pressure slope (i.e. pressure gradient orientation) shifts above 90º, or approximately when the low-pressure center has moved north of the latitude of the station of interest.

An added complication with the March 13, 2016 windstorm is that the leading occluded front arrived at nearly the same time that the low reached the latitude of Seattle (Figure 3.5). This is evidenced by the sharp pressure minimum just ahead of the strongest winds. Once the front moved through, the rain ceased and the temperature warmed to about 52ºF (11ºC) (not shown) along with the arrival of the strongest winds--this lasted from about 2030 to 2130 UTC. After an initial jump, the barometric pressure climbed steadily during this strong wind phase of the storm. After a modest lull that lasted about an hour, the winds picked back up around 2220, along with a more rapid pressure rise and falling temperature. This likely marks the passage of the bent-back front. With this feature, wind speeds matched those of the initial wind escalation, before fading after 2300. Overall, wind gusts of 40 mph (65 km/h) and above occurred from 2038 to 2254, or about 2.25 hours.


4.0 Summary and Conclusions


The March 13, 2016 extratropical cyclone developed in the base of a deep Gulf of Alaska low--a secondary spinup situation--and followed a classic track for a Seattle Area and North Interior windstorm. Other storms with similar tracks and peak wind and gust outcomes include December 21, 1982 and the 1983 Thanksgiving Day Storm. The measured wind speeds put the March 13, 2016 windstorm about on par with the two 1980s storms. The January 20, 1993 Inaugural Day Storm is a more intense windstorm example from this track type.

Because the extratropical cyclone developed and tracked into a region with relatively low pressure overall, the March 13, 2016 windstorm appears to have behaved like a classic 985 to 990 hPa (29.09" to 29.23" Hg) low, despite having a 979 hPa (28.92" Hg) central pressure at landfall. One outcome of this is that the March 13, 2016 windstorm had a compact core. High winds only affected a fairly focused region, and indeed the strongest gusts skirted just north of much of Seattle. Minor deviations of track could have altered peak wind outcomes significantly. A little further south and Seattle may have been hit with the 60-70 mph gust that occurred in the North Interior.


5.0 Supplemental Storm-Related Information


5.1 Storm Photos


Figure 5.1 above Southerly wind gusts of 45-55 mph (70-90 km/h) swept the Lake Washington Shores around Seward Park, bringing down trees and branches. This Douglas-fir broke near the base and then crashed into nearby pines, breaking several large branches as the tree plunged to the ground, its top shattering over a walkway. The Douglas-fir clearly had some heartwood rot and this may have contributed to a greater vulnerability to breakage. Near to where this tree fell, another windthrown bole crushed a car, killing one person.


Figure 5.2 above Emergency response after a large tree fell and crushed a car in Seward Park, killing the driver. The rescue of a second passenger, a toddler, continued as the winds raged.


Figure 5.3 above As if on a routine day, a person runs past a snapped tree as gale-force wind gusts continue to pummel Seward Park and emergency responders attend to a tree-related fatality.


Figure 5.4 above Along South Genesee Street in Seattle, a fence had been blown out by the wind. Solid wooden fences like this are a routine damage feature during windstorms.


Figure 5.5 above This tree at the University of Washington grazed a light pole on its way down and reached a sidewalk. As measured from the rooftop of the Atmospheric Sciences Building, wind gusts reached 49 mph (80 km/h) on campus. This tree had lost much of its heartwood to rot that probably compromised its ability to withstand heavy wind loads.


Figure 5.6 above A healthy red alder snapped under the force of the gale and nearly struck a utility pole. The top crashed across a sidewalk along Sand Point Way NE in Seattle.


Figure 5.7 above Large birch branches dropped onto this sidewalk along NE 65th St in Seattle.


Figure 5.8 above During the windstorm, power outages left traffic signals dark, here on NE 65th in Seattle, turning many intersections into four-way stops. Heavy gusts, the leftovers from earlier stronger winds, cased the lights to sway as the photo was taken.


Figure 5.9 above A broken branch is left suspended in this cedar tree. This is a common long-term hazard after windstorms. Branches captured in the canopy can eventually be shaken loose by following storms, including ones of moderate intensity. Photo by Charlie Phillips.


Figure 5.10 above This windthrown black cottonwood, growing right on the Lake Washington shore, buried a path with numerous limbs. The tree seemed to have poor anchorage and may have had some fungal damage. But as with all wind-shattered trees that have pathologies, one is left asking questions like why did this tree not fall during the August 29 or November 17, 2015 windstorms, when it almost certainly still had many of its leaves (offering more resistance to the wind)? Perhaps the cottonwood was better sheltered by the leafy crowns of its neighbors in the summer/autumn. Photo by Charlie Phillips.


Figure 5.11 above Post-storm cleanup near E Pine Street in Seattle. These days, the buzz of chainsaws and chippers is the sound of an abating tempest. Photo by Charlie Phillips.


Data Sources and Bibliography


Data Sources

Surface observations are from the National Climatic Data Center, the National Data Buoy Center, Environment Canada and the University of Washington. Surface maps used for storm track determination are from the US. Weather Prediction Center. Upper-air analysis is based on maps from the US. National Center for Environmental Prediction. Satellite photos are from the US. National Weather Service. Upper-air sounding data are from the University of Wyoming Department of Atmospheric Science.

Last Modified: October 29, 2016
Page Created: March 25, 2016

| Back |