The Powerful March 27, 1963 Windstorm compiled by Wolf Read |
|
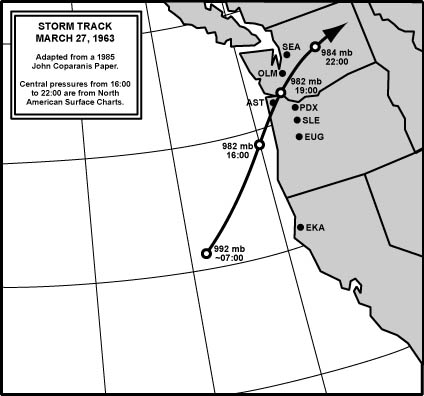
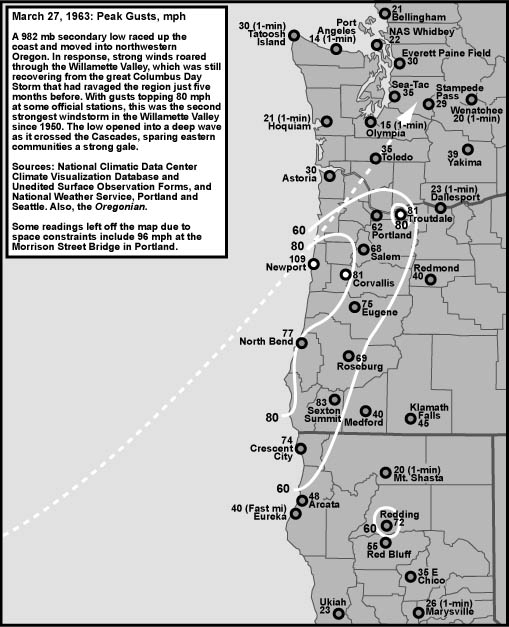
Introduction First in a 5-year series of similar "Storm King" events during the mid-1960s, this cyclone had a sting of intensity that appears to be the norm for a strong cyclone moving inland just north of the Willamette Valley. In early Spring of 1963, a strong 972 mb low set up in the Gulf of Alaska, centered around 57° N and 140° W. Intense secondary waves developed and swung around the base of the broad low. On March 27,1963, one of these waves underwent cyclogenesis as it raced northeast-ward off the Oregon coast. After deepening to 982 mb, the storm rushed ashore just north of Newport, Oregon. A strong gradient south of the low's track was carried inland, and intense winds assaulted the Northern California and Oregon coast before moving into the Willamette Valley with near equal intensity. Peak winds reached 60 to 80 mph at official stations in many parts of Western Oregon, with unofficial gusts as high as 96 mph at the Morrison Street Bridge in Portland. The above scenario, with strong atmospheric waves spinning around the base of an intense low in the Gulf of Alaska, seems to be the usual setup for throwing strong lows, and their potential high winds, into Western Oregon. This kind of situation produced the March 1, 1974 gale, and the Februray 7, 2002 South Valley Surprise. Strong lows in December 2002 also developed in similar fasion with a broad 980 mb cyclone being carried into Western Oregon. It is suspected that the Great Gale of January 9, 1880 was also in this category of storm development. The powerful October 2, 1967 event, despite landing in West Oregon, was different--it was a discrete primary low that underwent classic bomb cyclogenesis. Thus, there are at least two general synoptic situations that can thow a cyclone across Oregon's shores. The February 5, 1965 event, a double low that moved through Western Washington, suggests a third scenario--at least for a high wind strike focused in Western Oregon. The deep Gulf of Alaska low made several waves, and a strong 978 mb low followed closely on the heels of the March 27, 1963 storm, racing across Vancouver Island early on the 28th. For some stations in Washington, it is difficult to ascertain just when the winds from the 27th event ended and the winds of the 28th storm began. For places in Western Washington the storm on March 28, 1963 appears to have produced stronger winds. This includes sustained winds of 35 mph with gusts to 49 at Sea-Tac at 13:57 and 38 mph gusting to 59 at Tatoosh Island at 03:45. Eventually, this storm will be examined more closely. The March 1963 cyclone struck just five-and-a-half months after the great Columbus Day Storm. This probably played a significant role in reducing the damage wrought by the later storm, as the Big Blow "cleaned out" most structures and trees that were prone to high winds. Because of the exceptionally strong winds produced in parts of the Willamette Valley, the 1963 cyclone probably would have been more prominent in the memories of long-time residents had it not happened in such close proximity to the storm of '62. This "Columbus Day clean out" theme would return again four years later, with the powerful gale of 1967. Indeed, a suspicion of mine is that the Columbus Day Storm may have removed enough obstructions (especially trees) in the Willamette Valley that wind readings were higher in the 1963 and 1967 storms than they would have been had the Columbus Day Storm not occurred. Figure 1, below, details the March 27, 1963 storm's track, with central pressures and times noted. |
|
General Storm Data Minimum Pressures and Peak Gradients Table 1, below, is a list of the lowest barometric pressures, and time of occurence, for the March 27, 1963 windstorm. The readings are quite low for late March, and as far as I have seen, many are monthly records. The March 26, 1971 windstorm produced lower prssures at Astoria, Quillayute (Tatoosh's replacement after 1964) and Olympia. Compared to the October 2, 1967 event that produced a similar spread of peak wind gusts in Western Oregon, the pressure minima during the March 27, 1963 storm are more uniform, suggesting a broader cyclone with weaker gradients. The 1963 event moved much more quickly than the 1967 storm, and this may have contributed to stronger wind gusts at some locations. Source: Microfilm copies of the unedited surface observation forms, obtained from the National Climatic Data Center. |
|
Table 2, below, is a list of the maximum pressure gradients, and time of occurrence, for the March 27, 1963 windstorm. Gradients like the +17.3 mb (+0.51") ACV-OTH, +12.6 mb (+0.37") MFR-EUG and +9.9 mb (+0.29") EUG-PDX are fairly strong, but are not in the record category. The +20.5 mb (+0.61") AST-TTI gradient is fairly strong, but it falls short of many windstorms in history. The AST-DLS gradient briefly went positive at 22:00 on March 27th, then a +8.0 mb (+0.24") pressure surge at The Dalles switched situation back to negative inside an hour. West winds up to 23 mph accompanied the surge, suggesting that it was associated with frontal passage. Source: Microfilm copies of the unedited surface observation forms, obtained from the National Climatic Data Center. |
|
Table 2 Notes: [1] Max negative gradient was -3.8 mb at 15:00 on March 27th. [2] Max negative gradient was -7.1 mb at 13:00 on March 27th. [3] Max negative gradient was -2.5 mb at 18:00 on March 27th. [4] Max positive gradient was +0.6 mb at 22:00 on March 27th. [5] Max positive gradient was +0.3 mb at 22:00 on March 27th. |
Pressure Tendencies The March 27, 1963 windstorm brought with it a significant "pressure couplet" over much of Western Oregon, with strong pressure surges (+3.0 mb and higher) at stations that fell within about 200 miles of the storm's center. Table 3, below, shows the maximum hourly changes in pressure for eleven key stations in the Pacific Northwest. The Willamette Valley and Oregon Coast witnessed especially strong pressure climbs with this event, especially at North Bend and Salem. Neither of these values, however, were as strong as those witnessed during the Columbus Day Storm just five months before, and thus no hourly pressure tendency records were set by the March 27, 1963 storm. There's a fair correlation between maximum winds and maximum pressure tendencies with this storm, save maybe Astoria, Olympia and Sea-Tac, which had active barometers without signficant winds because the low center passed south of the stations. Source: Microfilm copies of the unedited surface observation forms, obtained from the National Climatic Data Center. |
| ||||||||||||||||||||||||||||||||||||||||||||||||||||||||||||||||||||||||||||||||||||||||||
Table 3 Notes: [1] The +2.0 mb hourly rise at Arcata is the last of two occurrences, the other instance having occurred the hour before. [2] The -2.5 mb hourly fall at Eugene is the last of two occurrences, the other instance having occurred at 14:00. [3] The +0.7 mb hourly rise at Tatoosh Island is the last of two occurrences, the other instance having occurred at 23:00 on March 27th. [4] The -2.1 mb hourly fall at Olympia is the last of three occurrences. [5] Bellingham shows a -5.4 mb hourly fall at 13:00. After careful consideration of the available pressure record, this reading is deemed spurious. The 12:00 pressure reading was probably written incorrectly on the surface observation form. |
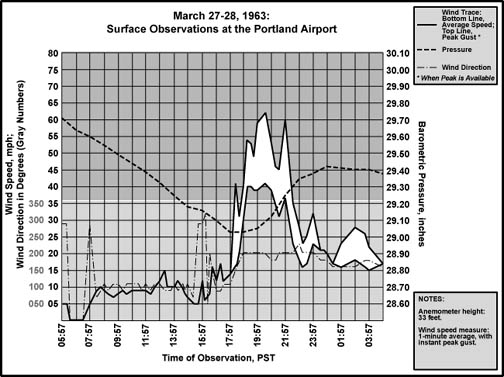
Peak Wind and Gust Table 4, below, lists the peak wind and gust for eleven key stations in the Pacific Northwest, their direction, and their time of occurrence. "Peak Wind" is a 1-minute average, and "Peak Gust" is an instant (approximately 1-second) average. By my own personal methodology, a wind event rates the term "windstorm" when the average peak gust of these eleven stations reaches 39.0 mph (gale force) or higher. The March 27, 1963 windstorm ranked as a moderate windstorm. Moderate windstorms have an average of 45.0 to 54.9, and major windstorms are those that reach or exceed 55.0. Only a handful of storms have made the majors, including December 12, 1995, November 14, 1981 and October 12, 1962. This ranking favors those cyclones that follow a northward path close to the U.S. Pacific Coast, and for good reason--such storms affect the largest land area, and therefore are potentially the most destructive. The March 27, 1963 cyclone's eastward path near the Columbia River spared much of Western Washington a severe blow, a feature that lowered the rank of this intense storm. For select regions, such as the Willamette Valley and Oregon's south and central coast, the storm struck particularly hard, and was an event to remember. Sea-Tac's brisk southwesterly winds were accompanied by steady light rain and slightly depressed temperatures which fell from 46° F to 42° over several hours, with a fast rising barometer, all suggestive of the arrival of a modest bent-back occlusion. Source: National Climatic Data Center, undedited surface observation forms. |
| Location | Peak |
Direction |
Obs Time of |
Peak |
Direction |
Obs Time of |
| California: | ||||||
| Arcata | 29 |
S |
13:58 HRS, 27th |
48 |
S |
13:58 HRS, 27th |
| Oregon: | ||||||
| North Bend | 52 |
SSW |
16:55 HRS, 27th |
77 |
SSW |
15:27 HRS, 27th |
| Astoria | 20 |
NNW |
20:36 HRS, 27th |
30 |
NNW |
20:36 HRS, 27th |
| Medford | 29 |
SE |
10:58 HRS, 27th |
40 |
SE |
12:58 HRS, 27th |
| Eugene | 48 |
S |
16:59 HRS, 27th |
75 |
S |
18:16 HRS, 27th |
| Salem | 39 |
S |
17:55 HRS, 27th |
68 |
S |
18:30 HRS, 27th |
| Portland | 41 |
SSW |
20:35 HRS, 27th |
62 |
SSW |
20:35 HRS, 27th |
| Washington: | ||||||
| Tatoosh I. [1] | 30 |
SW |
00:45 HRS, 28th |
39 |
SW |
00:45 HRS, 28th |
| Olympia [2] | 15 |
SW |
23:58 HRS, 27th |
20 |
SW |
23:58 HRS, 27th |
| Sea-Tac | 26 |
SW |
00:27 HRS, 28th |
35 |
SW |
00:27 HRS, 28th |
| Bellingham [3] | 17 |
SE |
10:58 HRS, 27th |
21 |
S |
16:58 HRS, 27th |
| AVERAGE | 31.4 |
SSW |
46.8 |
SSW |
Table 4 Notes: [1] Peak wind of 30 mph at Tatoosh Island is the last of two occurrences, the other having occurred at 23:45 on March 27th. Peak gust extrapolated using a standard 1.3 gust factor. Separating winds from The March 27, 1963 storm and another secondary wave that followed closely on the storm's heels on the 28th is difficult at this location. [2] Peak gust at Olympia is estimated from the peak 1-minute wind of 15 mph using a standard 1.3 gust factor. [3] Peak wind at Bellingham is the last of three occurrences. |
March 27, 1963 Second Strongest Willamette Valley Gale Since 1950? Table 5, below, compares the maximum winds measured at Eugene, Salem and Portland for the strongest storms of the 1950-to-present era and ranks them according to the 3-station average. Due to high variability around the means, this is a rough ranking. Only the Columbus Day Storm stands out significantly among the storms on this list. Of the other nine, the next four (ranks 2 to 5) are so close in their averages that they are essentially the same in strength--their averages cluster around 67.0. These can be considered the standard major windstorm for the Willamette Valley, with peak gusts generally falling between 60 and 80 mph at stations throughout the region. The return frequency for these big events is about once every ten years--in essence they represent the "storm of the decade." It is interesting, but perhaps not significant, that three storm-of-the-decade events happened in the 5-year span from 1962 to 1967. The final five storms (ranks 6 to 10) are also too close in their averages to be certain about their exact rankings--their averages cluster around 60.7. Eleven and twelve (04DEC1951 and 26MAR1971 respectively) have ranks in the range of 59, and can probably be grouped with these low 60s events. These storms can be consdered the standard strong windstorm for the Willamette Valley, with peak gusts generally ranging from 50 to 65 mph. They have a return period of about every 7 years. Note that there have been at least 21 events with a rank of 50.0 and above since 1950. As of 2003, that's an average return period of about once every 2.5 years for windstorms of moderate strength and higher. The Columbus Day Storm's significantly higher rank--35.0 points above the next strongest storm--is an indicator of a truly unique windstorm. There have been no other events like the 1962 storm in the 1950-to-present era, despite the fact that many big cyclones tend to produce peak gusts that cluster around specific ranges, like 67 and 61 mph. This is one of the reasons why I maintain that the Big Blow of 1962 should be put in its own category, especially when trying to determine peak gust potential from a new incoming cyclone. |
Top Ten Willamette Valley Windstorms since 1950 (3-Station Ranking) | |||||
Rank |
Date of Storm |
Peak Gust |
Peak Gust |
Peak Gust |
Average |
1 |
12OCT1962 |
86 |
90 |
104 |
93.3 |
2 |
27MAR1963 |
75 |
68 |
62 |
68.3 |
3 |
02OCT1967 |
58 |
68 |
78 |
68.0 |
4 |
14NOV1981 |
58 |
71 |
71 |
66.7 |
5 |
07JAN1961 |
81 |
60 |
55 |
65.3 |
6 |
01MAR1974 |
60 |
61 |
64 |
61.7 |
7 |
12DEC1995 |
49 |
59 |
74 |
60.7 |
8 |
07JAN1990 |
58 |
61 |
63 |
60.7 |
9 |
24FEB1958 |
62 |
58 |
61 |
60.3 |
10 |
22DEC1955 |
63 |
56 |
62 |
60.3 |
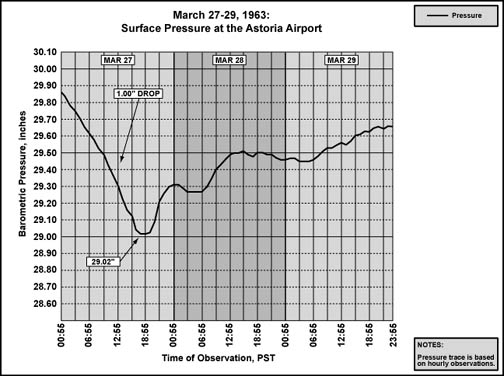
Storm Data Discussion Tables 1 through 5 show some striking features for the March 27, 1963 windstorm. There is a concentration of high winds in the Willamette Valley, with gusts up to very damaging levels from Eugene to Portland. Astoria, which typically shows zippy readings during winter storms, has a peak gust much lower than the valley stations, this despite gusts as high as 109 mph at Newport. This kind of peak gust distribution turned up again just five-and-a-half years later, when a strong low dove ashore on October 2, 1967. Comparison of the two events reveals some differences in storm track, despite the strong similarity in the regions affected by damaging winds. Compared to the 1967 cyclone, and probably 1880, the low of 1963 was much broader. Evidence for this exists in Tables 1 and 2. Minimum pressures were fairly uniform, and the barometer ranged from 29.02" at Astoria to 29.09" at Tatoosh Island. These readings are much closer together than the minimums achieved during the 1967 Storm King "Jr.", which ranged from 28.93" at Portland to 29.16" Quillayute. The fairly even minimums in 1963 also reflect a more northerly component to the low's track. The center of the 1963 cyclone passed closer to the stations at the extreme ends of the region than did the eye of the 1967 low. Due to the broader nature of the 1963 storm, maximum pressure gradients, though strong, were not up to the astounding levels that would be achieved in 1967. The EUG-SLE measure was 2.6 millibars (0.08") steeper in 1967, and EUG-PDX 3.8 mb (0.11") tighter. Even with the wide nature of the storm, the peak gradient at EUG-PDX achieved the 8.0 to10.0 mb (0.24" to 0.30") sweet spot for big windstorms in the valley, and helped produce very strong gusts in parts of Western Oregon. The peak of 75 mph at Eugene has not been reached or exceeded in the 39 years up to 2002, though the compact February 7, 2002 South Valley Surprise came close. Gusts of 81 mph at Corvallis on March 27, 1963 haven't been exceeded either, though the squall of April 5, 1972 threw winds up to 76 mph at the station [1]. Like with the Storm King of 1880 [2], cold air followed this low, with high temperatures generally below 50° F on the 28th, and lows into the mid 30s in parts of Western Washington. Indeed, the general cool state of the atmosphere on the 28th contributed to hail and thunderstorm reports on that day. Temperatures, however, did not get cold enough to produce lowland snowfall at any of the major reporting stations. As mentioned earlier, the March 27, 1963 cyclone was closely followed by a second storm that took a more northerly track. The March 28th low moved in so quickly that in the 72-hour pressure trace for Astoria, Figure 2, below, it barely gave the barometer time to rise above 29.30" before initiating a brief fall to 29.27", which is a minor blip for the area. This 978 mb secondary wave produced some fairly strong winds in the morning and afternoon of the 28th, especially over Western Washington. |
|
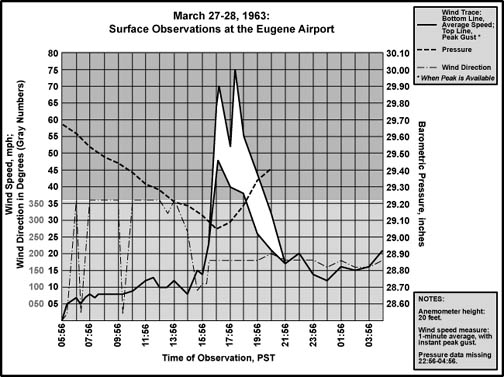
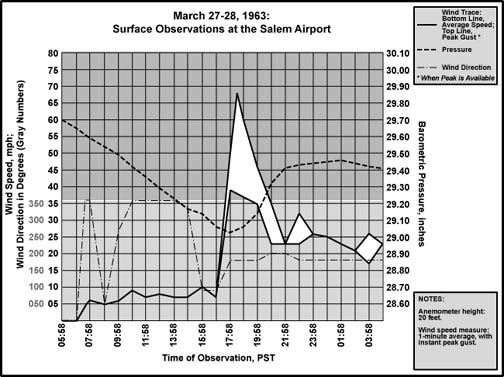
And, as if two windstorms in two days wasn't enough, a strong cold front on March 29th also produced gale-force winds in parts of the region, with thunder and lightning at Eugene and Astoria. Figures 3 through 5, below, are meteograms for Eugene, Salem and Portland, and are included here for those wishing to make comparisons with other storms, especially with the similar event of October 2, 1967. |
|
Roseburg had a gust to 69 mph? Did the World Flip?!? At Roseburg, a community usually spared significantly damaging winds during many windstorm events, winds escalated to SSW 31 mph gusting to 41 by 15:58, and SSW 40 mph gusting to 52 by 16:58. A peak gust of 69 mph was noted as having occurred at 16:35. For Roseburg, the March 27, 1963 gale beat the pants off the Columbus Day Storm, which produced a maximum winds of S 33 mph gusting to 62 on October 12, 1962. The March 27, 1963 event appears to have produced the second highest gust ever measured officially at Roseburg. The highest appears to have occurred during the November 9-10, 1975 windstorm, with a gust reaching 75 mph. Other storms that have produced significant winds in the Garden Valley include the great December 4, 1951 windstorm that yanked a gale from the SW that reached 35 mph gusting to 65 E (E = estimated), the February 24, 1961 Southwest Oregon windstorm which pulled winds of SSW 40 mph gusting to 58 through Roseburg, the February 24, 1958 event generated winds of 29 mph gusting to 49, and the January 7, 1961 windstorm brought peak winds of 37 mph gusting to 46. |
References [1] All data in the Storm Data Discussion section are from the National Climatic Data Center, unedited surface observation forms, unless noted otherwise. [2] For specific citations of the January 9, 1880 Storm King sources, please visit to the web page on the 1880 storm. |
Last Modified: July 30, 2004 You can reach Wolf via e-mail by clicking here. | Back | |