The Intense Cyclone of November 3, 1958 compiled by Wolf Read |
|
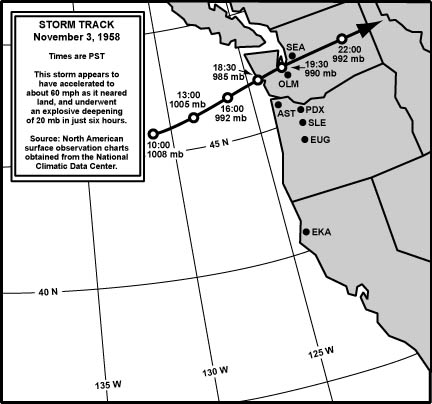
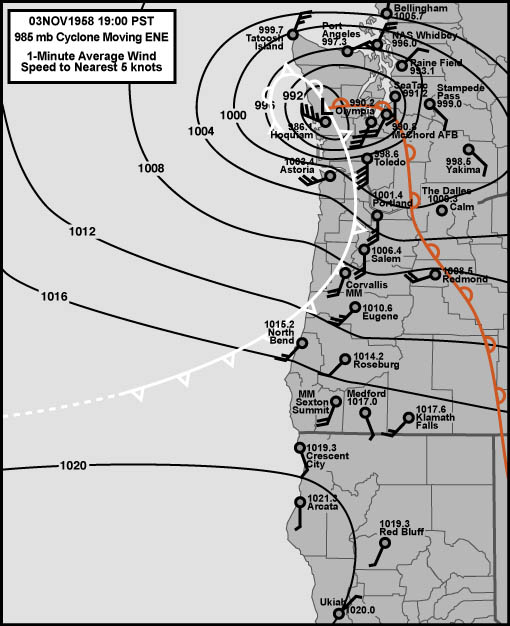
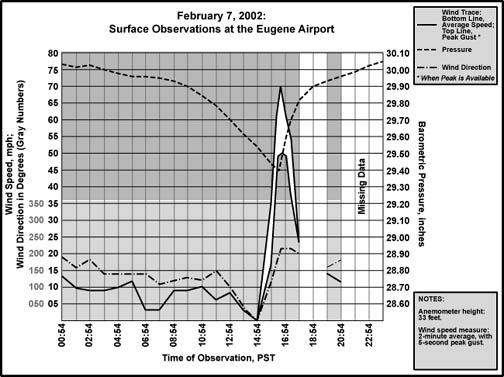
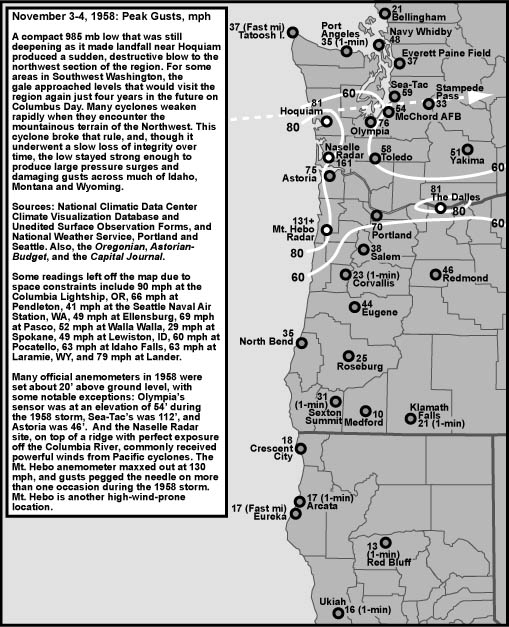
Introduction Weather journalist Walter Rue, in his 1978 book, Weather of the Pacific Coast, considered 1958 to be the "perfect year," at least from a climatological view. With an annual average temperature of 56.2° F, 1958 was the balmiest on record for the Seattle Urban Climatology Station, even up to 2001. This holds true for the Sea-Tac Airport, which had an average temperature of 53.8° F that year. Cold air certainly seemed to have forgotten to visit Seattle in '58, with average thermometer readings for January and December being more akin to a normal March or October. Rue, however, in his assessment of 1958, overlooked at least one deadly tempest that besmudged this banner year. On November 3, 1958, a small, intense 985 mb cyclone landed on the Washington shoreline near Hoquiam at about six-thirty in the evening, and threw a sudden burst of 80 mph winds into the region. Within the next two hours, the low's center, on a steady track just north of due east, passed north of Olympia and onward toward the Seattle-Tacoma area. With rare explosiveness, the cyclone ransacked Washington's capital with unforgiving hurricane-force gusts. A short time later, as the center passed immediately south of the Sea-Tac airport, a raking northwest whole-gale was pulled through the greater Seattle area. The intensity and rapidity with which events unfolded, and the localized nature of the strongest winds in southern Washington and the north fringe of Oregon, puts the 1958 cyclone in a rare category of storms. A similar situation wouldn't arise again until almost exactly 17 years later, when a compact 975 mb low raced ashore right over North Bend, Oregon on November 10, 1975. Then, another 27 years would pass before the surprise 994 mb February 7, 2002 windstorm performed a remarkable logging operation in parts of southwest Oregon. The Columbus Day Storm of 1962, to be certain, had a equivalent impetuousness, but its wicked onslaught befell a much wider region, which puts the Big Blow in a different and most significant category. The 1958 storm appears to have produced one of the strongest positive gradients west-to-east across the Columbia River Gorge since 1950. This resulted in what may be the highest official wind gust recorded at The Dalles--81 mph out of the west. Many cyclones weaken rapidly after they make landfall and encounter the frictional effects of the Pacific Northwest ranges. After quickly loosing about 5-7 mb of depth in Western Washington, the November 3, 1958 storm then proved to be an exception. The storm maintained about 992 mb as it travelled over the Columbia Basin, the Idaho Panhandle, and Montana. Damaging winds of 50 to 80 mph struck many locations in the intermountain empire as the low swirled across the region, accompanied by extreme pressure surges in many instances. Figure 1, below, details the November 3, 1958 storm's track, with central pressures and times noted. Between 13:00 and 18:30, the low underwent explosive deepening, dropping about 20 mb (0.59") in central pressure--about 3 mb (0.09") an hour! The hourly rate was more than enough to be considered a bomb, and with a total drop of at least 23 mb (0.68") in just nine hours, this storm also falls within the standard definition of a bomb at the latitude of 46° to 47°. Cyclones that undergo explosive cyclogenisis immediately off the Pacific Northwest Coast, and continue deepening up to the point of landfall, are a very rare occurrence. These extreme events tend to produce record to near-record wind velocities and barometric tendencies. The November 3, 1958 storm is one of a very few examples of this scenario. The February 7, 2002 South Valley Surprise and November 9-10, 1975 windstorms are two others. During the November 3, 1958 event, an acceleration in overall storm speed to about 60 mph as the cyclone approached landfall probably contributed the powerful effects. Interestingly, the February 7, 2002 event also had a very high overall speed. |
|
General Storm Data Minimum Pressures and Peak Gradients Table 1, below, is a list of the lowest barometric pressures, and time of occurence, for the November 3, 1958 windstorm. With an almost due east track near 47° N, this storm barely touched the southern sector. Places like Arcata, Medford and North Bend witnessed minimum pressures that were near and above sea level averages. In relation, peak winds were not particularly strong in this region. The weather at Arcata was benign, offering no hint of the violence that swept inland over two hundred miles to the north. Further north, however, the storm's affects on barometers became quite pronounced. The steep gradient that set up in the Willamette Valley is quite evident in the strikingly lower pressures from south to north. The same affect can be seen on the coast. This result was due to the strong eastward motion of the storm. Note how pressure minimums coincided fairly well in time along longitude, with coastal stations showing minimums generally around 17:00 to 19:00, and inland stations generally from 18:00 to 20:00, another mark of a low moving almost due east. Contrast the timing of pressure minimums for this storm against one with a strong northward component to its motion, such as the Columbus Day Storm of 1962. Due to the compact nature of the November 3, 1958 cyclone, supplimental stations that were close to the low's path were added below the average line. Hoquiam had, by far, the lowest pressure, suggesting that the low passed closer to this spot than any other with an official barometer. Note how the pressure minimums at Astoria and Tatoosh Island are nearly the same, and that Hoquiam resides almost exactly between these two points. The cyclone's center, it seems, could very well have swept right over Hoquiam. More on this below. Source: Microfilm copies of the unedited surface observation forms, obtained from the National Climatic Data Center. |
|
Table 2, below, is a list of the maximum pressure gradients, and time of occurrence, for the November 3, 1958 windstorm. Some of these gradients are extreme--especially the supplimental ones. The PDX-SEA gradient of +13.6 mb (+0.40") is quite impressive--it's a rare storm that pushes the figure above +13.0 mb (+0.38")--but it has been exceeded by the Inauguration Day Storm of 1993 which had a peak value of +15.4 mb (+0.45"), and the December 12, 1995 windstorm's +15.3 mb (+0.45"). The 1993 and 1995 storms were major events. The 1958 storm's weak affects in the southern region show with a fairly typical +6.8 mb (+0.20") ACV-OTH and +6.4 mb (+0.19") MFR-EUG gradients. The weak AST-TTI gradient is the product of the cyclone passing almost exactly between the two stations. At 17:00, there was almost no difference between the AST-TTI pressures, with a gradient of just +0.3 mb (+0.01"), and this slowly climbed to +3.7 mb (0.11") by 19:00 as the low moved inland. Yet, at 19:00, the AST-HQM gradient had reached an incredible +17.3 mb (+0.51"). With a separation of about 55 miles between the stations, that's 0.31 mb (0.01") per mile! Peak winds of 75 to 81 mph at these stations, and a gust to 90 mph at the Columbia Lightship, reflect on this amazing gradient, one of the steepest in the history of the Pacific Northwest. Considering the results from other storms, its a wonder that the winds weren't stronger. Not even the Columbus Day Storm could match this record--a peak of +10.8 mb (+0.32") happened at 21:00 on Columbus Day of 1962. Nor did the devastating Inauguration Day storm reach such an extreme level, with a peak gradient of +9.0 mb (+0.27") at 09:00 on January 20, 1993. And the great December 12, 1995 windstorm could "only" manage +8.6 mb (+0.25") peak gradient at 19:00. Stretching the gradient further, ACV-HQM, the measure climbs to +35.2 mb (+1.04") at the same hour, 19:00. This stood as a record for 37 years. It took the deep cyclone of December 12, 1995 to break the steep value, and the titanic storm just barely managed it with a value of +35.5 mb (+1.05") at 16:00. Other storms that have produced high ACV-HQM readings include the Columbus Day Storm with +32.8 mb (+0.97") at 20:00 on October 12, 1962, and the Inauguration Day storm with a peak value of +29.8 mb (+0.88") at 08:00 on January 20, 1993. The EUG-OLM reading of +20.4 mb (+0.60") on November 3, 1958 was also exceeded during the great December 12, 1995 storm, which peaked at +20.8 mb (+0.61") at 18:00. The Inauguration Day storm got close, with a peak of +19.1 mb (+0.56") at 09:00 on January 20, 1993, and the Columbus Day Storm +16.5 mb (+0.49") at 20:00 on October 12, 1962. The +8.8 mb (+0.26") reading for the AST-DLS measure during the November 3, 1958 storm marks a rare event. This is the only significant Pacific Northwest windstorm since 1950 to have produced a positive gradient that overpowered the pre-storm arrival negative one (which was -7.5 mb/-0.22" at 17:00). The result was a westerly gale that topped 80 mph at The Dalles, one of the highest wind readings ever at that location. Many of the big windstorms, especially the offshore-trending sou'westers, don't even produce a positive AST-DLS gradient, let alone one that is stronger than the typically steep negative readings that occur ahead of these storms. Another example of the sharp east-west gradients for the 1958 storm--and its high rate of eastward motion--was a peak HQM-OLM gradient of -7.4 mb (-0.22") at 18:00 that rapidly switched to +7.4 mb just two hours later! Source: Microfilm copies of the unedited surface observation forms, obtained from the National Climatic Data Center. |
|
Table 2 Notes: [1] AST-TTI gradients at 17:00 and 18:00 were +0.3 mb and +1.7 mb respectively. [2] MFR-EUG gradient of +6.4 mb last of two occurrences, the other of which happened at 17:00 HRS. [3] TDO-OLM gradient of +8.4 mb last of two occurrences, the other of which happened the hour before. |
Pressure Tendencies The November 3, 1958 windstorm brought with it a major "pressure couplet" over much of Southwestern Washington and extreme Northwest Oregon, with strong hourly pressure declensions and surges (-/+3.0 mb and higher) at stations that happened to be within about 100 miles of the storm's center. Table 3, below, shows the maximum hourly changes in pressure for eleven key stations in the Pacific Northwest. There's a number of remarkable figures in these pressure tendencies. With -6.1 mb (-0.18") an hour drops, both Sea-Tac and Olympia witnessed the strongest hourly pressure declensions in their station histories. The next closest peak hourly drop for Olympia was -5.4 mb (-0.16") witnessed during the Columbus Day Storm, and for Sea-Tac is was a fall of -5.1 mb (-0.15") during the arrival of the December 21, 1955 windstorm. Olympia's extraordinary pressure drop during the November 3, 1958 windstorm is overshadowed by the astounding +9.8 mb (+0.29") surge that followed. The next closest peak hourly climb was +7.0 mb (0.21") during the Inauguration Day Storm of 1993. Three hourly tendencies during the November 3, 1958 storm are also quite bold. Olympia witnessed a -13.9 mb (-0.41") three-hour drop between 15:00 and 18:00, with a surge of +14.9 mb (+0.44") between 20:00 and 23:00. At Sea-Tac, the three hour tendencies were -14.9 mb (-0.44") between 15:00 and 18:00 and +14.2 mb (+0.42") between 20:00 and 23:00. As incredible as the pressure tendencies were at Olympia and Sea-Tac, they paled next to the barometric swings at Hoquiam. Out of the eleven regular stations in this study, the one-hour drop of -7.1 mb (-0.21") has only been exceeded by the November 9-10, 1975 windstorm, which produced a -7.7 mb (-0.23") hourly fall at North Bend, OR. The next closest event was a -6.7 mb (-0.20") plummet at Quillayute before the March 3, 1999 windstorm. The +13.9 mb (+0.41") surge at Hoquiam in 1958--on par with a strong hurricane--was the Pacific Northwest record until the November 9-10, 1975 windstorm shattered it with a +16.6 mb (+0.49") surge at North Bend, OR. The February 7, 2002 South Valley Surprise also exceeded the November 3, 1958 windstorm's maximum pressure climb with a surge of +14.2 mb (+0.42") in a single hour--this also happening at North Bend. The tendencies at Hoquiam, coupled with the fairly low minimum of 29.09" (985.1 mb), are the signature of a cyclone with an intensity that rarely visits the Northwest. The pathetic pressure changes at the southern stations is another indication of a low that barely even noticed the southlands. Source: Microfilm copies of the unedited surface observation forms, obtained from the National Climatic Data Center. |
| |||||||||||||||||||||||||||||||||||||||||||||||||||||||||||||||||||||||||||||||||||||||||||||||||||||||||||||||||||||||||||||
Table 3 Notes: [1] The +0.7 mb hourly climb at Arcata is the last of two occurrences, the other instance having occurred the hour before. [2] The -2.1 mb hourly fall at Salem is the last of two occurrences, the other instance having occurred during the hour ending at 13:00. The +2.4 mb hourly climb is the also last of two occurrences, the other instance having occurred during the hour ending at 21:00. |
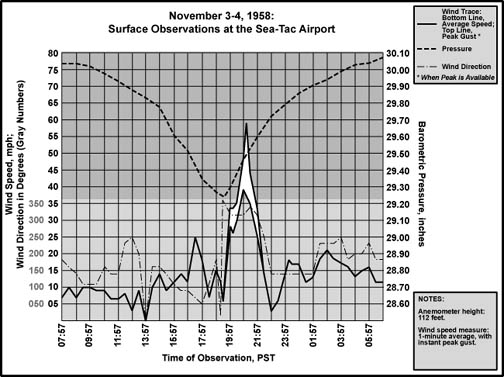
Peak Wind and Gust Table 4, below, lists the peak wind and gust for eleven key stations in the Pacific Northwest, their direction, and their time of occurrence. Data from five additional stations is provided for more insight into the intense November 3, 1958 windstorm. The storm was so compact that the resolution of the eleven standard stations missed some of the important details about this event. "Peak Wind" is a 1-minute average, and "Peak Gust" is an instant (approximately 1-second) average. By my own personal methodology, a wind event rates the term "windstorm" when the average peak gust of these eleven stations reaches 39.0 mph (gale force) or higher. The November 3, 1958 windstorm ranked as a low-end moderate windstorm. Moderate windstorms have an average of 45.0 to 54.9, and major windstorms are those that reach or exceed 55.0. Only a handful of storms have made the majors, including December 12, 1995, November 14, 1981 and October 12, 1962. This ranking favors those cyclones that follow a northward path close to the U.S. Pacific Coast, and for good reason--such storms affect the largest land area, and therefore are potentially the most destructive. The November 3, 1958 cyclone's eastward trail was about 90° removed from the ideal track for a high ranking. The storm's path through the middle of Washington, and its compact nature, spared many southern sector stations damaging winds. Most stations that ended up north of the low's centerline, such as Bellingham and Tatoosh Island, were also spared destructive winds. This brought down the storm's average peak gust ranking, and, in a way, masks the cyclone's true grandeur. A look at Olympia reveals what a powerful, compact low can deliver. The sustained winds of 60 mph with gusts to 76 were the highest on record at Olympia up to the date of the storm. These winds were also quite a good match for the 58 mph gusting to 78 that the Columbus Day Storm would deliver just four years later. However, differences in anemometer location complicate this comparison. There's more on this, and some of the other wind readings examined in this brief discussion, in the Storm Data Discussion below. Like Olympia, the 52 mph gusting to 81 at Hoquiam is quite comparable to the 48 mph gusting to 81 that Columbus Day Storm would deliver. The November 3, 1958 blast at Hoquiam was probably the highest the region had endured since a sustained 90 mph gale tore apart downtown Aberdeen and Hoquiam on October 21, 1934. The high wind winner from the table is The Dalles, which hit an astonishing 60 mph gusting to 81 late at night, after the storm had passed to the northeast and east-to-west pressure gradients had switched to strongly positive. Since 1950, this is the highest wind and gust measured at The Dalles during the close passage of a cyclone. The November 3, 1958 cyclone had such good gradients both north and south of the track that the storm's path through Washington can be quickly ascertained by its effects on the direction of the peak gusts. Tatoosh Island, Bellingham, Everett, and Sea-Tac had a strong WSW to NW signature in the peak winds--the mark of a low center passing south of these stations. Hoquiam, Olympia, Toledo, McChord AFB and Portland show a strong tendency for SW to S peaks, all the mark of a low passing north of these stations. Note that the distance between Sea-Tac and McChord isn't that great--the cyclone's center just squeaked between these two points. Sea-Tac's peak gust of 59 mph is probably the highest such instance from a northwest direction on record. However, a 112' anemometer height probably contributed to the high reading. Source: National Climatic Data Center, undedited surface observation forms. |
| Location | Peak |
Direction |
Obs Time of |
Peak |
Direction |
Obs Time of |
| California: | ||||||
| Arcata [1] | 17 |
SSW |
17:58 HRS, 3rd |
22 |
SSW |
17:58 HRS, 3rd |
| Oregon: | ||||||
| North Bend | 21 |
SW |
20:58 HRS, 3rd |
35 |
SW |
15:20 HRS, 3rd |
| Astoria [2] | 38 |
WSW |
17:58 HRS, 3rd |
75 |
S |
17:28 HRS, 3rd |
| Medford [3] | 10 |
S |
19:58 HRS, 3rd |
13 |
S |
19:58 HRS, 3rd |
| Eugene | 26 |
SW |
18:58 HRS, 3rd |
44 |
SW |
18:18 HRS, 3rd |
| Salem | 30 |
SSW |
19:58 HRS, 3rd |
38 |
SSW |
19:58 HRS, 3rd |
| Portland [4] | 33 |
S |
18:14 HRS, 2nd |
70 |
SW |
19:18 HRS, 3rd |
| Washington: | ||||||
| Tatoosh I. [5] | 33 |
NW |
20:51 HRS, 3rd |
43 |
NW |
20:51 HRS, 3rd |
| Olympia | 60 |
S |
19:05 HRS, 3rd |
76 |
S |
17:05 HRS, 3rd |
| Sea-Tac | 39 |
NW |
20:57 HRS, 3rd |
59 |
NW |
21:15 HRS, 3rd |
| Bellingham [6] | 16 |
WSW |
22:58 HRS, 3rd |
21 |
WSW |
22:58 HRS, 3rd |
| AVERAGE | 29.4 |
SW |
45.1 |
SW |
||
| Supplemental Data: | ||||||
| Oregon: | ||||||
| The Dalles | 60 |
WNW |
22:58 HRS, 3rd |
81 |
WNW |
22:46 HRS, 3rd |
| Washington: | ||||||
| Hoquiam | 52 |
SSW |
17:58 HRS, 3rd |
81 |
S |
17:26 HRS, 3rd |
| Toledo | 46 |
SW |
18:58 HRS, 3rd |
58 |
SW |
18:58 HRS, 3rd |
| McChord [7] | 32 |
SSW |
20:04 HRS, 3rd |
54 |
SSW |
19:32 HRS, 3rd |
| Everett, Paine [8] | 23 |
WNW |
19:44 HRS, 3rd |
37 |
NW |
21:01 HRS, 3rd |
Table 4 Notes: [1] Winds were too low for gust to be noted at Arcata, and peak gust is extrapolated from peak 1-minute wind by using a standard 1.3 gust factor. [2] Peak gusts at Astoria also include 60 mph at 16:08, 69 mph at 16:44, and 72 mph at 17:05. [3] Winds were too low for gust to be noted at Medford, and peak gust is extrapolated from peak 1-minute wind by using a standard 1.3 gust factor. [4] Peak gust of 70 mph at Portland is from a rooftop sensor. Peak gust from field sensor apparently was 54 mph at 19:17, which was close to the time of the peak fastest mile of 47 mph at 19:15. [5] Gust not noted at Tatoosh Island in the 1958 timeframe, and peak gust is extrapolated from peak 1-minute wind by using a standard 1.3 gust factor. [6] Peak gust of 21 mph at Bellingham is the last of two occurrences. The other instance was at 18:58 from a north direction. [7] Peak wind of 32 mph at McChord AFB is the last of two occurrences. The other instance was at 19:55 from a south-southwest direction. [8] Peak wind of 23 mph and peak gust of 37 mph are the last of several occurrences of each. |
|
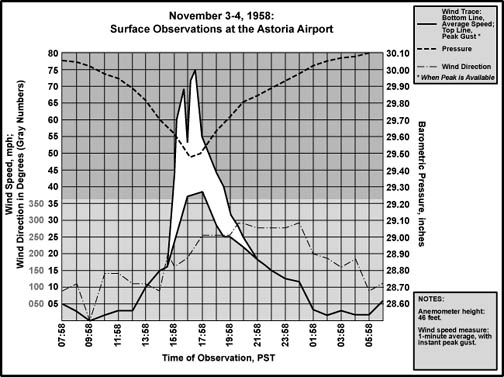
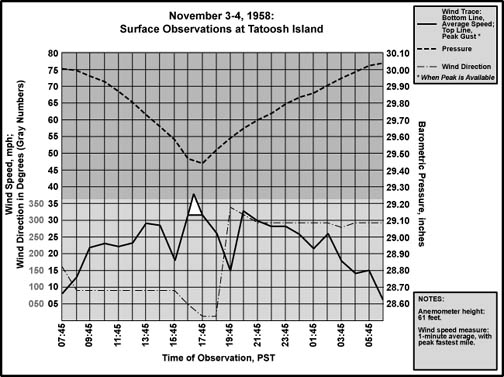
Storm Data Discussion As Table 4, above, shows, the most powerful winds were confined to Astoria and Olympia for the eleven key stations [1]. Of the additional stations, both Hoquiam and The Dalles received some of the highest gusts in the storm--for anemometers not located on mountain tops. Portland and Sea-Tac were trounced with some severe gusts, but average speeds were markedly lower. With brief gusts to 76 mph at Olympia at 19:05, and 70 mph on a Portland rooftop sensor at 19:18, strong winds of 50 to 70 mph probably rampaged across most of southwest Washington at this time. This is further supported by peak gusts to 58 mph at Toledo, Washington. The compact nature of this storm is evident in the dramatically weaker effects south of about a Portland-Astoria line. Pressure rates-of-change, absolute declension, and peak wind speeds quickly reduced southward from this fuzzy boundary. Readings in the range of Salem's peak gust, 38 mph, typically happen several times during a storm season. Far to the south, Arcata had a nice, gentle afternoon and evening, with refreshing rain and mild breezes. Areas a short distance north of the storm's track, like Tatoosh Island and Paine Field in Everett, received a moderate northwest gale as the low tracked eastward. Further north, like at Bellingham, the effects are sharply reduced. For places immediately north of the centerline, such as Sea-Tac Airport, the northwest surge hit with damaging force. The cyclone's path in Figure 1, far above, is partly extrapolated from the surface observations from stations that shown in Table 4. Nature is loath to provide perfect examples of her work. The record for 1958 has one of the rare exceptions. The cyclone passed almost exactly between Astoria (AST) and Tatoosh Island (TTI), judging from pressure minimums that were nearly equal within the same timeframe for both stations. This offers a rare, clean, real-world example of the dramatic differences that take place on either side of a low's track. (Maybe 1958 was the perfect year, as here's the perfect st . . . I won't say it!) As it turns out, Olympia and Sea-Tac would also offer a similar dataset--this time for inland stations that ended up quite close to the storm's center. Figures 2 and 3, below, wind and barometer traces for AST and TTI, are shown one above the other for ease of examination. The pressure trends literally match up, both in magnitude and absolute time, indicating near-equal distance from the low center, which strongly suggests a track almost due east. Pressure minimums up and down the west coast and interioir fell within 1-3 hours of each other, a fairly uniform mix, further supporting the eastward track of this low. At AST, after a period of calm, the winds started from the southeast, then shifted east as the low center neared. With a shift to a southerly direction, the winds quickly jumped to gale force, and reached a peak 1-minute velocity of 39 mph with brief gusts to 75. The low had reached its closest point--the center was now due north of Astoria, near Hoquiam (more on Hoquiam later). As the cyclone moved eastward into Astoria's northeast side, the pressure rose sharply, and winds shifted to the southwest, then west, with a quick drop in speed. This is the classic pattern of a station south of a low's track. Note that Astoria's most extreme conditions occurred near the storm's cold frontal boundary that passed through around 17:28. TTI, being north of the low, didn't receive this violent gift. During the pre-landfall period, TTI showed a steady east wind of 20 to 30 mph with sharply decreasing pressure. As the low reached shore, the pressure fall slowed, and the airflow shifted to the northeast, then north-northeast, and peaked, with an average 1-minute speed of 32 mph and a fastest mile of 37. As the cyclone moved to Tatoosh Island's southeast side, with the pressure climbing fast and steady, the wind shifted to the north, then northwest in a textbook pattern for a station north of a cyclone's track. The AST and TTI figures approximately match those depicted for Portland and Eugene in Figure 6 on the Pressure Gradients webpage. |
|
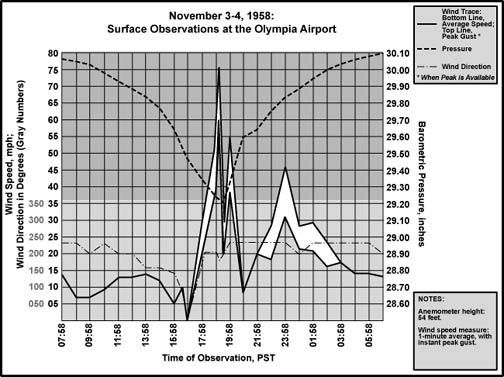
| Moving inland, the low's position can be pinpointed more closely by examining the meteograms for Olympia (OLM) and Sea-Tac Airport (SEA), shown in Figures 4 and 5, below. Study of the wind direction traces for these stations clearly shows that the low passed south of SEA (winds went northwest after the center passed), and north of OLM (winds went south and then southwest as the center passed). The big difference between the inland and coastal stations is that the two inland locations are much closer together--only about 40 straight-line miles separates Olympia airport from Sea-Tac, whereas the distance between AST and TTI is about 150 miles. This means that, ultimately, the low center had to pass much more closely to OLM and SEA to go between them than it did TTI and AST. This clearly happened: the barometers dropped much lower at the inland stations, 29.21" and 29.24" at OLM and SEA, compared to 29.45" and 29.48" at TTI and AST. OLM and SEA are not as closely aligned on a north-south axis as are AST and TTI, with SEA to the northeast of OLM. With the storm moving at about 60 mph, this would offset the timing of events by about 25 minutes between OLM and SEA, assuming a perfectly symmetrical storm system, which the November 3, 1958 storm wasn't. |
|
|
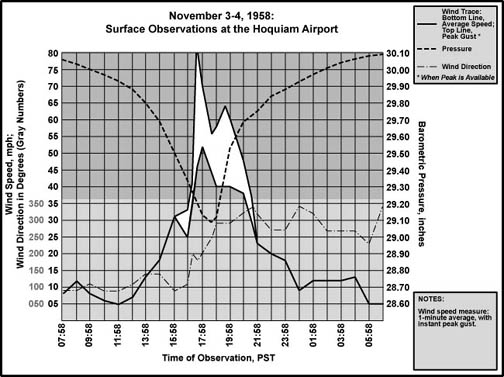
The speed of the cyclone is based on the fact that the pressure minimum for Hoquiam (HQM) happened at 18:40, which is about 45 minutes ahead of the inferred OLM minimum at 19:25, and 55 minutes ahead of SEA's minimum at 19:35. The distance between the HQM and OLM airports is 47 straight-line miles. A velocity of about 62 mph is required to cover the distance in the given time period. The straight-line distance between the longitudes of OLM and SEA is about 25 miles, which would require about 25 minutes to cover, hence the 25-minute offset in timing between OLM and SEA. The storm's central pressure was most likely changing as it moved inland, and this complicates the timing somewhat. It appears that the cyclone was still intensifying as it came ashore over HQM, and then the center started to fill after landfall. Interestingly, the minimum pressure for HQM in the hourly reports happened about two hours behind AST, despite the two locations being literally on the same longitude line. It appears that Astoria's low happened with the arrival of the frontal boundary (FROPA), which was at 17:28. Frontal passage at Hoquiam happened at almost the same time, 17:30, but unlike AST, pressures continued to drop behind the front as the low's center raced directly toward the station. Also, it is hard to consider the frontal passage noted at HQM as the same boundary that crossed AST, as the temperature climbed from 43° F to at least 55° after the HQM "FROPA" was noted (marked by a wind shift). At AST, temperatures fell from 57° to 52° after FROPA was noted. It appears that there were two fronts, as is typical of these storms, with a warm front leading the cold. At AST, between 14:58 and 16:58, the temperature jumped from 46° F to 57° with a shift in the wind from east to south-southeast. South winds started escalating fast at AST after this. The noted FROPA at HQM, I maintain, coincides with this warm frontal boundary that crossed AST, which about two hours before HQM. The cold front appears to have struck HQM right around pressure minimum (like AST), which was 18:40, with the low center moving almost due north of the station, and was marked with a wind shift to the west-northwest. Getting back to Figures 4 and 5, above, the extreme triple spike in wind at Olympia can be interpreted in a similar manner. The storm's warm front tore through OLM between 16:58 and 17:58, with a change in wind from calm to south-southwest and escalating. The temperature rose from 45° F to 51°, then 55° in the next hour as the winds continued to intensify. Thus, the high winds began with warm frontal passage. OLM's high temp of 57° F apparently happened south winds at their maximum (19:05), then, after a wind shift toward an increasingly southwest direction around 19:30 (with FROPA noted), the wind decreased markedly, and the temperature soon started to fall--to 45° by 20:58. The cold front had arrived. The final surge of wind around midnight appears to be due to one of two things: the arrival of the cyclone's bent-back occlusion (front #3 for OLM), or the esablishment of a decent southwest gradient behind the low that yanked a gale through the Chehalis Gap. I'm more inclined to go with the latter explanation, as I've seen it happen a number of times. It's possible that, like with Eugene on February 7, 2002, the cold frontal passage at OLM was actually the arrival of an intense bent-back occlusion. In terms of the arrival of the second wind-spike on OLM's pressure curve, it times very well with the peak wind period for Sea-Tac. The maximum winds, out of the northwest, at SEA after pressure minimum is almost surely the signature of the storm's bent-back occlusion. With gusts approaching 60 mph at 112 feet above ground level, it was a fairly intense one. SEA's temperautre trace does not show the extreme changes seen at AST, HQM and OLM. About an hour ahead of the northwest whole-gale at SEA, and just before the barometer reached minimum, a brief southerly wind picked up to about 15 mph. According to the records for that time period, the temperature jumped slightly from 45° F to 47° with the onset of those southerly winds. It seems that Sea-Tac was brushed with the extreme tip of the warm air advection field (warm front) that had wrapped around the northeast quadrant of the low, which is another piece of evidence that places the station very close to the center. On the scale of the big synoptic systems, Sea-Tac was a hair's breadth away from getting lashed with the warm temperatures and hurricane gusts recorded at Olympia! Instead, the temperature dropped to 44° F as the northwest winds tore through the station. Returning to the coast, the best estimate for a landfall is between Westport and Oyhut, Washington, at about 18:30, with a track slightly north of due east. Most likely the center tracked right over Open Shores. This path puts the low's eye literally on top of HQM. The surface observations at HQM provides an excellent opportunity to see what happens near a cyclone's center before it starts degrading after landfall. Figure 6, below, is the meteogram for HQM. Several unique features are present in this data. As the low raced towards the Grays Harbor area, the barometer exhibited a plunge that was unprecedented for the day--and is one of the fastest long-duration falls in the official Pacific Northwest record during the 1950-2002 time period. Starting with the 14:58 observation, the barometer plunged 3.7 to 7.1 mb (0.11" to 0.21") an hour for four consecutive time periods, for a total of 22.7 mb (0.67"). Winds light and easterly escalated into the 18-33 mph range during this barometric dive bomb. In the last hour, which had the whopping pressure declension of 7.1 mb (0.21"), the unsettled breeze suddenly shifted from easterly to southerly, and shot through the top of the chart, with a peak gust of 81 mph. At this stage, HQM was probably on the immediate southeast side of the cyclone's eye, in a region with the pressure fields beginning to orient on a north-south axis. One befuddling event during this time period is that HQM's temperatures had not started to climb with these strong south winds--in fact, the temp dropped a degree. This is unusual because usually the strong south winds do not begin until after the passage of a storm's warm front. The warm air would arrive at HQM, but not until after this intense high-wind period. At the 17:58 observation, with sustained winds of 52 mph gusting to a thundering 69 over the runways and hangars (and a temp of 43° F), the AST-HQM pressure gradient had climbed to 12.5 mb (0.37")--averaged over the 55 miles between the two stations, that value converts to 0.23 mb (0.007") a mile, an incredibly steep slope the likes of which has only turned up a few times in the record. And this wasn't the peak gradient on November 3, 1958. |
|
| During the hour 17:58 to 18:58, the barometer at HQM reached its low point of 29.09" (985.1 mb), and began to climb. The temperature went up as well, to 55° F--the warm front had passed. However, so close to the low's center, the cold front must have been right on the warm front's heels, and this is where some interpretation is required, as, unfortunately, temperatures were not noted in the special reports. Events unfolded so rapidly during this storm that the hourly resolution of the data missed some details. HQM's high temperature is indicated as having been 58° F between 15:55 and 21:55. Since the only warm period in that time frame appears to have been due to the passage of the storm's warm front, and the temperature had fallen to 53° F with the next observation (19:58), the high temp of 58° is placed before the 55° F noted at 18:58. This puts the high between 17:58 and 18:58, the time period that contains the storm's pressure minimum, which happened at 18:40. Winds at 18:40 were west-southwest, a direction typical of a post cold-front situation. Thus, it seems that the peak temperature arrived between 17:58 and 18:40--in other words, the warm front arrived after 17:58, elevated temperatures from 43° F to 58° with south to south-southwest winds, and then the cold front arrived with more westerly winds right around 18:40, and temperatures started to fall. This is one of a few interpretations of events during a very complex situation at HQM. It is favored mainly due to the wind direction notations in the regular and special reports. |
|
With a pressure at 29.13" at 18:58, the maximum gradient between AST and HQM was achieved: 17.3 mb (0.51"), which represents a slope of 0.31 mb (0.01") a mile! This can be seen as a series of very closely packed isobars in Figure 7, above, which is an interpretation of available surface data, including North American surface charts [2]. This gradient value appears nearly unmatched in the windstorm record, though the November 10, 1975 and February 7, 2002 South Valley Surprise packed isobars similarly over Southwest Oregon. In a contradictory manner, at Hoquiam in 1958, there was a moderate slowdown in wind velocity during the maximum gradient, with peaks ranging into the mid-to-upper 50s. Apparently due to the arrival of the bent-back occlusion during the hour 18:58-19:58, the wind's direction changed to the west-northwest (eventually northwest)--the gradient orientation, stacked south-to-north, wasn't good for an ageostrophic (jumping-the-gradient) surge of wind from a west-northwest direction. The low's midpoint had moved to the east, which put HQM at the extreme upper-end of the storm's southwest quadrant (in other terms, the middle of the western half). After a slow rise for about 20 minutes, boom, the pressure literally exploded upward and covered 13.9 mb (0.41") during this single hour. For the entire Northwest, this rate of climb is almost unmatched in the 1950-2002 time period--not even the great Columbus Day Storm would produce such a fast escalation (more on this below). Only the South Valley windstorm has exceeded this value, with a 14.2 mb (0.42") one-hour rise at North Bend, Oregon, some 44 years after the November 3, 1958 cyclone. Returning to HQM, west-northwest winds peaked at 40 mph gusting to 60 during this barometric climbout, not too different from what would be experienced at SEA within the next hour. As the cyclone raced ever eastward, the rate of pressure climb slowed, and winds diminished to 23 mph four hours later. For an Easterner, the meteogram for HQM might have a familiar air about it. It is very close to the profile of a hurricane. The sharply pointed barographic trace, quick onset of a whole gale during the time of maximum pressure descent, and wide shift in wind direction from east to south to west as the storm's center passed, all have the flavor of a hurricane. The temperature even climbed 15° F, from 43° to 58° as the barometer marked the storm's low point. Hurricanes are one of the banner symbols of extreme weather. The cyclone of November 3, 1958 is one of many demonstrations that the Pacific Northwest is struck by truly dangerous storms--a huge blemish in that commonly held notion that the Northwest is a garden spot free from powerful weather events. The notion is wrong. And this storm shatters the deception with a strong shot of reality. As indicated in the above discussion, Hoquiam's temperature record shows some nice features. Figure 8, below, plots the temperature and dew point next to pressure. There's a sharp drop from 50° F to 43° during the rapid pressure declension phase ahead of the storm. Initially the fall started with the pre-storm easterly winds, making for a somewhat drier atmosphere as indicated by lower dew points. Light rain had started at 11:58, right at initial temperature maximum. The atmosphere was probably being cooled by the precipitation as it evaporated in the relatively dry conditions. By 16:58, temperature and dew point had matched. Within the next half-hour, the wind shifted more southward and escalated to maximum values. The temperature didn't rise despite the south winds of 46 mph gusting to 81, and it reached minimum at 17:58. In the next hour, with winds shifting to the west-northwest, the temperature did its sudden jump to 55° F. As mentioned earlier, the maximum temperature for the day noted on the surface observation form is 58° F. No time is given for this occurrence, but it's a good bet that it happened before the 55° reading at 18:58, and after the 43° reading at 17:58. It may have occurred around the barometric minimum, which was at 18:40. This is a strange pattern, as the maximum temperatures were achieved after maximum winds. Usually, highest temperatures are achieved in the warm air advection field ahead of the cyclone's cold frontal system, when winds tend to be southeasterly to southerly and at their fastest. As noted, the maximum southerly winds happened without a temperature climb! There are several possible explanations for the seemingly backwards conditions at HQM. Maybe the interpretation of events in the paragraphs above are correct. Maybe the location was struck by a wrap-around segment of the warm air advection field. Maybe a new field of warm air was being entrained behind the low just ahead of the bent-back occlusion. Or, as crazy as this may sound, this system may have simply had a warm core, relative to its surroundings, in a manner not dissimilar to a hurricane. |
|
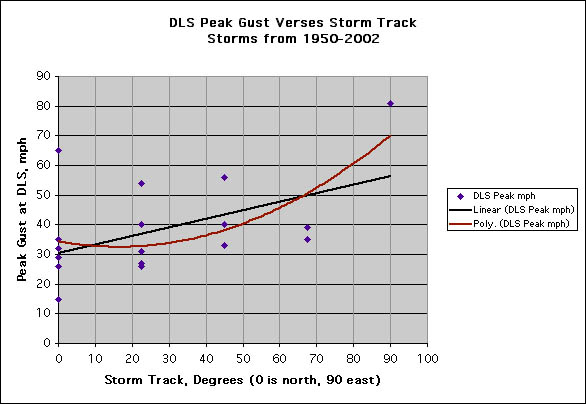
A warm center for the 1958 cyclone may not be as far-fetched as it sounds. As it turns out, there's a high latitude storm called an "arctic hurricane," or "polar low," that exhibits a warm core relative to its surroundings (temps are quite cold in these storms!) [3]. With warm core systems developing both in the high arctic, and near the equator, it seems that maybe, under the right conditions, something akin to polar lows might develop in the midlatitudes. The year 1958 was visited by strong El Nino warming of the ocean--maybe with warmer seas along the west coast, just such a storm could develop, possibly triggered by a strong surge of cold relatively dry air pouring out of the Alaska region, which would make for a strong difference in temperature between the ocean's surface and the cold air mass, providing the ingredients for a storm fed by the latent heat flux from the ocean. Hoquiam's winds and barometer show a remarkable similarity to a hurricane. The sudden drop in temperature ahead of the storm is quite unlike a hurricane--however, it seems to be a modification due to terrain (dry, easterly winds, and evaporational cooling). Far out to sea, this cooling may not have occurred. Supporting this idea of a warm core for the November 1958 storm is the fact that the dew point rose sharply along with the temperature, which is what tends to happen in hurricanes. Often, when temperatures spike upward during the high-southerly-wind-phase of Pacific Northwest windstorms, the dew point doesn't respond much--it's stays the same, or even drops. A rise in temperature accompanied by stable or lowering dew points is evidence of descending air. A parcel pulled down from above will warm as it is compressed, and, being initially cooler it will start with a low dew point. As the air descends, it will become dry, relatively speaking, as it warms for the dew point won't change much from its initial starting point. Frontal boundaries are often accompanied by strong upward and downward currents, and often provide the kind of instability required to move air down from high above. Now, when the dew point rises in near lock-step with the temperature during a Northwest storm, the warmth is probably not due to descending air. But it also doesn't prove a hurricane-like origin. The very moist air indicated by a high dew point is likely the mark of a true warm advection field--warm air from the south being sucked northward toward the low pressure center. Again, that strong El Nino may have played a role, providing plenty of warm ocean to the south in which to support a warm, moist airmass. So, it would seem that the November 3, 1958 low had a strong connection to some modified tropical air, and this juicy tongue wrapped in very close to the core. In any event, a warm-core system is just a wild proposal. As is evident, the 1958 storm has been treated as a classic cyclone with frontal systems and a cold core, as will be done so for the remainder of this discussion. The northwest winds that struck Sea-Tac, which reached a peak velocity of 39 mph gusting to 59, are probably among the highest ever recorded at the airport from that direction. As mentioned, some of this is likely due to the station's close encounter with the low center. However, part of the high velocity can be attributed to the 112-foot height of the anemometer in 1958 [4]. The sensor would eventually be moved from the administration building to the field site and lowered to 20 feet on November 21, 1959. The wind-speed power law formula applied to this difference in elevation reduces the winds to 30 mph gusting to 46, which is still pretty fast for a northwest direction. In support of the idea that the peak winds at SEA were unusually strong, the gale at the Seattle Urban Climatology station, located many miles north of the airport in the downtown Federal Office Building on First and Marion, reached a maximum velocity of 48 mph on November 3, 1958. This anemometer was on the rooftop at a whopping height of 321 feet, a far greater reach than Sea-Tac's 112 feet, which suggests a significantly lower velocity in Seattle's heart. Using the power of 1/2, instead of 1/7, which is appropriate for the rough topography of downtowns, 48 mph at 321 feet adjusts to 28 mph at 112 feet. However, the change in the power value demonstrates the fact that a high density of tall edifices tends to reduce wind velocity (save for those human-built canyons that happen to channel the wind), and this could have contributed to a lower wind speed at the Federal Building site. Olympia's sudden burst of winds up to hurricane force, among the most extreme interior wind-speed records in Pacific Northwest history, merits some close scrutiny. The great Columbus Day Storm of 1962 produced a peak 1-minute average of 58 mph with a gust to 78, quite comparable to the 1958 storm's 60 mph gusting to 76. However, on April 16, 1959, the anemometer was lowered from 54 feet to 20. This is a vital difference in instrument height between the two storms. Again employing the wind-speed power law formula, Olympia's fastest 1-minute velocity at 20 feet is reduced to 52 mph. And the 76 mph burst at the 1958 sensor height reduces to 66 mph for the 1962 height, putting both the average wind and peak gust on November 3, 1958 markedly below the Big Blow. The calculations can be done in reverse for the Columbus Day Storm: had the anemometer been at 54 feet in 1962, then the winds may have registered as high as 67 mph gusting to 90! Incidentially, using the power law formula on wind gusts is a very rough approximation at best. The method is intended for average winds, not gusts, which result from turbulence. It's possible that a gust of 76 mph could have mixed down to the lower elevation of 20 feet at OLM. Winds at The Dalles, which matched Hoquiam in peak gust intensity on November 3, 1958, aren't always very strong during northwest windstorms. The peak gust at The Dalles during the Columbus Day Storm was a mere 29 mph, for instance. There appears to be a rough correlation between the direction a cyclone moves, and the strength of the winds at The Dalles. Table 5, below, lists the general tracks of some big storms in the 1950-2002 period, and the highest gust achieved at The Dalles during the events. The data are graphed out in Figure 9, below. Storm tracks are approximated to the nearest 1/16 compass point--these are not exact, but for this exercise exactness isn't that important. "E" denotes an officially estimated reading. Numbers in italics and followed by an "x" are extrapolated gusts from maximum 1-minute winds via a 1.3 gust factor. The data suggest that, for lows moving north of the Mid-Columbia Gorge region, the more easterly the track, the stronger the winds. There's much roughness in this formula, partly because the strength of these midlatitude cyclones varies, as does the distance of closest approach to The Dalles. Linear regression analysis yielded an r-squared value of 0.25. The mechanism to cause this correlation is probably related to much better jet support for westerly winds along the bottom side of an east-travelling low, plus an east-trending cyclone tends to produce the most extreme westerly gradients through the region. The big offshore-trending sou'westers don't have a chance at achieving the latter--gradients are nearly always easterly, as the low centers stay far to the west. |
|
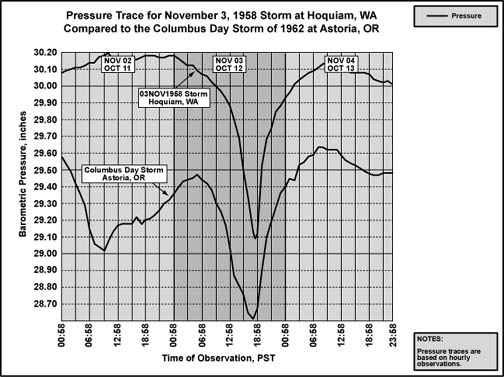
The peak rate of pressure declension at HQM, -7.1 mb (-0.21") an hour, and at both OLM and SEA, -6.1 mb (-0.18") an hour, mark some of the fastest drops recorded at any of the major observation stations who's data has been studied in detail for this website. Many windstorms have produced rates-of-fall in the range of -3.0 to -4.0 mb (-0.09" to -0.12") an hour. It seems that exceeding the upper mark of that range is difficult to accomplish, and this may happen only a few times a century at most. Salem, Olympia and Hoquiam had some of the fastest pressure drops during the Columbus Day Storm of 1962, all experiencing an -5.4 mb (-0.16") hourly plummet at various times during the cyclone's approach. These 1962 fall rates were nothing short of amazing, and further exemplify the unusually fast drops seen in 1958. Pressure rises in 1958 were no less spectacular. The +5.4 mb (+0.16") an hour value for Sea-Tac is, in the records examined for the station, third to the powerful rises seen in the December 21, 1955 and January 20, 1993 windstorms. The +5.4 mb barometric jump ranks with the climbs seen at some inland stations in ground zero of the Columbus Day Storm, such as the +5.5 mb (+0.16") observed at Portland. Olympia's +9.8 mb (+0.29") an hour leap outpaced coastal values for the Columbus Day Storm, such as the +8.8 mb (+0.26") climb at North Bend. Olympia's climbout was the most rapid--again in the records studied--for any inland station until the February 7, 2002 south valley windstorm produced rates-of-climb in the +10.2 to +12.2 mb (+0.30" to +0.36") an hour range for Eugene, Lebanon and Corvallis. And, as mentioned, the tremendous pressure swings at Hoquiam during the November 3, 1958 windstorm, a peak hourly surge of +13.9 mb (+0.41"), far outpace the performance of the Columbus Day Storm, and for any other event save the February 7, 2002 South Valley Surprise and the deep cyclone that struck Southwest Oregon on November 10, 1975. Figure 10, below, shows the 72-hour pressure trace for Hoquiam during the November 1958 event next to Astoria during the Columbus Day Storm of 1962. The downward spike for Hoquiam in 1958 is sharper and narrower than one of the most extreme pressure traces in Pacific Northwest history, though the two events are quite close. Olympia's trace for the 1958 storm is a contender as well. |
|
| Here's a look at some of the actual barograph traces for the November 3, 1958 windstorm. Figures 11, 12 and 13, below, show the barograms for Astoria, Hoquiam and Olympia, three stations that were severely affected by this windstorm. Astoria, about 60 miles south of the low center, has the weakest trace of this group of three, yet the sharp "V" delineated on the graph is no slouch--not many storms produce such rapid tendencies. Hoquiam and Olympia ended up much closer to the low's center, and their traces are fairly similar, with Olympia having a slightly longer period of minimum pressure which flattened out the point, and is probably the mark of the low passing futher north of Washington's capital than it did Hoquiam. |

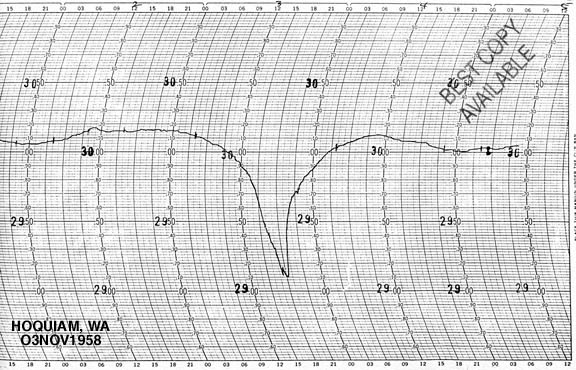
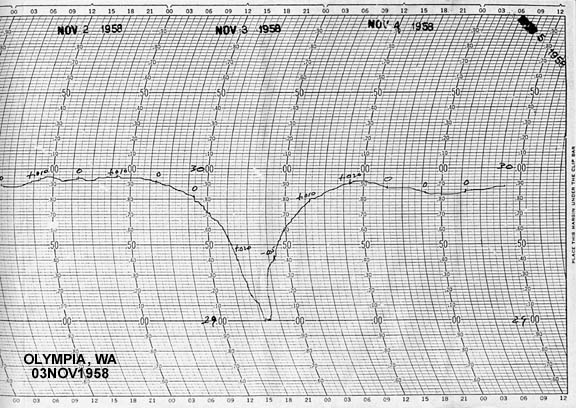
The above barographic traces for AST, OLM and HQM show a somewhat unusual feature about this storm. The sudden and sharp declension at the three station's barometers happened within a broad field of high pressure, making the storm's trace a discrete, isolated canyon. Like the Columbus Day Storm (Figure 10, above), many Pacific Northwest windstorms tend to arrive among a series of depressions, usually in a close enough succession that earlier and later storms show up on the 72-hour plots. Not in 1958. The storm's rapid passing left barometers on the day before and after the event at near-equal levels. If the November 3, 1958 data were missing, there's be little evidence that such an intense storm had struck! Also, the 1.09" total drop at HQM is one of the largest for any windstorm, and OLM's 0.97" isn't too shabby, either. The February 7, 2002 event was somewhat isolated on 72-hour plots, but total pressure falls weren't as pronounced, and there was a weak depression on the 6th. There's a nice trend in the pressure traces for Figures 4, 5 and 6, far above. Starting with HQM, and then going to OLM, and finally SEA, the barometric "curve" becomes increasingly broad and rounded. This is, in part, a record of the cyclone filling and weakening as it tracked inland. The rugged topography of Washington interfered with the low's surface structure, and the storm could not maintain integrity. In the introduction, it was mentioned earlier that the kind of localized extreme wind event seen in the interior on November 3, 1958 was rare, with the next one not happening until 17 years later and then another 27 years passing before something like it happened again. This does not mean that other big storms haven't struck, which obviously they have (1962!), but that few storms produce these particular characteristics: 1) a track with a strong easterly component that carries the low quickly across the western interior, 2) extremely fast declension and subsequent rise of the barometer at stations that fall within about 100 miles of the low's center, and 3) a sudden burst of winds out of the south that reach at least 40-45 mph gusting 60-70, sometimes 50-60 mph gusting 80-90, at interior stations within a maximum range of about 100 miles south of the low, which strongly limits the region severely affected by the storm. To be more specific, to qualify for one of these intense events, a cyclone should meet these three somwhat arbitrary criteria, here limited to the region west of the Cascade crest:
The sudden, violent nature of the winds in a small region is the primary signature of this kind of storm. Figures 14 and 15, below, compare events at Olympia in 1958 (duplicated here for convienence) with those at Eugene (EUG) in 2002. There is remarkable agreement between the two windstorms, from a sudden south gale after a period of calm, reaching maximum velocity as the pressure trace reached minimum, and then a sharp barometric rise with a wind shift to the southwest. As mentioned before, the tertiary peak at OLM is a fairly standard feature of windstorms for that region. A southwest airflow often follows Pacific lows as they dive inland. This wind has a fairly easy time entering Puget Sound country through the Chehalis Gap. Geographically, Eugene is much more enclosed, with the Coast Range to the west and the Siskyou Mountains to the south, and typically does not receive as strong a southwest "pull". | ||||||||
|
|
The combination described above is rare. A number of lows have met criterion 1 in the list, such as the fairly strong windstorm of December 14, 1977, which literally followed the same path as the 1958 blast. Though peak winds in 1977 were close at Astoria, with a gust to 74 mph, no interior station reached the excessive speeds seen in 1958: Sea-Tac had a brief gust to 47 mph, Olympia a mere 38, Portland 56, Salem 50 and Eugene 48. The 1977 low was much broader, and gradients just didn't reach the proportions required. Most lows meeting criterion 1, like the December 1977 storm, don't have the level of gradient to throw a serious whole-gale up the interior valleys. Strong gradients are marked, in part, by rapid pressure changes, which is why this feature was included as a characteristic. The sudden Willamette Valley attacks on March 1, 1974 and January 10-11, 1988 meet the criteria, though the pressure tendencies in the 1974 event weren't unusually fast for a Northwest windstorm, and peak wind speeds in both storms didn't quite reach the minimum threshold. The January 7-8, 1990 low, just two years after the 1988 event, is also a contender, but interior wind speeds, as measured on official stations also didn't reach the critical threshold of 50 mph G 70 or higher until the system struck regions east of the Cascades. Interestingly, the January 1990 event brought strong winds deep into the Intermountain Empire in a fashion very similar to the November 3, 1958 cyclone. The very intense October 2, 1967 storm produced some phenomenal winds in the Willamette Valley, with gusts as high as 78 mph at Portland. The track for this cyclone meets criterion 1, and the pressures changed fairly quickly--but not quite as fast, as much broader 72-hour barometric traces reveal. Like the 1974 storm, the pressure shifts in 1967 were adequately extreme, however, to put this storm in that gray area that always seems to exist between categories. Probably the biggest difference is that the 1967 storm was big, and strong winds reached far beyond 100 miles from the center (200 miles or so). The March 27, 1963 storm was very close, with maximum winds of 48 mph gusting 75 at Eugene, and pressure tendencies of -2.8 mb/hr followed by +6.3 mb/hr at Salem. So, it seems that the three criteria together single out the 1958, 1963, 1975 and 2002 storms, with possibly the 1967, 1974, 1988 and 1990 cyclones, as members of a special intense subclass of land-falling windstorm. Thus, the events that unfolded in 1958 are roughly a 7 to 15 year event, with November 3, 1958 cyclone being the most intense example on record. Incidentally, a 990 mb cyclone that nearly meets all the above criteria struck the San Francisco Bay Area on February 9, 1938. Maximum average wind speeds were generally 50 to 60 mph at many Bay Area locations, with 1-minute winds reaching an incredible 85 mph out of the SW at Potrero Hills. The high winds were generally confined to a region of about 100 miles of the low's center. The storm's only weekness under the definition are peak 1-hour pressure surges around +7.8 mb (+0.23") at Sacramento. Owing to the southern location of this storm, and the fact that such pressure swings are very rare in Central California, this storm is given an honorary membership into the unique category of windstorm described herein. |
A Brief Look at the Intermountain Empire Peak gusts reached 69 mph at Pasco, WA, 60 mph at Pocatello, ID, 63 mph at Laramie, WY, and an incredible 79 mph at Lander. Laramie had a -5.1 mb (-0.15") one-hour pressure fall between 08:58 and 10:00 on November 4, 1958, later followed by a +4.4 mb (+0.13") hourly surge between 18:00 and 19:00. The three-hour tendency was +11.2 mb (+0.33") between 17:00 and 20:00. Lander witnessed a double dip in pressure minimums similar to those witnessed in Western Oregon and Washington during many big storms, and then had a +5.1 mb (+0.15") hourly pressure surge between 10:58 and 11:58 on the 4th. |
References [1] Wind and Pressure data for this section is from unedited surface observation forms, November 2-4, 1958, from the National Climatic Data Center. And October 11-13, 1962 at Portland, Astoria and Olympia for the Columbus Day Storm figures. Figures for the February 7, 2002 storm were from METAR readings collected from the website of the National Weather Service, Portland and Seattle. [2] November 3, 1958 surface charts obtained from the National Climatic Data Center. [3] Businger, Steve, "Arctic Hurricanes," American Scientist, January-February 1991, Volume 79, pages 18-33. [4] Anemometer heights for Sea-Tac and Olympia were obtained from the National Climatic Data Center's Local Climatological Data Annual Summary, 2001. The Seattle Urban Climatology Station figure was from the 1988 LCD Annual Summary. |
|
Last Modified: February 5, 2008 | Back | |