November 5, 2005 SW Washington Windstorm

compiled by

Wolf Read

Figure 1, a peak gust map, will appear here soon.

A deepening 986 mb low moved ashore just south of Hoquiam, WA, during the night of November 5, 2005. This system followed a track not too dissimilar to the powerful November 3, 1958 cyclone, and, indeed, had a similar minimum central pressure. The 2005 storm, however, did not quite pack the punch of its earlier cousin. Nevertheless, for a very narrow region that included parts of Kelso, Centrailia and Chehalis, the 2005 event resulted in some damaging winds. Interestingly, this storm's high winds were so concentrated in a narrow belt, and the track was aligned just right, such that no official station reported wind velocities of "high wind criteria" (40 mph or higher average, and/or gusts of 58 mph or higher).

Here's what I noted about this storm in my journal:

November 5, 2005: Saturday

08:13 PST: (Beaverton, OR) Here’s the latest satellite photo of the developing low, which appears to be nearing 130ºW. Right now, development is slow, but it is expected to accelerate as the upper trough catches up to the cyclone. The high wind forecast for the PDX area is currently in the “watch” category, so this event isn’t considered certain even at this late hour.


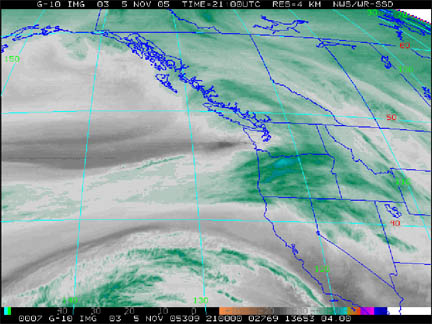
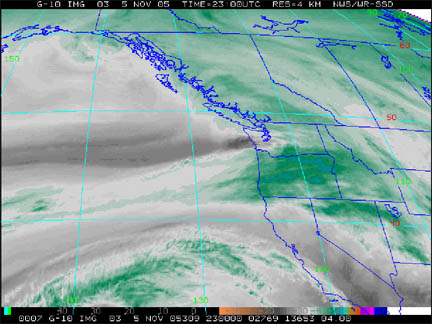
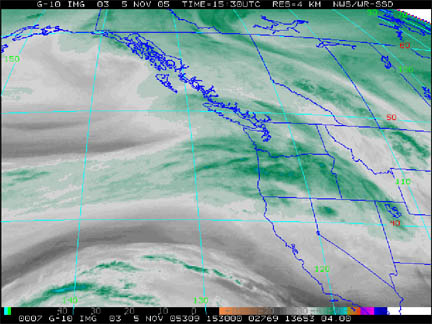
Figure 2: Water vapor satellite image showing the early stages in the development of the November 5, 2005 cyclone. The center is nearing 130ºW along about 47ºN. Time is 07:30 PST.


13:39 PST: (Vancouver, WA) The cyclone is intensifying rapidly, with steady light to moderate rain in the area since about 10:00. According to the weather radio, it’s raining all the way up to at least Seattle. Winds are escalating, too. Already surpassing 40 mph in the Coast Range. Due to the hazardous conditions, I decided to stay in Vancouver [instead of driving home to Mt. Vernon, WA].


Figure 3: Water vapor satellite image of the deepening cyclone taken at 13:00 PST. The low's center is closing in on Willapa Bay.


15:01 PDT: The low must be nearing the coast. At Hoquiam, the barometer was down to 995.2 mb (29.38”) at 14:50, down from 998.1 mb (29.47”) at 13:50. East winds 26 mph G 33 at 14:50. Clear indicator of a close approaching cyclone. At Astoria, the barometer was 994.2 mb (29.36”) at 14:55, and east winds, which were 15 mph G 26 at 14:15 are now down to E at 5 mph, so it seems like the center may be nearing this region. At 14:50, the winds at Newport were SSW 33 mph gusting 46, this after winds reached 40 mph gusting 56 at 13:50 and 41 mph gusting 54 at 14:10. Pressure at 14:50 was 29.56”, so, we’re looking at a gradient of 0.20” between ONP and AST, or 6.8 mb. This has been a wet storm on the coast, with lots of rain at these three stations, including periods of heavy rain at Astoria.

At the Portland airport, ESE winds have been as high as 18 mph gusting 24 at 13:55, and still 18 mph now (14:55). Barometer at 1000.6 mb (29.55”) at 14:55. At the same time, Salem’s barometer was at 1000.3 mb (29.54”) with south winds at 26 mph gusting 33, the highest so far today. SE wind at 20 mph at Eugene, with a barometer at 1003.2 mb (29.62”) all at 14:50. Olympia shows ENE wind at 14:50, with a fairly low barometer at 998.1 mb (29.47”).

Outside the window, rain is falling moderately and quite steadily. Everything’s soaked. A low gray overcast rushes across the sky, and the ESE winds occasionally shake the trees. 15:26 PST.


Figure 4: The storm's center nears SW Washington at 15:00 PST. Heavy rain and strong wind lash the Oregon coast at this time.


15:37 PST: Dry slot has enhanced, and it looks like the center is now landing on the south Washington coast. This system is moving quite fast! 15:38 PST.

16:53 PST: Looks like the low center is almost certainly moving inland between Astoria and Hoquiam. South winds at Astoria at 16:35, 28 mph gusting 39, with the barometer down to 29.27”. At Hoquiam, NE 13 mph gusting 18 at 16:40 and 29.26”. Interestingly, winds were ENE 29 mph gusting 38 at 15:50. New data just in for Hoquiam: 16:50, 990.9 mb (29.25”) and ENE 18 mph gusting 23, temp/DP 43F/41F. At 16:55, Astoria also at 990.9 mb, and south winds 26 mph gusting 37. At 16:50 winds WSW at Newport, 23 mph gusting 36, still dropping from earlier gale-force values. With that direction, it appears that a front has pushed through. 17:05 PST.

19:25 PST: Okay, the low’s inland now for sure. Lowest pressures are around the Olympia, Centralia and Tacoma areas with 990.4 mb at 18:50 at OLM, and 990.7 mb 18:55 at TCM. North and northeast winds at these two locations. Astoria had some data burps at 17:40 and 17:55 that could reflect some extreme weather, but without the wind data, it can’t be verified. What shows up is a pretty good pressure surge from 991.6 mb at 17:55 to 997.9 mb at 18:55 (6.3 mb in one hour!). Winds that were south at 16:55 had switched to west by 18:30 with a velocity of 26 mph gusting 35. Rainfall stopped at this time. Lowest pressure at the Columbia Buoy 46029 was 29.14” (986.7 mb) at 16:50. At that time, maximum winds were achieved: SW 36 mph gusting to 49. ACV-AST gradient reached +24.6 mb at 17:00--which is certainly high enough for a good gale. Of course, the usual spots got some hefty wind, like Cape Blanco with gusts up to 93 mph.

In the Willamette Valley, temperatures climbed from the mid-40s to low-to-mid 50s with a wind shift to SSW and SW, and barometers have started to rise. Wind velocity has not been particularly strong, with a general decrease overall. For instance, PDX reported SSW 10 mph gusting 18 at 18:30, the highest from the southwesterly quadrant. Aurora reached SW 18 mph gusting 32 at 18:00, and Salem WSW 12 mph gusting 22. Max EUG-PDX pressure gradient appears to be +4.9 mb at 18:00. PDX-SEA still climbing at +7.6 mb last hour.

It seems that this low was a bit too broad, and perhaps the strong westerly upper-level flow that supported an eastward migration of this cyclone just wasn’t conducive to strong southerly winds in the Willamette Valley. 19:49 PST.

20:51 PST: Looks like Kelso was the big “winner” for highest wind velocity in the interior, with SE 22 mph gusting 43 at 16:15. At 20:35, winds were now west at 21 mph gusting 28. The low is now moving into the Cascades. Looks like the potential wind event fizzled. 20:53 PST.


November 6, 2005: Sunday

06:15 PST: (Vancouver, WA) Strong pressure surges and winds shifting through a NàNWàWàSW pattern at Olympia and Tacoma suggest that the low center passed very close to, but south of these stations. Peak rates of 1-hour pressure increase included +4.2 mb at Olympia and +5.9 mb at Tacoma McChord. Peak wind gusts reached into the mid-20s, quite low considering the strong pressure tendencies. The cyclone has now moved beyond Spokane, where pressures fell to 996.5 mb at 23:55, and peak winds reached SW 35 mph gusting 44 at 00:05 this morning.

Looks like a narrow band of strong winds moved inland with the cyclone. Apparently a high wind warning was issued by the NWS, Seattle, around 20:00 for Thurston County as a spotter in Yelm reported SW winds of 42 mph gusting to 54, and another in Centralia reported gusts to near 40 mph. Scattered reports of trees down and local power outages came from this small region. Although—it seems like Yelm is rather wind prone, based on past events.

16:35 PST: (Mt. Vernon, WA) It turns out that the low had quite a punch along a narrow region between Kelso and Olympia. We saw the results. Silven was kind enough to take data for me as we drove up, and I wrote a report which I sent to the spotter coordinators for the NWS Portland and Seattle offices. Here’s what I wrote:

SkyWarn Report for 05 Nov 2005 Event:

The 986 mb cyclone that moved ashore in southwest WA last night clearly brought a narrow zone of damaging wind just south of the cyclone's center inland into the SW WA interior. I happened to be in the Portland area, and took I-5 north on my way to Mt. Vernon this morning. The I-5 corridor, which has plenty of trees, provided a good cross-section of where the highest winds struck, and also reveals some idea of the gale's nature.

Significant tree damage (large branches and stem breaks) became apparent just north of Kelso. This continued in places to mile post (MP) 88. North of MP 88, tree damage quickly reduced to nonexistent long before Olympia (~MP 105). This suggests that the area subjected to high-wind-criteria airflow was perhaps 35 miles wide on a north-south axis. Within this band, pockets of more extreme damage were apparent. Usually these pockets were about 0.5 to 1.5 miles in breadth. One zone of heavy damage occurred along the southern side of Chehalis. Another pocket of heavy damage happened around MP 85.

Damage included alder and cottonwood trees that had been snapped clean. Large cottonwoods and mid-sized Douglas-firs were uprooted in places. A bigleaf maple fell across the railroad tracks at MP 86. Parts of I-5 in the pockets of heaviest wind were nearly buried in shed Douglas-fir branches and twigs. In no less than three places on the southbound side of I-5 did trees actually fall into the road. At one rest stop, a fairly large Douglas-fir uprooted and nearly fell onto the off-ramp. In some woodlots, small swaths of windthrow developed, though these were minor in scale compared to bigger windstorms.

Based on a close survey of wind damage from the 07 Feb 2002 windstorm, there was a strikingly similar pattern to the damage on 05 Nov 2005 in terms of broken trees being concentrated in very narrow focused "bands," with areas of lighter damage between. The level of damage on 05 Nov 2005 wasn't quite at the scale of 07 Feb. I believe that in the pockets of most extreme damage, there's good reason to conclude that average winds reached 40 to 45 mph with gusts of 60 to 65 mph. Elsewhere in the 35-mile-wide swath, average winds probably peaked in the range of 20 to 30 mph with gusts to 40.

Here are the tallies of trees that were broken by the 05 Nov 2005 storm between Kelso and MP 88 on I-5 (these are the ones that my wife and I saw from the road, at least): 

Alder: 8
Bigleaf Maple: 6
Cottonwood: 6
Douglas-fir: 10

Total: 30 trees down in about 35 miles.

Plus, numerous large branches, typically from tall Douglas-firs.

Also, what I forgot to mention is that the damage pattern supported peak winds from a SW to WSW direction. This is why a number of trees fell across I-5, and also many branches landed in the road. So, indeed a windstorm resulted, this time another focused event like 07 Feb 2002, but not quite as strong and over an even narrower region. This came very close to the Portland Metro area. Just 50 miles difference in track would have brought the big wind to the Rose City, a situation not too unlike 07 Feb 2002, but in the opposite direction. 18:49 PST.


November 5, 2005: Meteorological Details

To appear soon.


General Storm Data

Table 1, below, lists the barometric minimums for the November 5, 2005 storm at selected sites. Many Pacific Northwest windstorms have produced lower readings, though these values are similar to the November 3, 1958 windstorm. The most depressed pressures during this storm were around the mouth of the Columbia River, and included 29.14" at 16:00 at Buoy 46029 near the Columbia River bar.

Sources: National Weather Service, Eureka, Portland and Seattle offices, METAR reports, and the National Data Buoy Center, realitime meteorological data.

Location

Lowest
Pressure

Approx Time
of Lowest Pressure

California:    
Arcata

29.97"

00:00 HRS, 30th

Oregon:    
North Bend [1]

29.71"

00:00 HRS, 30th

Astoria [2]

29.50"

01:00 HRS, 30th

Medford

29.75"

00:00 HRS, 30th

Eugene

29.62"

23:00 HRS, 29th

Salem

29.56"

23:00 HRS, 29th

Portland

29.53"

00:00 HRS, 30th

Washington:    
Quillayute [3]

29.28"

01:00 HRS, 30th

Olympia

29.41"

00:00 HRS, 30th

Seattle (Sea-Tac)

29.38"

00:00 HRS, 30th

Bellingham

29.38"

19:50 HRS, 5th

     
AVERAGE

29.54"


Table 1 Notes:

[1] Last of two occurrences, the other having happened the hour before.

[2] Last of three occurrences, the others happening at 22:00 and 23:00 on the 29th.

[3] Last of two occurrences, the other having happened the hour before.

[4] Last of three occurrences, the others happening at 01:00 and 02:00 on the 30th.

Table 2, below, lists the maximum gradients for some standard measures during the January 29-30, 2004 cyclone. The readings aren't particularly strong, and are generally similar to the December 27, 2002 windstorm.

Sources: National Weather Service, Eureka, Portland and Seattle offices, METAR reports, the National Data Buoy Center, realitime meteorological data, and the National Climatic Data Center, unedited surface observation forms (for historical storm pressure data).

Location

Max Gradient, mb

Approx Time
of Max Gradient

Coast:    
ACV-OTH

+10.5

03:00 HRS, 30th

OTH-AST

+9.9

01:00 HRS, 30th

AST-UIL

+7.9

00:00 HRS, 30th

ACV-AST [1]

+18.5

02:00 HRS, 30th

OTH-UIL

+17.4

01:00 HRS, 30th

Interior:    
MFR-EUG

+8.4

23:00 HRS, 29th

EUG-PDX

+5.3

01:00 HRS, 30th

PDX-SEA

+7.1

02:00 HRS, 30th

SEA-BLI

+6.5

03:00 HRS, 30th

AST-DLS

-4.9

22:00 HRS, 29th

Table 2 Notes:

[1] Last of two hourly occurrences, the other having happened the hour before.


Pressure Tendencies

The January 29-30, 2004 event, interestingly, favored the Western Oregon interior with the strongest pressure changes. Quite possibly the Coast Range gave the cold front an extra kick of instability that may have contributed to the stronger pressure falls compared to those on the coast. The tendency for the maximum hourly fall to be around 23:00 and 00:00 and maximum hourly rise to be around 01:00 to 02:00 marks the strong, fast-moving, frontal system, which nearly paralleled the coast.

Source: National Weather Service, Eureka, Portland and Seattle offices, METAR reports, and the National Climatic Data Center, unedited surface observation forms (for historical storm pressure data).


Maximum Pressure Tendencies for the January 29-30, 2004 Storm

Location

Max
Hrly
Fall
mb

Time of
Max Fall
PST

Max
Hrly
Rise
mb

Time of
Max Rise
PST

California:        
Arcata [1]

-1.5

21:00 HRS, 29th

+2.6

01:00 HRS, 30th

Oregon:        
North Bend

-1.9

22:00 HRS, 29th

+3.0

01:00 HRS, 30th

Astoria

-2.1

22:00 HRS, 29th

+2.5

04:00 HRS, 30th

Medford

-3.8

00:00 HRS, 30th

+4.3

02:00 HRS, 30th

Eugene

-3.3

23:00 HRS, 29th

+3.2

01:00 HRS, 30th

Salem

-2.7

23:00 HRS, 29th

+2.7

01:00 HRS, 30th

Portland

-3.2

23:00 HRS, 29th

+2.3

02:00 HRS, 30th

Washington:        
Quillayute [2]

-2.0

13:00 HRS, 29th

+2.6

05:00 HRS, 30th

Olympia

-2.5

22:00 HRS, 29th

+2.5

04:00 HRS, 30th

Seattle (Sea-Tac)

-3.3

23:00 HRS, 29th

+2.0

06:00 HRS, 30th

Bellingham

-2.5

17:00 HRS, 29th

+3.3

06:00 HRS, 30th

         
AVERAGE

-2.6


+2.8


Table 4 Notes:

[1] The -1.5 mb hourly fall at Arcata is the last of two occurrences, the other having occurred in the hour before.

[2] Pressure data missing at Quillayute for about four hours before minimum and during the time of max hourly falls at other coastal stations; the -2.0 maximum hourly fall may be low.


Table 5, below, lists the peak wind and gust for eleven key stations in the Pacific Northwest, their direction, and their time of occurrence. "Peak Wind" is a 2-minute average, and "Peak Gust" is a 5-second average. By my own personal methodology, a wind event rates the term "windstorm" when the average peak gust of these eleven stations reaches 39.0 mph (gale force) or higher. The January 29-30, 2004 cyclone just made the cut, and is a minor windstorm. Moderate windstorms have an average of 45.0 to 54.9, and major windstorms are those that reach or exceed 55.0. Only a handful of storms have made the majors, including December 12, 1995, November 14, 1981 and October 12, 1962.

Note that the newer 5-second gust adopted by the NWS alters the meaning of the kind of storm ranking system I describe here. See "Adjustments to Modern Storms."

Sources: National Weather Service, Eureka, Portland and Seattle offices, METAR reports.

Location

Peak
Wind
mph

Direction
Pk Wnd
degrees

Obs Time of
Peak Wind
PST

Peak
Gust
mph

Direction
Pk Gst
degrees

Obs Time of
Peak Gust
PST

California:            
Arcata

26

270

00:56 HRS, 30th

36

260

00:45 HRS, 30th

Oregon:            
North Bend

30

260

23:15 HRS, 29th

48

260

23:15 HRS, 29th

Astoria

31

190

16:55 HRS, 29th

47

180

21:44 HRS, 29th

Medford

32

230

00:44 HRS, 30th

47

210

00:53 HRS, 30th

Eugene

22

180

22:54 HRS, 29th

39

230

00:54 HRS, 30th

Salem

24

200

23:56 HRS, 29th

44

220

00:56 HRS, 30th

Portland

23

260

00:35 HRS, 30th

41

260

00:35 HRS, 30th

Washington:            
Quillayute

23

270

04:37 HRS, 30th

47

290

05:53 HRS, 30th

Olympia

25

230

00:12 HRS, 30th

37

230

00:12 HRS, 30th

Sea-Tac

25

230

09:56 HRS, 30th

40

230

05:56 HRS, 30th

Bellingham

35

180

03:53 HRS, 30th

43

180

03:53 HRS, 30th

             
AVERAGE

26.9

227


42.6

232


Last Modified: December 9, 2005
Page Created: December 4, 2005

You can reach Wolf via e-mail by clicking here.

| Back |