Is it Possible for a Pacific Northwest Windstorm to Ever Exceed the Peak Winds of the 1962 Columbus Day Storm?

Pressure Gradients and Major Cascadia Windstorms

compiled by

Wolf Read

This is an expansion of a presentation for the 2013 Pacific Northwest Weather Workshop.


1.0 Introduction


The Columbus Day Storm (CDS) produced the fastest winds on record in the Willamette Valley (Lynot and Cramer 1966, Read 2015a). Despite this fact, the CDS did not produce a record pressure gradient between Eugene (EUG) and Portland (PDX) in the hourly observations. At the height of the storm, the EUG-PDX gradient climbed to +9.6 hPa at 02:00 UTC on 13 Oct 1962. This is well below many major windstorms that did not produce winds of CDS magnitude, including a +13.7 hPa gradient during a windstorm just five years later on 02 Oct 1967. Yet the CDS produced much faster winds. Analysis of pressure gradients in two dimensions helps explain this seeming disparity.


2.0 Pressure-Wind Triangles and Two-Dimensional Pressure Gradients


When considering the pressure gradient outcomes of different storm tracks, the EUG-PDX measure is not favored for high readings for paths that are northeast to north and especially offshore. A low tracking east to northeast that moves inland just to the north of the Willamette Valley is better positioned to produce a higher EUG-PDX pressure gradient due to a tendency for isobars to be arranged nearly perpendicular to a line drawn between EUG and PDX, an ideal alignment for high EUG-PDX gradient readings and also a good arrangement for ageostrophic southerly winds. Indeed, the bearing from PDX to EUG is 196° so even a nice south-to-north arrangement of isobars--a southerly pressure slope (see Lange 1998 for discussion of pressure slopes)--is not exactly an ideal setup for maximizing the EUG-PDX pressure gradient measure. Any deviation from a 196° azimuth reduces the EUG-PDX magnitude. In other words, gradients determined by using two fixed stations are likely to be under-reported. This happened quite strongly during the CDS.

EUG-PDX is a two-point or one-dimensional (1D) estimation of the pressure gradient. Two-point systems are limited by the fact that most of the time the pressure slope does not exactly match the bearing between weather stations. If three stations are used then the pressure-gradient orientation can be approximately determined, and the gradient calculated on a line that is perpendicular to the isobaric arrangement. The pressure gradient value is accompanied by a measure of the pressure slope (some might prefer to call this pressure aspect or azimuth) in degrees. The pressure slope can be considered the ageostrophic wind direction determined by the calculated isobaric arrangement. The key advantage to the three-point system is that it closely captures the pressure gradient value for the region enclosed by the triad of stations, regardless of how the isobars are oriented. The magnitude of the gradient can be estimated over any distance inside the area delineated by the three stations, and even estimated outside of the boundaries though error would be higher.

Using Astoria (AST), EUG and PDX sea-level pressure observations, 2D pressure gradients were constructed by employing what is sometimes called a pressure-wind triangle (Figure 2.1). Pressure-wind triangles can be used to estimate the geostrophic potential wind within the polygon, and from that surface winds can be estimated. The method used for the calculation of the geostrophic potential wind magnitude is from Stull (2015). A right triangle is required, and in the case of the arrangement of the three stations used here, this necessitates the use of two interpolation points. Linear estimation is used, which is a source of error because pressure gradients are not always even across large distances. Other stations in an arrangement closer to a right triangle could have been selected. However, AST, EUG and PDX were chosen due to their long period of largely uninterrupted record of barometric pressure, allowing many storms from history to be analyzed. Since pressure-wind triangles closely capture the actual gradient for a given time, the calculated values are here referred to as the absolute pressure gradient, to distinguish them from 1D measures. Absolute pressure gradients are typically reported over a distance of 100 km (e.g. 5.0 hPa/100 km).


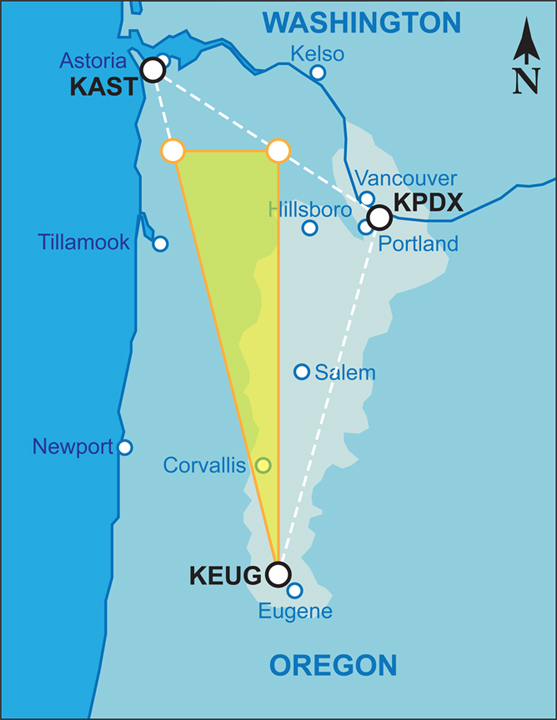
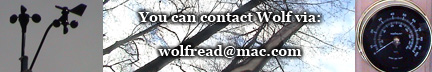
Figure 2.1 above Schematic of a pressure-wind triangle using the stations KEUG, KPDX and KAST (black circles). Two pressure interpolation points are shown (orange circles). The right triangle used for pressure gradient and geostrophic wind calculations is highlighted (orange outline with yellow shading). The Willamette Valley and adjacent lowlands in Washington are roughly outlined with lighter shading.


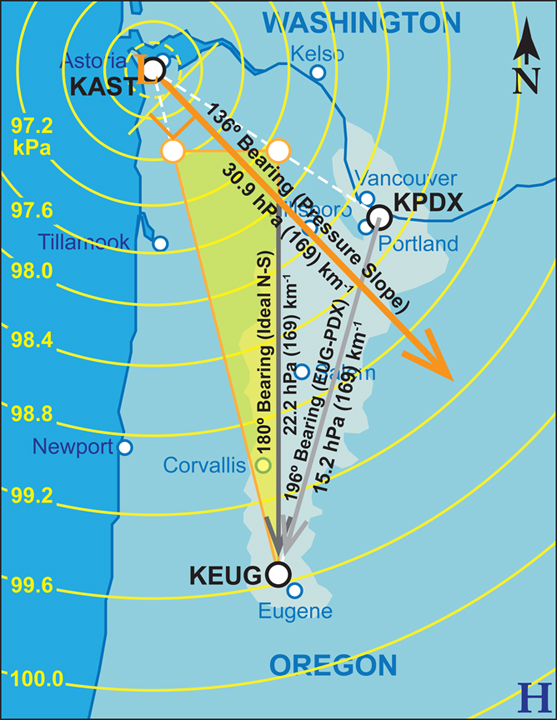
Hourly gradients were calculated for the CDS. The maximum gradient inside this triangle, 11.0 hPa/100 km (i.e. 11.0 mb over 100 km) occurred at 03:00 UTC on 13 Oct 1962 (Figure 2.2). This is noticeably above the +9.6 hPa determined from the 2-point EUG-PDX system, and over a smaller distance. For easier comparisons, a scale of 169 km (105 miles), the distance between EUG and PDX, is used in place of 100 km. This results in an intense peak gradient of 18.6 hPa/169 km.

To show how dramatically the 2-point system failed to capture the actual pressure gradient during the CDS, the magnitude of gradient can be calculated along a bearing of 196° within the triangle for 03:00 UTC (Figure 2.2). In so doing, the number is reduced to 9.2 hPa/169 km, close to the raw measured peak 1D gradient value and just half of the real magnitude. The peak EUG-PDX gradient occurred one hour ahead of the peak EUG-PDX-AST gradient. At 02:00 UTC 13 Oct 1962, the absolute gradient had reached 17.4 hPa/169 km and, due to a more favorable pressure slope (e.g. the isobars were more nearly perpendicular to the 196° bearing than during 03:00 UTC) the estimated EUG-PDX gradient reached its peak of 9.5 hPa/169 km, just 0.1 hPa off of the raw value calculated directly from the 2-point system. This suggests that the 3-point model is working rather well.


Figure 2.2 above The time of maximum pressure gradient for the Willamette Valley during the CDS, 03:00 UTC 13 Oct 1962. The orientation and magnitude of the pressure slope is shown (orange arrow). The 1D EUG-PDX measure is also indicated (lighter gray arrow) alongside the pressure gradient along a perfect N-S axis (dark gray arrow). The indicated isobars (yellow lines) are idealized. The location of highs (H) and lows (L) are for reference and may not indicate the exact centers of circulation.


The gradient for any bearing can be estimated within the triangle. The exact orientation of the geography defining the Willamette Valley can be quibbled over and appears to depend on the latitudinal position within the Valley, but an 180° bearing, instead of the 196° between EUG and PDX, might be considered a more ideal orientation for gauging storms that produce strong southerly winds. Therefore, for the Willamette Valley, the pressure gradient value along 180° could be considered the effective gradient for a given storm. For the 180° bearing during the CDS, the peak gradient occurred at 03:00 UTC with a value of 13.4 hPa/169 km (Figure 2.2).

Peak gradients were also calculated using the 3-point system for 27 significant windstorms that occurred from 1945-2012, with the majority of events between 1957 and 2000. Pressure data from either AST or EUG are missing from several key storms in the early-to-mid 1950s, and are increasingly spotty for all the stations earlier than about 1950. Storms analyzed with the 3-point system include many of the “classic” windstorms that followed north to north-northeast paths offshore in a manner similar to the CDS: 04 Dec 1945, 14 Apr 1957, 26 Mar 1971, 14 Nov 1981, 12 Dec 1995 and 16 Jan 2000.

The peak absolute gradient for the CDS of 18.6 hPa/169 km and the maximum effective (along the 180° bearing) gradient of 13.4 hPa/169 km are the highest among all 27 storms (Table 2.1). This is a particularly interesting result given that land-falling systems that track north of the Willamette Valley are best situated for the highest pressure gradient readings, especially along a 180° orientation, due to close passage of the low-pressure center and an expected favorable southerly pressure slope.


Event

Peak
Gradient
hPa/169 km

Peak
Gradient Pressure Slope
°

Time of Peak Gradient
UTC

Peak Gradient for 180° Orientation
hPa/169 km


12 Oct 1962

18.6

136

03:00 13 Oct

13.4


08 Jan 1990

16.9

238

10:00 08 Jan

13.1

02 Oct 1967

16.2

228

05:00 02 Oct

10.8

24 Nov 1983

15.2

144

16:00 24 Nov

12.4

12 Dec 1995

15.0

144

00:00 13 Dec

12.0

14 Nov 1981

15.0

139

14:00 14 Nov

11.6


Table 2.1 above Windstorms with the top five peak pressure gradients after the 12 Oct 1962 CDS. Shown is the maximum pressure gradient in hPa/169 km along the pressure slope (bearing in degrees), the time of occurrence and the gradient magnitdue adjusted along a bearing of 180°.


The next two strongest events behind the CDS, 08 Jan 1990 and 02 Oct 1967, were land-falling storms that tracked just north of Portland, offering nearly ideal setups for strong pressure gradient readings. However, the peak gradient of both storms occurred during a phase with a southwest (~225°) pressure slope, which mitigated some of the effectiveness for southerly winds as indicated by markedly lower gradients along a 180° bearing, especially for the 1967 event.

The 24 Nov 1983 windstorm tracked north-northeast across the Olympic Peninsula, not quite a classic path but nevertheless rather close. Given the magnitude of pressure gradient for the 1983 Thanksgiving Day storm, and its timing on a holiday, it is a wonder that this event is not discussed more. It appears to be one of the forgotten big windstorms of history.

The final two storms on the list, 14 Nov 1981 and 12 Dec 1995, were both major classic events that followed a track similarly, but not exactly, to the CDS. The 12 Dec 1995 event tracked across the tip of the Olympic Peninsula just west of the 1983 storm. Interestingly, all three events, 1981, 1983 and 1995, produced southeast (~135°) pressure slopes at the time of peak gradient, much like to the CDS. This is the mark of lows tracking offshore at closest approach to the pressure-wind triangle, as opposed to lows tracking inland at closest approach. The tendency for peak gradient with a southeast pressure slope likely mitigates the magnitude of these storms, as indicated by lower gradient values along the 180° bearing. If the Willamette Valley were oriented more like the Georgia Strait (northeast-southeast instead of north-south), then one might expect classic windstorms to have an even more dramatic impact than they already do. The northward movement of these storms, which can add a significant vector component depending on storm speed, and also implying the potential for a favorable upper-wind direction for the support of southerly winds, likely offsets some of the unfavorable gradient orientation.


3.0 Some Catastrophic Windstorm Scenarios


Now to an interesting question: Is the CDS the strongest possible windstorm? Examination of the pressure gradient responses of significant Pacific coast storms offers an answer.

An extratropical cyclone that struck Vancouver Island on 12 Mar 2012 offers a clue. Sea-level pressure data from Estevan Point (WEB), Solander Island (WRU) and Port Hardy (YZT) at the time of the storm show a phenomenal pressure gradient (Read 2015b). These locations happened to be immediately east and southeast of the track. In fact, the low center very nearly passed right over Solander Island as it moved almost due north. By 16:00 UTC on 12 Mar 2012, the absolute pressure gradient within the WEB-WRU-YZT triangle climbed to the phenomenal level of 18.2 hPa/100 km. When estimated across 169 km, the value is 30.9 hPa.

To help picture this magnitude of gradient, place an aneroid barometer in Eugene and another in Portland. The device in Eugene would read a rather low, but not out-of-the-ordinary for a winter storm 992.5 hPa (29.31" Hg). As the same time, the barometer in Portland would show an unprecedented and dramatic 961.7 hPa (28.40" Hg--the actual pressure observation at Solander Island at the time of maximum gradient). Another way to look at this is with the geostrophic wind potential. At 50°N, such an intense gradient results in a 299 mph (481 km/h) geostrophic wind estimate. At 45°N, roughly the latitude of the Willamette Valley, this wind speed increases to 322 mph (519 km/h). For comparison, during peak gradient for the CDS the geostrophic wind potential reached 193 mph (311 km/h).

Of course, at the surface turbulent drag tends to reduce wind speeds to well below the geostrophic wind potential. When considering 1- or 2-minute wind speed, not peak gust, many Pacific Northwest windstorms realize about 25-40% of the potential at land-based weather reporting sites (often higher near large bodies of water). This rule-of-thumb appears to describe well a large number of windstorms with different storm track directions and over a wide range of peak pressure gradients. For example, at the extreme upper end, the highest 1-min average wind speeds in the Willamette Valley reported during the CDS were in the range of 60-70 mph (95-110 km/h). Actual peak 1-min winds may have been a bit higher given an 88 mph (142 km/h) fastest mile measured at Portland. This is effectively a 41-second average, which suggests something like 80 mph (130 km/h) for a peak 1-min wind. The range of observed speeds during the CDS is 30-40% of the maximum geostrophic wind potential (193 mph), quite typical of a Pacific Northwest windstorm.

Consider a scenario where the 12 Mar 2012 extratropical cyclone instead of tracking near Solander Island moves right over Astoria (Figure 3.1). The low-pressure center is moving north-northeast like the CDS, with good upper support for southerly winds over the Willamette Valley. Using 25-40% reduces the 322 mph estimate for the 12 Mar 2012 windstorm at latitude 45° to peak values of around 80-130 mph (130-210 km/h), magnitudes about on par with to well above those reported in the Willamette Valley during the CDS. Another way to look at this is that in an idealized situation free of friction--as in the geostrophic winds reported above--a doubling of the pressure gradient doubles the wind speed. The 12 Mar 2012 windstorm produced 30.9 hPa/18.6 hPa = 1.66 times the Willamette Valley gradient of the CDS. Given this information and the setup, the estimate for peak wind speeds is then an intense 100-130 mph (160-210 km/h) when using the 60-80 mph range measured during the CDS. Due to the linear relationship between pressure gradient and geostrophic wind speed, this method not surprisingly agrees with the estimate based on simply reducing the geostrophic wind to 25-40% of its value. However, near-surface winds are a rather complicated phenomenon and friction is known to have a nonlinear influence on wind speed.


Figure 3.1 above A hypethetical scenario where an extratropical cyclone moves over Astoria, bringing a pressure gradient equivalent to the 12 Mar 2012 northern Vancouver Island storm. See Figure 2.2 for a key.


For boundary layer gradient winds the equations have a quadratic form, and there is a square root. Thus, theoretically, when the pressure gradient is doubled, the wind speed does not double, but increases with the square root of 2, or 1.41 times. Another way of looking at this is that, because the wind force increases with the square of velocity, when the pressure gradient is doubled, the wind force, not speed, doubles.

For the intense landfalling extratropical cyclone scenario outlined above and shown in Figure 3.1, this means that expected peak winds would not be around 1.66 times the CDS, but closer to sqrt(1.66) = 1.29 times. This is still a phenomenal 75-100 mph (120-160 km/h), or in other words category I to II hurricane wind speeds. Gusts would be higher, potentially approaching 140 mph (225 km/h) in places.

The outcome for the Valley would be catastrophic. A large percentage of trees would be broken or uprooted, many windows would be shattered and structures would be unroofed or demolished completely, resulting in much flying debris, which can cause damage to other structures including electrical substations. Indeed, 140 mph gusts may push or exceed the design limits of steel-framed high-rises in downtown Portland and also critical infrastructure like transmission towers. Such destruction would devastate the power grid--to a level outside the experience of many people working at the region's electrical utilities today, save for those that have been involved with post-hurricane recovery. Most roads would be literally buried under toppled trees and shattered structures, limiting the ability of first-responders and repair crews to reach the afflicted region. Many people, indeed communities in the Valley are probably not prepared for such a windstorm.

It is important to keep in mind that the suggested scenario has an extremely low probability of occurring. This is perhaps a 5,000-year storm for the Willamette Valley, which means a rather slim 1 in 5,000 chance each year. Civilizations can rise and fall without such an event occurring.

A number of factors influence measured surface wind speeds aside from pressure gradients, including storm track direction, storm speed and upper-air support. Also, hourly observations may not exactly capture the peak gradient. As evidenced by Table 1, and the peak winds for the listed windstorms (not shown), maximum pressure gradients do not have a perfect relationship with peak wind speeds (e.g. 02 Oct 1967 vs. 08 Jan 1990). Thus, the peak wind prediction for the above extreme windstorm scenario has some error and the actual outcome could be lower than the basic calculations would suggest. Peak winds near the center of 12 Mar 2012 extratropical cyclone as it landed on northern Vancouver Island were about on par with the CDS, in the range of 60-67 mph (96-107 km/h) for 2-min averages with gusts upwards of 81-88 mph (131-143 km/h), and did not exceed the 1962 windstorm. However, weather stations were sparse in the landfall region, were not necessarily in the best locations to capture the strongest S to SE winds and observations were intermittent at some reporting sites, leaving the possibility that the highest winds associated with the 2012 storm were not captured. Being further north than the Willamette Valley, wind speeds would also be a little lower for an equivalent pressure gradient--see the difference in calculated geostrophic wind magnitude above (7.1%). In any event, the above peak wind and gust estimates for the hypothetical storm can only be considered rough approximations.

Although the actual peak wind speeds may not be as strong as indicated by the basic calculations done here (they could in fact be stronger), the probability that such a storm scenario would result in higher winds than the CDS is nonzero. Does it seem likely that such a large exceedance in peak surface pressure gradient would result in slower winds than the CDS, especially given a similar track direction, overall storm speed and upper support?

In the scenario, the low center is moving inland at a shallow angle to the coastline, thus the storm would be interacting closely with the terrain well before it reached Astoria. Perhaps there would be some reduction of the strong pressure gradient in the southeast quadrant of the low due to ageostrophic surface flow causing rapid filling. How much weakening depends on the proximity of jet-stream support for maintaining a deep surface low.

A more likely scenario for bringing such a strong pressure gradient inland is a more zonal--northeast to east--storm track. With such tracks, the upper-air flow tends to be more westerly, and therefore the upper wind support for southerly near-surface winds is weaker, mitigating wind speeds to some extent. However, with a 30.9 hPa/169 km gradient, record wind speeds may be possible even with a more zonal track. On 10 Nov 1975 a 97.5 kPa (28.79" Hg) extratropical cyclone on an east-northeast path brought a 24 hPa/161 km (100 miles) gradient inland, which resulted in perhaps the highest gust ever recorded at Roseburg, 75 mph (120 km/h), this in a very narrow north-south valley that is a fairly wind-sheltered location.

Peak measured 1-minute winds during the 02 Oct 1967 extratropical cyclone that tracked through northwest Oregon reached 48 mph (78 km/h) at Salem. A fastest mile of 70 mph (113 km/h), equivalent to a 51-sec average, occurred at Portland. The storm brought a peak pressure gradient of 16.2 hPa/169 km, with a pressure slope of 228° indicating a low center well inland. Now bring in the 12 Mar 2012 low: sqrt(30.9/16.2) = 1.38. This suggests the potential for a 66 mph (106 km/h) peak 1-min wind at Salem, and a stunning 97 mph (156 km/h) 51-sec wind for Portland, speeds higher than the CDS.

Some things to consider about the scenarios presented here: They are modeled from a real storm that had a minimum central pressure of around 96.1 kPa (28.40" Hg). Deeper central pressures have occurred with a number of Pacific Northwest windstorms. The 09 Jan 1880 storm may have had a central pressure of 95.5 kPa (28.20" Hg) before landfall and tracked across extreme northwest Oregon to a position due north of Portland, this with a central pressure still deep enough to depress the barometric indicator to an all-time record low of 967.0 hPa (28.56" Hg) in the Rose City. The 14 Nov 1981 major classic windstorm had a minimum central pressure of at least 94.7 kPa (27.96" Hg) (Reed and Albright 1986). A number of extratropical cyclones have tracked in the vicinity of Astoria, including the 1880 storm, the CDS, and 05 Feb 1965. A strong extratropical cyclone on 27 Mar 1963 not only tracked inland very close to Astoria, but was also on a recurving path shifting from northeast to north-northeast at the time of closest approach. There is at least one historical storm that produced a stronger pressure gradient than the 12 Mar 2012 windstorm: The 03 Nov 1958 extratropical cyclone brought a truly phenomenal 19.8 hPa /100 km, or 33.4 hPa/169 km, pressure gradient into southwest Washington. In summary, the key elements in the presented scenarios are well within the realm of possibility.

There does appear to be a relationship between windstorm central pressure and peak gust speeds (Read 2015b), this despite some noise due to the magnitude of the background pressure field having an influence on the absolute central pressure value. For example, a 96.0 kPa storm in broad region of already low pressure may be equivalent--have the same total pressure difference from the edge of the storm to the center--to a 98.0 kPa storm in a region with higher overall background pressure. Regardless of the noise, the observed tendency for faster gusts around deeper lows likely reflects a trend of steepening pressure gradients as storm central pressure drops. Thus, it seems possible that an even more extreme windstorm than in the proposed scenarios could happen. A 94.7 kPa (27.96" Hg) extratropical cyclone such as the 14 Nov 1981 event tracking over Astoria as in Figure 3.1 could potentially have steeper gradients than the 12 Mar 2012 windstorm, and therefore generate even faster winds than the already extreme values presented above.

Focus has been on the Willamette Valley mainly because this is where the CDS brought the strongest winds to the interior lowlands. Scenarios that suggest wind speeds in excess of the CDS in the Willamette Valley also point to the possibility of exceedence in other regions affected by the CDS, such as the Puget Lowlands and the Lower Mainland.


4.0 Sumary and Conclusions


Pressure-wind triangles provide a much clearer picture of the pressure gradient than two-point (1D) systems. This is because the orientation of the pressure field is captured along with the pressure gradient magnitude that is perpendicular to the isobars, here called the absolute pressure gradient. Due to a pressure slope shifting into a favorable (unfavorable) alignment for higher readings, a 1D system can actually indicate an increasing (decreasing) pressure gradient after (before) the absolute gradient has peaked. As shown for the CDS, the EUG-PDX measure peaked an hour before the absolute pressure gradient reached its maximum.

Calculation of the absolute pressure gradients over the Willamette Valley for 27 historic storms shows that the CDS had the most extreme value. The pressure slope for classic-path windstorms tends to be aligned roughly southeast (135°) at peak gradient, and for storms tracking inland just north of the Willamette Valley southwest (225°). Both directions are off the ideal ~180° for southerly winds in the Valley, a fact that often mitigates peak winds during these windstorms.

The 12 Mar 2012 northern Vancouver Island extratropical cyclone brought to the coast a pressure gradient 1.66 times stronger than the CDS did over the Willamette Valley. In two hypothetical scenarios that track the 2012 low over Astoria, one with the storm moving north-northeast and the other east-northeast, estimations of peak wind speeds for the Willamette Valley are above the CDS. Calculations suggest that peak one-min winds could exceed 90 mph (145 km/h), with higher gusts. The two scenarios are well within the realm of possibility, as they use an extratropical cyclone from the historical record that had a deep but not near-record-low 96.1 kPa central pressure. This suggests that the peak winds for the CDS in the Willamette Valley could be exceeded at some point in the future, though such a windstorm would have a very low probability of occurrence. A storm with faster winds than the CDS would almost certainly cause catastrophic damage to trees, structures and the power grid.

Data Sources and Bibliography


Data Sources

Surface observations are from the National Climatic Data Center, the National Data Buoy Center and Environment Canada. Storm tracks are based on maps from the National Climatic Data Center and the US. Weather Prediction Center.

Peer-Reviewed References

Lynot, R. E. and O. P. Cramer, 1966: Detailed analysis of the 1962 Columbus Day windstorm in Oregon and Washington. Mon. Wea. Rev., 94, 105-117.

Read, W. A., 2015b: The Climatology and Meteorology of Windstorms That Affect Southwest British Columbia, Canada, and Associated Tree-Related Damage to the Power Distribution Grid. Doctoral dissertation, September 2015, 383 pp.

Reed, R. J. and M. D. Albright, 1986: A case-study of explosive cyclogenesis in the eastern Pacific. Mon. Wea. Rev., 114, 2297-2319.

Book References

Lange, O., 1998: The Wind Came All Ways. Environment Canada,122 pp.

Stull, R., 2015: Practical Meteorology. Published online by the author, 924 pp. Accessed December 4, 2015.

Other References

Read, W. A., 2015a: The Storm King: The Climatology and Meteorology of Windstorms That Affect the Cascadia Region of North America, Including the US. Pacific Northwest And Southwest British Columbia, Canada. Available online at the Office of the Washington State Climatologist.

Acknowledgements

Many thanks to Cliff Mass who reviewed an early draft of this essay and provided suggestions that very much strengthened the analysis.


Last Modified: December 16, 2015
Page Created: November 25, 2015

| Back |