A Rare Summer Windstorm on August 29, 2015

compiled by

Wolf Read


1.0 Introduction


1.1 Background

A paper I wrote on this windstorm, titled "Did Antecedent Hot and Dry Weather Contribute to An Unusual Level of Tree Damage During the 29 August 2015 Windstorm in the Lower Mainland of British Columbia?" appeared in the June 2016 issue of the Canadian Meteorological and Oceanographic Society Bulletin. The link leads to a PDF version of the article.

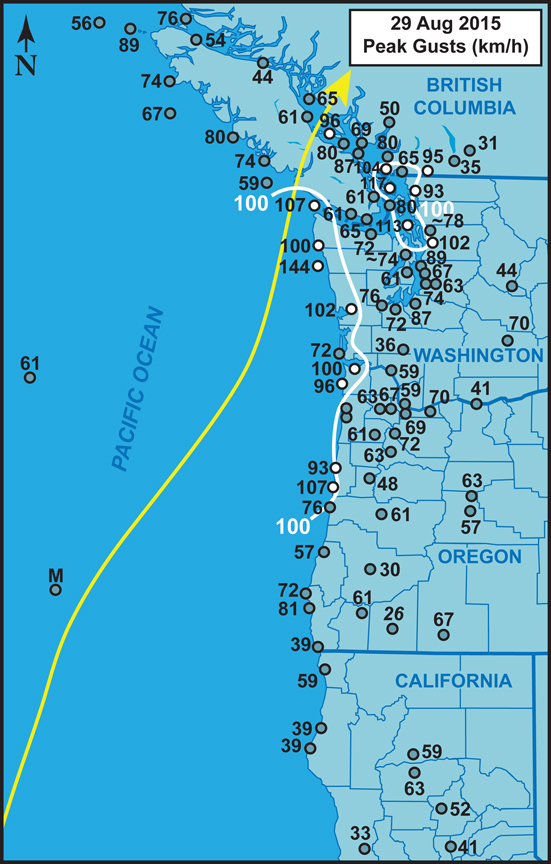
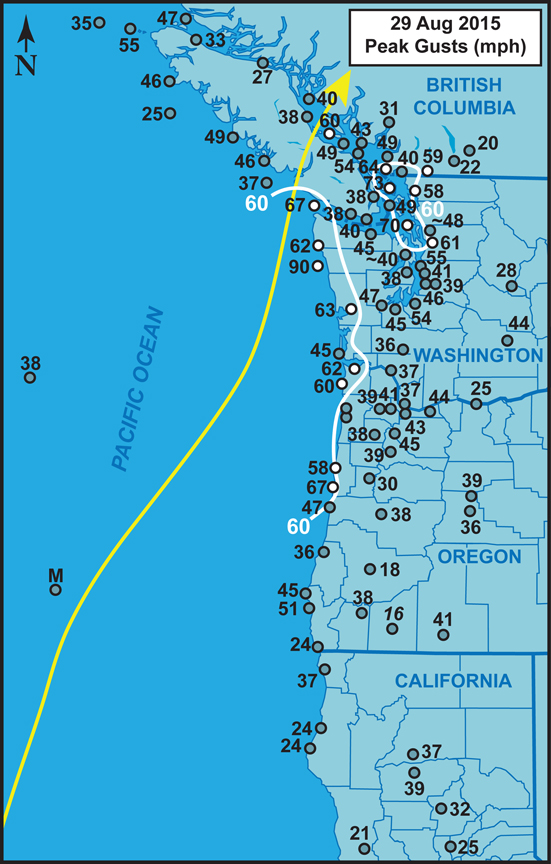
Figure 1.1 above Peak gusts (mph and km/h) for the August 29, 2015 windstorm. Wind speeds are largely from long-term surface airways weather observation sites, data buoys, lighthouses and C-MAN stations, with limited data from other networks (e.g. RAWS). Stations with long histories are preferred because of the research focus on intercomparison of historic storms. Numbers preceded by a tilde (~) represent the highest gust report in a dataset that has been interrupted at the height of the storm--usually data loss is from power outages. Values in italics are gusts estimated from peak wind, usually 2-minute or 5-minute, using a 1.3 gust factor. Stations with high-wind criteria gusts (≥58 mph or 93 km/h) are denoted with white-filled circles. Isotachs depicting ≥60 mph (~100 km/h) gusts are included to highlight the regions that had concentrations of the indicated magnitudes. The track of the extratropical cyclone center is shown (yellow arrow). Click on the map to see a larger version. Here is a map listing the station names.


More details are forthcoming.


2.0 Synoptic Analysis


2.1 Storm Track


Figure 2.1 above Storm track estimation largely based on surface maps provided by the US. NOAA Weather Prediction Center, and satellite photo interpretation. Faded blue track follows a secondary low-pressure center that followed very close to the primary low. Date and time in PST and central pressure in hPa (mb).


Data Sources and Bibliography


Data Sources

Surface observations are from the National Climatic Data Center, the National Data Buoy Center, Environment Canada and the University of Washington. Surface maps used for storm track determination are from the US. Weather Prediction Center. Upper-air analysis is based on maps from the US. National Center for Environmental Prediction. Satellite photos are from the US. National Weather Service. Upper-air sounding data are from the University of Wyoming Department of Atmospheric Science.

Last Modified: September 18, 2016
Page Created: September 18, 2016

| Back |