The December 21, 1982 Windstorm compiled by Wolf Read |
|
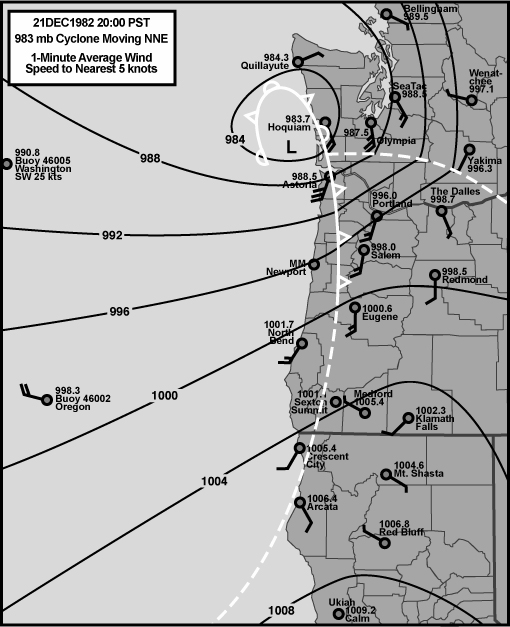
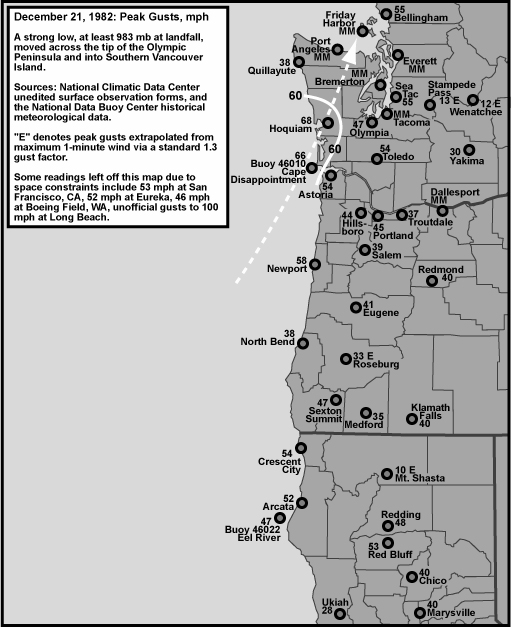
On December 21, 1982, a compact, but intense, 983 mb cyclone landed in the vicinity of Hoquiam and threw a strong gale across much of the Western Pacific Northwest. This was a deadly storm, with two fatalities and some injuries according to the NCDC's Storm Data for December 1982. A large tree smashed a mobile home in Ocean Shores and killed a woman, and another tree in the Tacoma area smashed a car, also killing a woman. Unofficial wind gusts of 100 mph lashed the Long Beach area, with some structural damage the result. At the offshore buoys, pressures fell to 984.9 mb at station 46002 off the Southwest Oregon coast at 06:00 on the 21st, and 988.0 mb at 46005 off the Southwest Washington coast at 14:00 PST on the 21st. Lowest pressure at buoy 46029 offshore of Cape Disappointment was 983.0 mb at 18:00 on the 21st. The December 21, 1982 cyclone was a secondary-spinup situation, the offspring of a strong low in the Gulf of Alaska. |
December 21, 1982: Some Meteorological Details |
Surface Map at 20:00 PST Sea level pressure and surface wind conditions are shown in Figure 2, below. The cyclone's fronts were generally weakly defined. The "warm" sector SE of the low center defines the region of strongest gradient. With a NNE track, this region was carried across Northwest Oregon and Southwest Washington as well as the Northwest Interior of the Evergreen State. The highest winds generally occurred in this sector, with a major kicker along the bent-back occlusion for areas along the South Washington Coast. Source: Hourly data are from the National Climatic Data Center, unedited surface observation forms. |
|
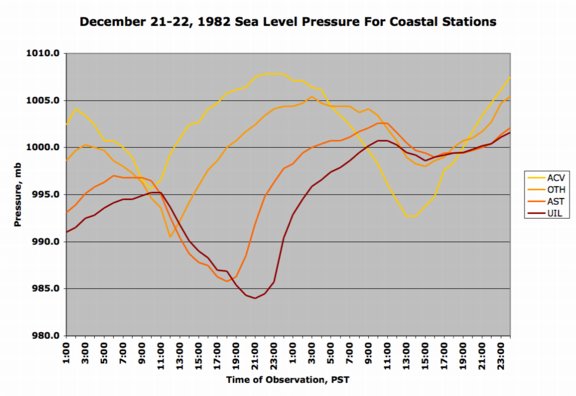
Sea-Level Pressure at Coastal Stations Sea-level pressure is plotted in Figure 3, below. Progressive "deepening" is evident south to north, a pattern typically seen for "classic" events that move north just offshore, such as the Columbus Day storm of 1962. Even though the low made landfall in Washington, the 1982 storm is put in the same category as the classics due to a strong northward motion to its track. Some storms, like December 12, 1995, exist in that gray area between categories, and 1982 is one of them. The sharp "V"-traces for the southern stations were enhanced by the storm's trailing cold front. The progression in pressure minimums is due, in part to an easterly component to the storm's track, which brought it closer to Astoria and Quillayute than the southern locations. The second dip, which is especially strong at Arcata, marks the passage of an intense cyclone into Northern California. This storm passed south of Arcata, very nearly over Ukiah, and was quite potent. Source: Hourly data are from the National Climatic Data Center, unedited surface observation forms. |
|
General Storm Data Table 1, below, lists the barometric minimums for the December 21, 1982 storm at selected sites. A fair number of Pacific Northwest windstorms have produced lower readings in the region, though for much of the region, the minimums are still quite low. Values of 29.00" to 29.25" might only occur at a Western Oregon station such as Portland about one to three times during a winter storm season, on average. Sometimes, barometers won't fall this low for an entire year. Source: Hourly data are from the National Climatic Data Center, unedited surface observation forms. |
Table 1 Notes: [1] Last of two hourly reports in a row with the same reading. [2] Last of two hourly reports in a row with the same reading. [3] Last of three hourly reports with the same reading; the other times were 21:00 and 23:00 on the 21st. |
Table 2, below, lists the maximum gradients for some standard measures during the December 21, 1982 cyclone. These values are strong, but not extreme. Source: Hourly data are from the National Climatic Data Center, unedited surface observation forms. |
Table 2 Notes: [1] Last of two occurences. |
A key measure for storms that track across the Olympic Peninsula and/or South Vancouver Island is the PDX-BLI gradient. Table 3, below, ranks a number of memorable, and not-so-memorable, storms by this measure. The December 21, 1982 windstorm ranks 13th on this table. Sources: National Weather Service, Eureka, Portland and Seattle offices, METAR reports, and the National Climatic Data Center, unedited surface observation forms (for historical storm pressure data). |
| ||||||||||||||||||||||||||||||||||||||||||||||||||||||||||||
Pressure Tendencies The December 21, 1982 windstorm brought with it a modest "pressure couplet" over much of Western Oregon and Washington. Strong pressure surges (+3.0 mb and higher) were generally concentrated to the north. Table 4, below, shows the maximum hourly changes in pressure for eleven key stations in the Pacific Northwest. Overall, the values are a fairly good showing compared to many wind events. This storm was quite progressive. Medford had an unusually active barometer, especially compared to surrounding stations. Source: Microfilm copies of the unedited surface observation forms, obtained from the National Climatic Data Center. |
|
||||||||||||||||||||||||||||||||||||||||||||||||||||||||||||||||||||||||||||||||||||||||||
Table 4 Notes: [1] The +3.4 mb hourly rise at Olympia is the last of two occurrences, the other instance having occurred at 22:00. |
Table 5, below, lists the peak wind and gust for eleven key stations in the Pacific Northwest, their direction, and their time of occurrence. "Peak Wind" is a 1-minute average, and "Peak Gust" is an instant reading. By my own personal methodology, a wind event rates the term "windstorm" when the average peak gust of these eleven stations reaches 39.0 mph (gale force) or higher. The December 21, 1982 windstorm exceeded this value by enough margin to just make it into moderate windstorm category. Moderate windstorms have an average of 45.0 to 54.9, and major windstorms are those that reach or exceed 55.0. Only a handful of storms have made the majors, including December 12, 1995, November 14, 1981 and October 12, 1962. Source: Hourly data are from the National Climatic Data Center, unedited surface observation forms. |
| Location | Peak |
Direction |
Obs Time of |
Peak |
Direction |
Obs Time of |
| California: | ||||||
| Arcata | 35 |
140 |
10:53 HRS, 21st |
52 |
140 |
10:53 HRS, 21st |
| Oregon: | ||||||
| North Bend | 23 |
140 |
12:55 HRS, 21st |
38 |
210 |
14:57 HRS, 21st |
| Astoria | 37 |
200 |
19:47 HRS, 21st |
54 |
180 |
19:19 HRS, 21st |
| Medford | 20 |
240 |
15:51 HRS, 21st |
35 |
230 |
14:05 HRS, 21st |
| Eugene | 28 |
180 |
14:50 HRS, 21st |
41 |
180 |
15:27 HRS, 21st |
| Salem | 29 |
180 |
15:56 HRS, 21st |
39 |
180 |
16:32 HRS, 21st |
| Portland | 32 |
170 |
18:50 HRS, 21st |
45 |
180 |
18:10 HRS, 21st |
| Washington: | ||||||
| Quillayute | 23 |
230 |
23:56 HRS, 21st |
38 |
230 |
23:56 HRS, 21st |
| Olympia | 29 |
180 |
21:54 HRS, 21st |
47 |
220 |
23:13 HRS, 21st |
| Sea-Tac | 36 |
180 |
22:03 HRS, 21st |
55 |
180 |
22:14 HRS, 21st |
| Bellingham | 30 |
180 |
01:56 HRS, 22nd |
55 |
170 |
00:33 HRS, 22nd |
| AVERAGE | 29.3 |
184 |
45.4 |
191 |
|
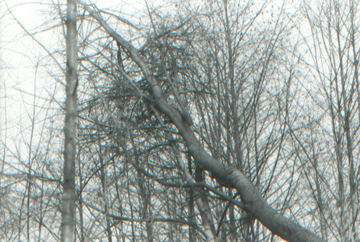
Some Tree Damage Photos I took the images below with a 35 mm SLR shortly after the December 21, 1982 windstorm struck my home. The location is in eastern Renton, WA, in the highlands along the rim of the Kent Valley. The top image shows a snapped birch tree, probably a foot DBH, caught in the tops of nearby trees. The bottom image shows an alder tree snapped clean, perhaps 8 to 10 feet above ground level. Tree breakage was fairly widespread in and around my neighborhood, with a higher frequency of stem failures than in some later windstorms, including the Thanksgiving Day storm of 1983. |
|
|
Last Modified: September 6, 2004 You can reach Wolf via e-mail by clicking here. | Back | |