January 29-30, 2004 Minor Windstorm

compiled by

Wolf Read

A strong cold front trailing south of a deepening low slammed into the Pacific Northwest around midnight from January 29-30, 2004. For much of Oregon, strong, gusty winds were associated with the frontal boundary, often reading 35 to 45 mph in gusts, sometimes higher. These winds typically did not last long, say 10 to 20 minutes, and were associated with a period of heavy rain. As the low moved inland and deepened to 986 mb over Southern British Columbia, tight gradients were carried over Northwest Oregon and Western Washington behind the front. A second round of wind resulted, generally weaker than the frontal winds in Oregon, but stronger in Washington, with gusts into the 50 mph range in places. Though it didn't affect the Seattle area as strongly, this storm had similar effects to the December 27, 2002 event for much of the Western Pacific Northwest.

Here's what I noted about this storm in my journal:

January 29, 2004: Thursday

16:50 PST: (Corvallis, OR) A deepening low, and a complex one, that NWS Seattle put at 46 N / 130 W at 13:30 is continuing on an eastward track toward Hoquiam. The low was at least 997 mb at 13:30. Probably near 995 mb now. Strong trailing cold front, and strong pressure gradients, moving in. South winds already up on the coast: SW G 39 mph at Newport (barometer 29.93" falling), SW G 32 mph at Astoria (29.73"), S G 35 mph Hoquiam (29.69") and S G 28 mph at Quillayute (29.54") at 16:00. Notice the already low pressures in Washington. At Paine Field in Everett gusts are reaching S 37 mph with 29.61" and falling, and Sea-Tac G 28 mph with 29.67". Low expected to move ashore between 22:00 and 00:00, maybe over Bellingham around 06:00. Looks like I'll be up late. 16:59 PST.

18:12 PST: (Albany, OR) At home now, preparing for storm. Outside, partly cloudy, lots of low broken stratus with a vivid half moon visible in the breaks. Some high clouds evident. Warm! Very warm, and barometer starting to fall quickly. Current: 54.1 F, 51 DP, 89% RH, 29.84" FR, SSE S SSW 10 mph gusting 21 mph last 15 minutes--22 mph seen on the Vigilant. Rain for day at 0.25", most of which fell this morning. Baro was 30.00" at 11:00, then started to fall. Fell 0.03" last hour (17-18:00). 18:17 PST.

19:56 PST: The 19:00 surface analysis shows a more complex double low structure with the lead low maybe 100 miles W of the top of the Olympic Peninsula, and the trailing low just south of buoy 46005 (315 nm W of Aberdeen). An occluded front connect the two. The trailing low is quite visible on the sat pix, with a nice bent-back occlusion. The lead low is buried in the cloud shield. That was at 16:00. Things are progressing quickly. The trailing low definitely passed south of buoy 46005. The baro there is 29.60" and rising rapidly at 0.05"/hr. Winds are now NNW, after being N during the three previous observations, and NNE before that. Low pres 29.43" at 15:00. Highest gusts were about 37 knots (N) at 17:00--not particularly strong, but this station is north of the low. Temp is at 43.3 F--cool, but not super cold. On the coast, wind gusts at Newport, Astoria and Hoquiam have been reaching 40 to 45 mph in the past few hours. At 19:55, Astoria shows S 22 mph gusting 43 with a peak to 47 and a barometer at 29.62". Hoquiam at 19:53 shows S 31 G 40 mph, with a peak of 47 mph at 18:55, and baro 29.57" with 51 F. Inland, Salem is showing SSW 21 G 29 mph and 29.76" F. Pressures falling fairly good across the region. Quillayute is down to 29.47", with rain and mist, at 19:13 PST.

Locally, we've got scattered scud, with a possible higher cloud shield--hard to see in the dark. 53.1 F, 48 DP, 84% RH, 29.76" F, S SSW 8 mph gusting 19 last 15 minutes with gusts to 25 last hour. Baro fell 0.04" 19:00 to 20:00. 20:17 PST.

20:19 PST: High wind warning on coast--for west wind of 25 to 35 mph with gusts around 65 near coastal headlands. Winds shift NW and drop to 15 to 25 mph around midnight, according to this forecast. Just looked at a more recent 19:40 issuance. Now they're saying south, and the winds are expected to continue into the early morning hours for the front is still far offshore. Still only saying 15 to 25 mph and gusty for our area. Aside from the high wind warning, there are winter storm warnings for the Coast Range and Cascades, plus flood warnings for a number of Willamette Valley counties including Benton and Marion. 20:26 PST.

22:37 PST: Barometer dropping like a rock: 29.62" now. At 22:00 was 29.67"! Falling rapidly. I think this storm is serious business, so I'm camping out up here in the office. Winds are SSE to S at 10 mph gusting 17 last 39 minutes. 53.2 F, 48 DP, 83% RH. Cloudy, stratus. 22:40 PST.

22:59 PST: Doppler shows heavy rain band about to reach my location, covering the Coast Range (Figure 2, below). Already over McMinnville--gusts to 41 mph there at 22:53! My barometer is at 29.59"--that's 0.08" / last hour. Rain beginning here. Now at 0.26" for the day. The storm is about to pounce! Astoria had heavy rain last hour, peak 47 mph, baro now at 29.50", wind out of 200 deg 21 G 26 mph peak 45 at 22:55. Newport peaked at 53 mph so far (21:30) with a barometer at 29.63" at 22:30. Salem at 22:56 was 29.56" and falling rapidly (0.08" / hr), wind 190 deg 20 mph and a temperature of 53 F. Fore here, currently: 52.5 F, 49 DP, 86% RH, 29.59" falling rapidly, SSE to S 7 mph gusting 17 last 10 minutes, 0.27" rain for day, light rain falling. 23:10 PST.


Figure 2: Doppler radar of the storm's cold front, which is draped over the Coast Range and just beginning to move into the Willamette Valley. This image was taken at 22:50 PST.


23:55 PST: Instant gusts 38 and 40 mph on the Maximum Vigilant, at least 34 mph (2.5-second wind) on the Davis. Winds just picked up . . . 44 mph on the Vigilant! Slamming! Sustained gust of 35 mph. Moderate rain. Peak 37 mph on the Davis. 29.59" on the barometer. 0.43" rain for the day and 49.2 F. Video camera going. Gust 37 Vigilant. Another 37. Barometer jumping: 29.64" 23:59 PST.


Figure 3: Water vapor satellite image of the storm taken at midnight, right at the time the strongest winds blew through my location.


January 30, 2004: Friday

00:08 PST: Wind calming. Had a gust to 38 mph last five minutes, out of the WSW now. The Davis' 10-minute average wind peaked at 21 mph, and is now 19. The temperature is way down now, at 44.9 F, with a 42 F dew point. Rain since 00:00 is 0.08". The video camera has the whole wind sequence from the Vigilant. I reported the strong wind gusts to Skywarn. Very brief wind episode, though. Barometer still at 29.64"--this storm might double-dip. Could be more wind later on as the low moves inland. Still raining. 0.09" on this new day. 00:13 PST.


Figure 4: The storm's cold front had moved across much of the Willamette Valley by 00:11 PST on January 30, 2004.


00:34 PST: Yep, this storm might not be done. Pressures at Quillayute and Bellingham at 29.27" and still falling. The double low is just moving into northwest Washington, and appears to be deepening still. We'll see if S to SW winds don't pick up as the low passes to the north of us. Now analyzed as a 991 mb system (22:00 PST analysis). 00:43 PST.

21:45 PST: Troutdale appears to have had the highest 5-second gust in the Willamette Valley, with 46 mph. The low deepened to 986 mb before moving across southwest British Columbia. The gradient tightened up as the low trekked in behind the front, and our winds went back up for awhile, with more rain. Between 02:00 and 04:00, 10-minute average winds escalated to 11 mph with gusts to 27 out of the south, with the Vigilant showing at least one gust to 30 mph. Gradients were stronger over Washington, and many places were feeling 30 to 40 mph 5-second gusts, with Shelton hitting 51 mph and Whidbey Island showing 59 mph. My maximum 1-hour pressure rise was 0.08" from 23:40 to 00:40. The pressure trace is a nice, sharp "V".


Locally, the wind didn't do much save throw some lawn furniture around along with a garbage container. On Oregon State University campus, there were many new twigs and small branches down. Couldn't tell if most of it was material broken and weakened during the early January ice storm. In Salem, an oak was snapped and fell on a home, damaging the structure. Small power outages occurred in the valley, including Corvallis. I'm not surprised by this--I saw the power fluctuate a few times here. Also on campus, some free-standing signs were blown over.

At my location, 0.31" of rain fell from 23:40 to 00:40--a fairly hefty hourly total! Peak 10-minute rainfall was 0.08" ending at 00:10.

Most of today we were in a showery pattern. Some cells had pretty deep development and made nice towers and anvils. I saw mammatus to the SSW on the Highway 34 commute this morning. Hail struck campus in the early afternoon. Currently: 38.8 F, 37 F DP, 92% RH, 30.12" rising slowly, S to SSW 4 mph gusting 7 last 15 minutes. Partly cloudy, stratus. Rain today so far 0.49", yesterday's total 0.44". 22:16 PST.


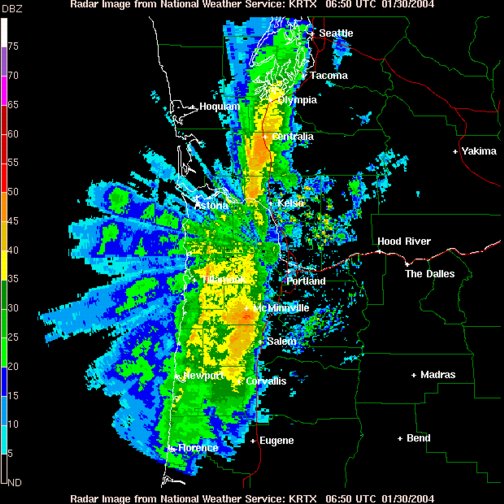
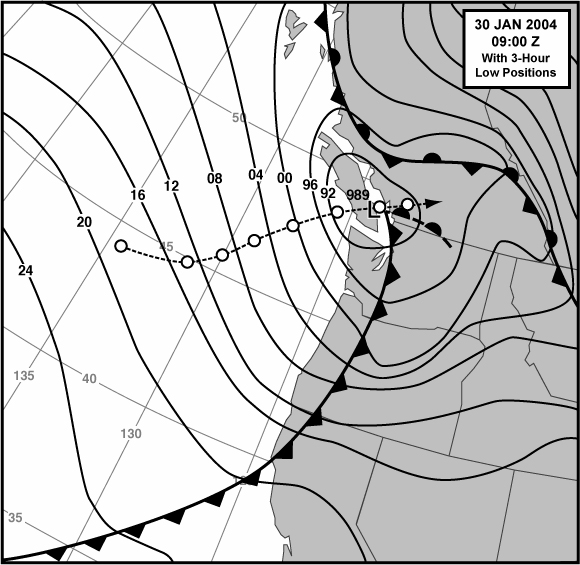
January 29-30, 2004: Meteorological Details

The surface map for 01:00 HRS PST is shown in Figure 5, below. These are the conditions approximately one hour after my peak gust of 44 mph (23:57). Note the closely-packed isobars along the cold front, especially in Oregon. The isobars are oriented almost west-east over the region, a nearly ideal situation for strong ageostrophic (jumping the gradient) winds in the south-to-north trending valleys, such as the Willamette.


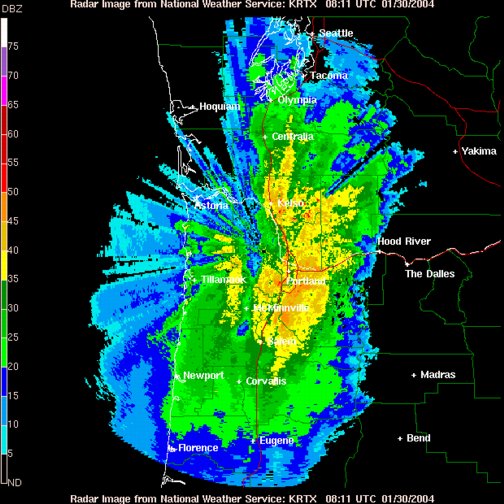
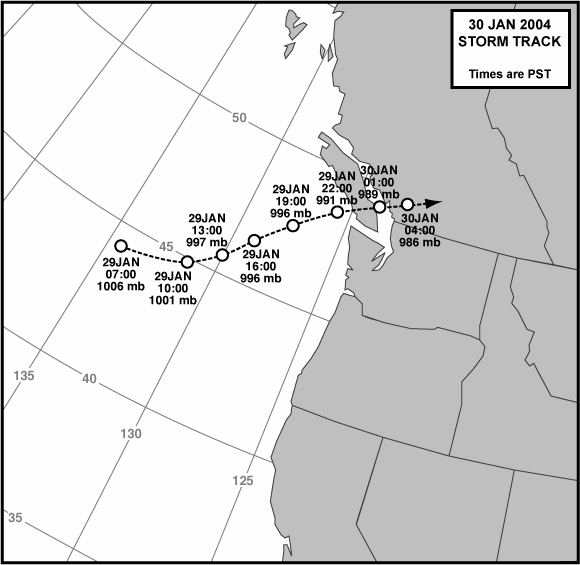
Figure 6, below, adds further detail on the storm's progress across the Pacific Ocean. Interestingly, the cyclone appears to have continued deepening even as it moved inland, reaching its strongest over Southwest British Columbia. The low center began to fill after 04:00 PST on January 30, 2004.

This track does not show the low's double structure from about 16:00 PST on the 29th to 22:00 PST. The circles indicate the position of the trailing low of the pair--it followed right on the heels of the lead low, which depressed barometers early across much of Western Washington.


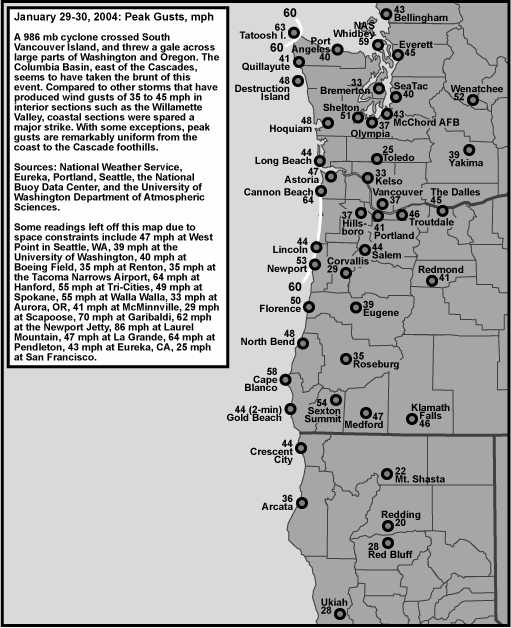
General Storm Data

Table 1, below, lists the barometric minimums for the January 29-30, 2004 storm at selected sites. Many Pacific Northwest windstorms have produced lower readings. These values are similar to the December 27, 2002 windstorm. The most depressed pressures during this storm were along the tip of the Olympic Peninsula, and included 29.17" at 00:00 on the 30th at Tatoosh Island.

Sources: National Weather Service, Eureka, Portland and Seattle offices, METAR reports, and the National Data Buoy Center, realitime meteorological data.

Location

Lowest
Pressure

Approx Time
of Lowest Pressure

California:    
Arcata

29.97"

00:00 HRS, 30th

Oregon:    
North Bend [1]

29.71"

00:00 HRS, 30th

Astoria [2]

29.50"

01:00 HRS, 30th

Medford

29.75"

00:00 HRS, 30th

Eugene

29.62"

23:00 HRS, 29th

Salem

29.56"

23:00 HRS, 29th

Portland

29.53"

00:00 HRS, 30th

Washington:    
Quillayute [3]

29.28"

01:00 HRS, 30th

Olympia

29.41"

00:00 HRS, 30th

Seattle (Sea-Tac)

29.38"

00:00 HRS, 30th

Bellingham

29.25"

03:00 HRS, 30th

     
AVERAGE

29.54"


Table 1 Notes:

[1] Last of two occurrences, the other having happened the hour before.

[2] Last of three occurrences, the others happening at 22:00 and 23:00 on the 29th.

[3] Last of two occurrences, the other having happened the hour before.

[4] Last of three occurrences, the others happening at 01:00 and 02:00 on the 30th.

Table 2, below, lists the maximum gradients for some standard measures during the January 29-30, 2004 cyclone. The readings aren't particularly strong, and are generally similar to the December 27, 2002 windstorm.

Sources: National Weather Service, Eureka, Portland and Seattle offices, METAR reports, the National Data Buoy Center, realitime meteorological data, and the National Climatic Data Center, unedited surface observation forms (for historical storm pressure data).

Location

Max Gradient, mb

Approx Time
of Max Gradient

Coast:    
ACV-OTH

+10.5

03:00 HRS, 30th

OTH-AST

+9.9

01:00 HRS, 30th

AST-UIL

+7.9

00:00 HRS, 30th

ACV-AST [1]

+18.5

02:00 HRS, 30th

OTH-UIL

+17.4

01:00 HRS, 30th

Interior:    
MFR-EUG

+8.4

23:00 HRS, 29th

EUG-PDX

+5.3

01:00 HRS, 30th

PDX-SEA

+7.1

02:00 HRS, 30th

SEA-BLI

+6.5

03:00 HRS, 30th

AST-DLS

-4.9

22:00 HRS, 29th

Table 2 Notes:

[1] Last of two hourly occurrences, the other having happened the hour before.

Another measure for storms that track across the Olympic Peninsula and/or South Vancouver Island is the longer PDX-BLI gradient. Table 3, below, ranks a number of memorable, and not-so-memorable, storms by this measure. The January 29-30, 2004 storm ranks a meager 12th place in this incomplete list of windstorms from 1934 to present. The +22.7 mb gradient (+0.67") for the October 21, 1934 storm was taken from spotty pressure data, and could have been higher--the mark of one of the top most powerful storms of the 20th century.

Sources: National Weather Service, Eureka, Portland and Seattle offices, METAR reports, and the National Climatic Data Center, unedited surface observation forms (for historical storm pressure data).

PDX-BLI Gradients For Big Storms in History

Storm

Peak Grad, mb

Time/Day

Oct 21, 1934

+22.7

15:00 HRS, 21st

Dec 12, 1995

+22.0

21:00 HRS, 12th

Jan 20, 1993

+21.5

11:00 HRS, 20th

Nov 24, 1983

+17.8

14:00 HRS, 24th

Oct 12, 1962

+17.7

00:00 HRS, 13th

Nov 13-14, 1981

+17.0

11:00 HRS, 14th

Jan 16-17, 1986

+16.9

23:00 HRS, 16th

Mar 25-26, 1971

+15.1

12:00 HRS, 26th

Feb 12-13, 1979

+15.0

05:00 HRS, 13th

Jan 19-20, 1964

+14.3

17:00 HRS, 19th

Dec 14-15, 1977

+14.0

17:00 HRS, 15th

Jan 30, 2004
+13.8
03:00 HRS, 30th
Oct 26-27, 1950

+13.8

04:00 HRS, 27th

Dec 22, 1955

+13.2

15:00 HRS, 22nd

Dec 27, 2002

+12.1

11:00 HRS, 27th

Nov 15, 1981

+12.1

17:00 HRS, 15th

Apr 13-14, 1957

+11.3

18:00 HRS, 14th

Dec 21, 1955

+10.2

20:00 HRS, 21st


Pressure Tendencies

The January 29-30, 2004 event, interestingly, favored the Western Oregon interior with the strongest pressure changes. Quite possibly the Coast Range gave the cold front an extra kick of instability that may have contributed to the stronger pressure falls compared to those on the coast. The tendency for the maximum hourly fall to be around 23:00 and 00:00 and maximum hourly rise to be around 01:00 to 02:00 marks the strong, fast-moving, frontal system, which nearly paralleled the coast.

Source: National Weather Service, Eureka, Portland and Seattle offices, METAR reports, and the National Climatic Data Center, unedited surface observation forms (for historical storm pressure data).


Maximum Pressure Tendencies for the January 29-30, 2004 Storm

Location

Max
Hrly
Fall
mb

Time of
Max Fall
PST

Max
Hrly
Rise
mb

Time of
Max Rise
PST

California:        
Arcata [1]

-1.5

21:00 HRS, 29th

+2.6

01:00 HRS, 30th

Oregon:        
North Bend

-1.9

22:00 HRS, 29th

+3.0

01:00 HRS, 30th

Astoria

-2.1

22:00 HRS, 29th

+2.5

04:00 HRS, 30th

Medford

-3.8

00:00 HRS, 30th

+4.3

02:00 HRS, 30th

Eugene

-3.3

23:00 HRS, 29th

+3.2

01:00 HRS, 30th

Salem

-2.7

23:00 HRS, 29th

+2.7

01:00 HRS, 30th

Portland

-3.2

23:00 HRS, 29th

+2.3

02:00 HRS, 30th

Washington:        
Quillayute [2]

-2.0

13:00 HRS, 29th

+2.6

05:00 HRS, 30th

Olympia

-2.5

22:00 HRS, 29th

+2.5

04:00 HRS, 30th

Seattle (Sea-Tac)

-3.3

23:00 HRS, 29th

+2.0

06:00 HRS, 30th

Bellingham

-2.5

17:00 HRS, 29th

+3.3

06:00 HRS, 30th

         
AVERAGE

-2.6


+2.8


Table 4 Notes:

[1] The -1.5 mb hourly fall at Arcata is the last of two occurrences, the other having occurred in the hour before.

[2] Pressure data missing at Quillayute for about four hours before minimum and during the time of max hourly falls at other coastal stations; the -2.0 maximum hourly fall may be low.


Table 5, below, lists the peak wind and gust for eleven key stations in the Pacific Northwest, their direction, and their time of occurrence. "Peak Wind" is a 2-minute average, and "Peak Gust" is a 5-second average. By my own personal methodology, a wind event rates the term "windstorm" when the average peak gust of these eleven stations reaches 39.0 mph (gale force) or higher. The January 29-30, 2004 cyclone just made the cut, and is a minor windstorm. Moderate windstorms have an average of 45.0 to 54.9, and major windstorms are those that reach or exceed 55.0. Only a handful of storms have made the majors, including December 12, 1995, November 14, 1981 and October 12, 1962.

Note that the newer 5-second gust adopted by the NWS alters the meaning of the kind of storm ranking system I describe here. See "Adjustments to Modern Storms."

Sources: National Weather Service, Eureka, Portland and Seattle offices, METAR reports.

Location

Peak
Wind
mph

Direction
Pk Wnd
degrees

Obs Time of
Peak Wind
PST

Peak
Gust
mph

Direction
Pk Gst
degrees

Obs Time of
Peak Gust
PST

California:            
Arcata

26

270

00:56 HRS, 30th

36

260

00:45 HRS, 30th

Oregon:            
North Bend

30

260

23:15 HRS, 29th

48

260

23:15 HRS, 29th

Astoria

31

190

16:55 HRS, 29th

47

180

21:44 HRS, 29th

Medford

32

230

00:44 HRS, 30th

47

210

00:53 HRS, 30th

Eugene

22

180

22:54 HRS, 29th

39

230

00:54 HRS, 30th

Salem

24

200

23:56 HRS, 29th

44

220

00:56 HRS, 30th

Portland

23

260

00:35 HRS, 30th

41

260

00:35 HRS, 30th

Washington:            
Quillayute

23

270

04:37 HRS, 30th

47

290

05:53 HRS, 30th

Olympia

25

230

00:12 HRS, 30th

37

230

00:12 HRS, 30th

Sea-Tac

25

230

09:56 HRS, 30th

40

230

05:56 HRS, 30th

Bellingham

35

180

03:53 HRS, 30th

43

180

03:53 HRS, 30th

             
AVERAGE

26.9

227


42.6

232


Last Modified: March 19, 2004
Page Created: February 10, 2004

You can reach Wolf via e-mail by clicking here.

| Back |