A Sudden Gale in Oregon on March 1, 1974 compiled by Wolf Read |
|
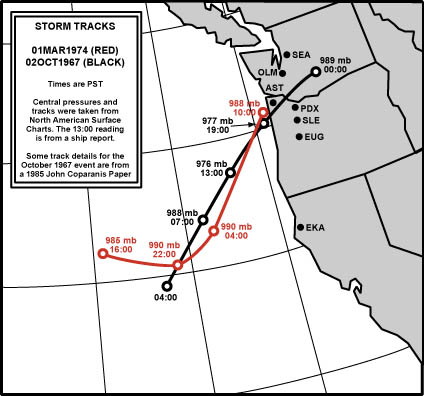
| The fast-moving cyclone of March 1, 1974 followed a path similar to the powerful storm of October 2, 1967, and dove ashore on the northwest tip of Oregon with a strong easterly component to its motion. Due to a weaker nature--suggested by a central pressure of 988 mb at landfall verses the 977 mb of the 1967 event--the 1974 storm did not produce winds as strong as its earlier cousin. Indeed, winds might not have been as strong as they were had the 1974 storm not suddenly accelerated up the Oregon Coast. Examination of Figure 1, below, which depicts storm tracks for the 1967 and 1974 storms and the 6-hour low center positions, shows the 1974 low's sudden curve to the NE with nearly a doubling in speed compared to the three previous observations. This rapid motion could have conributed to the peak wind velocities in Oregon and California. The initial ESE track of the 1974 storm, with a quick turn NE, is a clear example of a cyclone following what initially appeared to be a benign low-wind path for Oregon, with a quick reversal of the situation to one with high-wind potential. Situations like these make Pacific Northwest weather forecasting quite challenging at times. |
|
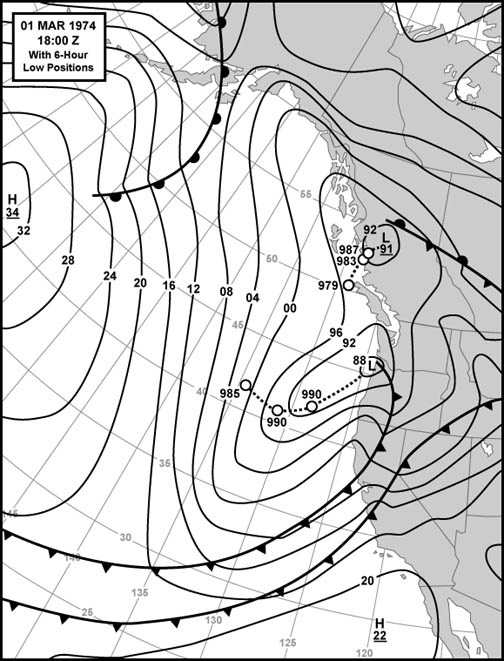
Figure 2, below, shows the surface weather conditions over the Northeast Pacific at the time the March 1, 1974 cyclone was making landfall, at 18:00 UTC (10:00 PST). One key feature is the weakening low drifting ashore in British Columbia at the time of the 1974 storm's direction change and rapid acceleration. Closely associated lows tend to circle around each other, like binary stars orbiting their common center of mass. On March 1, 1974, it appears that the southern cyclone was given incentive to change dirction, and a boost of speed, as it moved in the base of the northern storm. Another way to look at this is that the presence of the northern low created a trough of low pressure over the Pacific Northwest that the southern low could more easily move through--high pressure to the south, in essence, shielded California. Low's tend to follow the path of least resistance. Another effect of the two closely-associated storms was to minimize south-to-north pressure differentials over Washington, which resulted in light winds over most of the state. Source: The original map was obtained from the Oregon Climate Service. |
|
Storm Data Minimum Pressures and Peak Gradients Table 1, below, lists the lowet barometric pressures achieved during the March 1, 1974 storm for 11 Pacific Northwest locations. There's a nice progression of minimum pressure times from south to north with this storm, an indicator of the strong northward component to the low's motion. Though these pressures are fairly low, none are records, not even for the month of March. Source: all pressure data is from the National Climatic Data Center, unedited surface observation forms. |
|
Table 2, below, lists the maximum pressure gradients achieved during the March 1, 1974 storm for 10 Pacific Northwest measures. Though these gradients are somewhat strong, none of them a particularly noteworthy. In fact, the coastal measures are somewhat wimpy compared to many storms, and only the MFR-EUG and EUG-PDX gradients in the interior have the expected strength for a decent windstorm, and even these are a bit on the low end. This is one reason why the storm's rapid northeast motion had been suggested as a contributor to the strong winds in Oregon. As the storm moved inland, gradients went negative north of the Oregon border, with peaks of -3.6 mb at 12:00 for the AST-UIL measure, -2.6 at 08:00 for the PDX-SEA measure, and -1.9 at 12:00 for the SEA-BLI measure. The maximum positive gradients listed below for these measures happend in the evening, after the cyclone moved east of the Cascades and a long trough of low pressure moved inland behind the storm. Source: all pressure gradient data is calculated from hourly readings obtained from the National Climatic Data Center, unedited surface observation forms. |
|
Pressure Tendencies Table 3, below, lists the maximum hourly pressure falls and rises achieved during the March 1, 1974 storm for 11 Pacific Northwest stations. The strongest pressure tendencies were over Western Oregon, with peak hourly drops of -2.7 to -3.1 mb (-0.08" to -0.09") and maximum hourly climbs of +2.3 to +3.9 mb (+0.07" to +0.12"). Save for the extreme Northwest tip of Oregon, this is where the strongest winds were encountered. Pressure changes in Washington, with drops of -1.4 to -2.9 mb (-0.04" to -0.09") and rises of +1.4 to +2.2 mb (+0.04" to +0.06") were generally less than those witnessed in Oregon, though the values were still indicative of a strong winter storm. The southern track into Northwestern Oregon spared the Washington regions damaging winds. Source: all pressure gradient data is calculated from hourly readings obtained from the National Climatic Data Center, Unedited Surface Observation Forms. |
| ||||||||||||||||||||||||||||||||||||||||||||||||||||||||||||||||||||||||||||||||||||||||||
Table 3 Notes: [1] The -1.4 mb hourly fall is the last of four occurrences. |
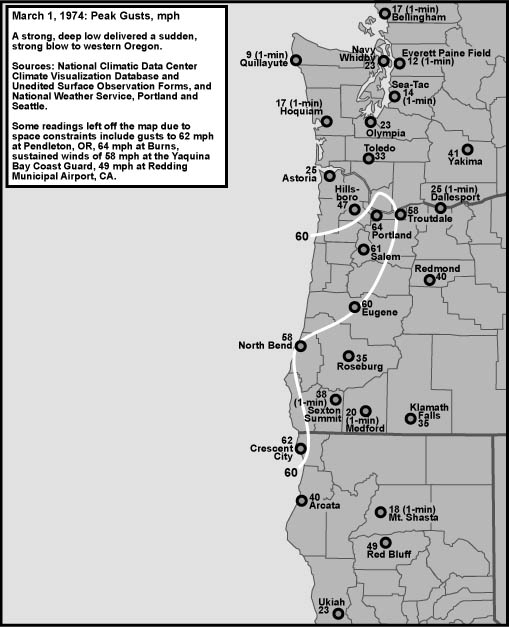
Peak Wind and Gust Table 4, below, lists the peak wind and gust for eleven key stations in the Pacific Northwest, their direction, and their time of occurrence. "Peak Wind" is a 1-minute average, and "Peak Gust" is an instant (approximately 1-second) average. By my own personal methodology, a wind event rates the term "windstorm" when the average peak gust of these eleven stations reaches 39.0 mph (gale force) or higher. The March 1, 1974 storm, with a ranking of 38.1 technically, didn't make the windstorm cut, though it was close. This is one of those rare cases where a localized wind event got strong enough to be interesting. Another example would be the February 7, 2002 South Valley Surprise cyclone that produced gusts to 70 mph at Eugene, yet only ranked a 34.6 overall. The March 1, 1974 windstorm is a case where the Willamette Valley literally took the brunt of the storm, even when compared to coastal stations. This is a rare event, maybe even unique in the 1950-present timeframe. For Washington, winds were downright light in some areas. Bellingham's strongest winds occurred long before maximum winds in other parts of the state, during a north-northeast breeze that set up as northeasterly gradients briefly strengthened before the the arrival of the two cyclones, one to the north and the other to the south, evened out pressure differences in the region. Sources: Wind data is from the National Climatic Data Center, undedited surface observation forms. |
| Location | Peak |
Direction |
Obs Time of |
Peak |
Direction |
Obs Time of |
| California: | ||||||
| Arcata | 29 |
200º |
06:15 HRS, 1st |
40 |
200º |
06:15 HRS, 1st |
| Oregon: | ||||||
| North Bend | 25 |
210º |
09:30 HRS, 1st |
58 |
210º |
08:40 HRS, 1st |
| Astoria | 16 |
260º |
15:56 HRS, 1st |
25 |
260º |
15:56 HRS, 1st |
| Medford | 20 |
210º |
09:57 HRS, 1st |
29 |
320º |
08:43 HRS, 1st |
| Eugene | 37 |
180º |
10:55 HRS, 1st |
60 |
170º |
10:01 HRS, 1st |
| Salem | 38 |
190º |
11:56 HRS, 1st |
61 |
190º |
12:12 HRS, 1st |
| Portland | 39 |
200º |
13:55 HRS, 1st |
64 |
200º |
12:29 HRS, 1st |
| Washington: | ||||||
| Quillayute [1] | 9 |
300º |
16:57 HRS, 1st |
12 |
300º |
16:57 HRS, 1st |
| Olympia | 17 |
220º |
18:55 HRS, 1st |
23 |
230º |
17:55 HRS, 1st |
| Sea-Tac | 14 |
210º |
21:55 HRS, 1st |
25 |
230º |
21:15 HRS, 1st |
| Bellingham [2] | 17 |
030º |
10:55 HRS, 1st |
22 |
030º |
10:55 HRS, 1st |
| AVERAGE | 23.7 |
201º |
38.1 |
213º |
Table 4 Notes: [1] Wind velocity was too slow for gusts to be noted at Quillayute, and a peak gust was estimated from the fastest 1-minute reading by using a standard 1.3 gust factor. [2] Wind velocity was too slow for gusts to be noted at Bellingham, and a peak gust was estimated from the fastest 1-minute reading by using a standard 1.3 gust factor. |
Footnotes 1974 |
References 1974 |
Last Modified:February 25, 2003 You can reach Wolf via e-mail by clicking here. | Back | |