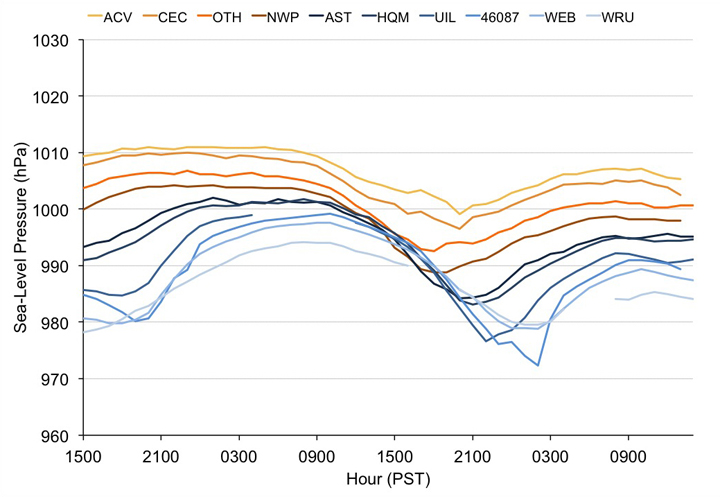
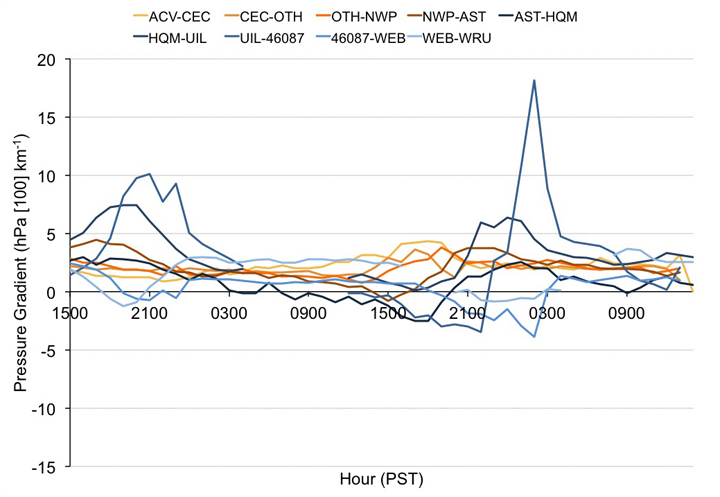
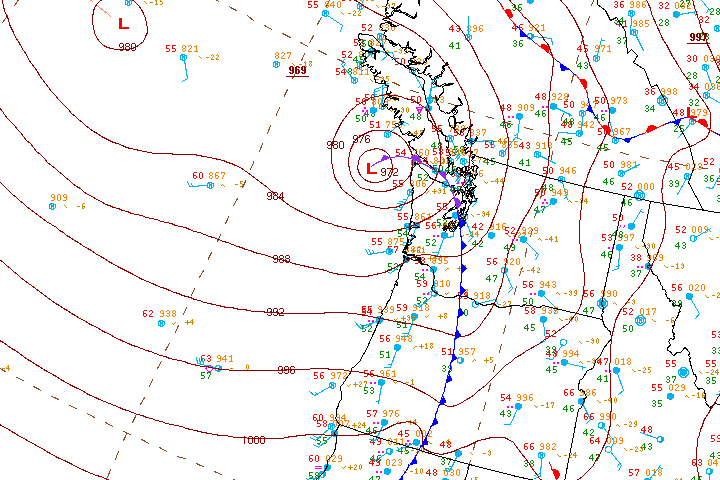
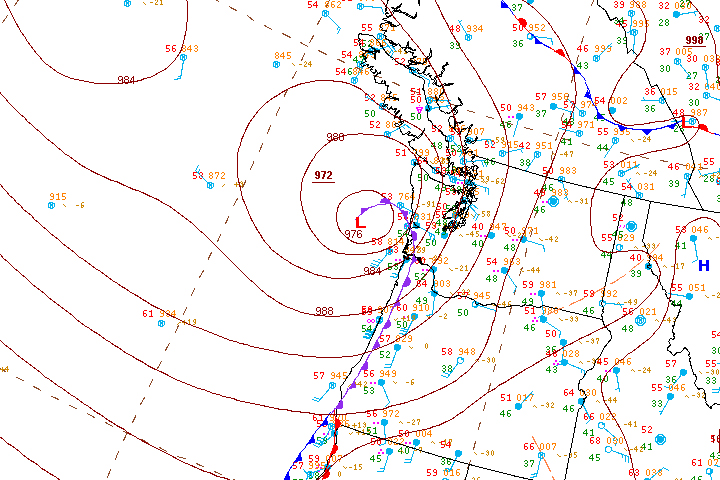
The Ides Windstorm of October 15, 2016
A Wind Speed Forecast Bust for
Western Washington and Southwest British Columbia

compiled by

Wolf Read


1.0 Introduction


1.1 Background

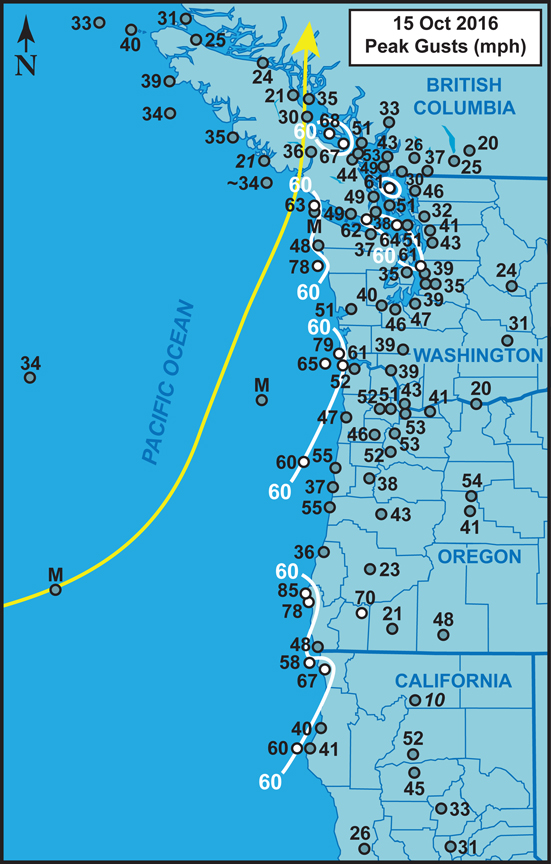
Figure 1.1 above Peak gusts (mph and km/h) for the October 15, 2016 windstorm. Wind speeds are largely from long-term surface airways weather observation sites, data buoys, lighthouses and C-MAN stations, with limited data from other networks (e.g. RAWS). Stations with long histories are preferred because of the research focus on inter comparison of historic storms. Numbers preceded by a tilde (~) represent the highest gust report in a dataset that has been interrupted at the height of the storm--usually data loss is from power outages. Values in italics are gusts estimated from peak wind, usually 2-minute or 5-minute, using a 1.3 gust factor. Stations with high-wind criteria gusts (≥58 mph or 93 km/h) are denoted with white-filled circles. Isotachs depicting ≥60 mph (~100 km/h) gusts are included to highlight the regions that had concentrations of the indicated magnitudes. The track of the extratropical cyclone center is shown (yellow arrow). Click on the map to see a larger version. Here is a map listing the station names.


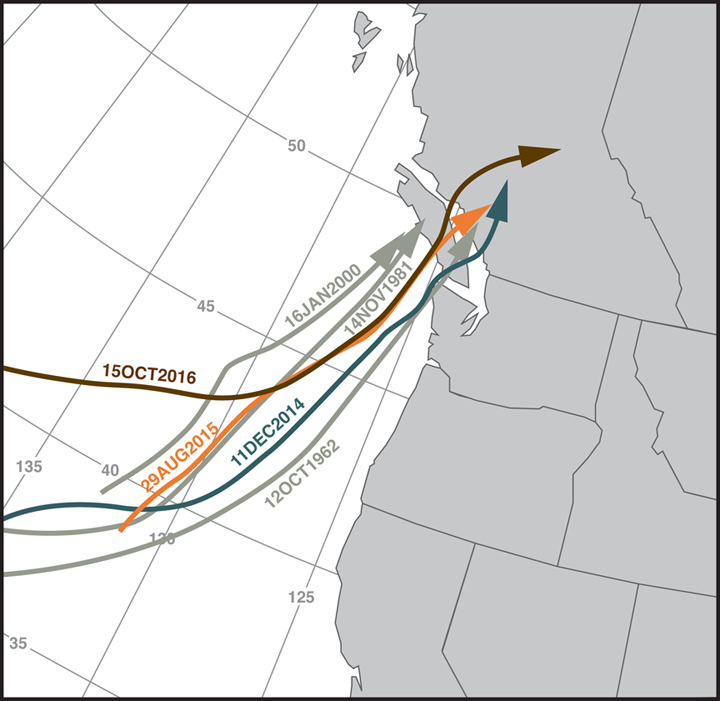
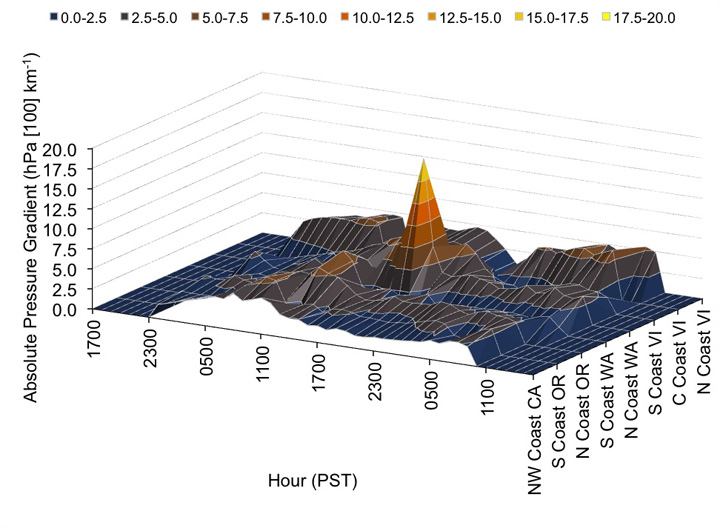
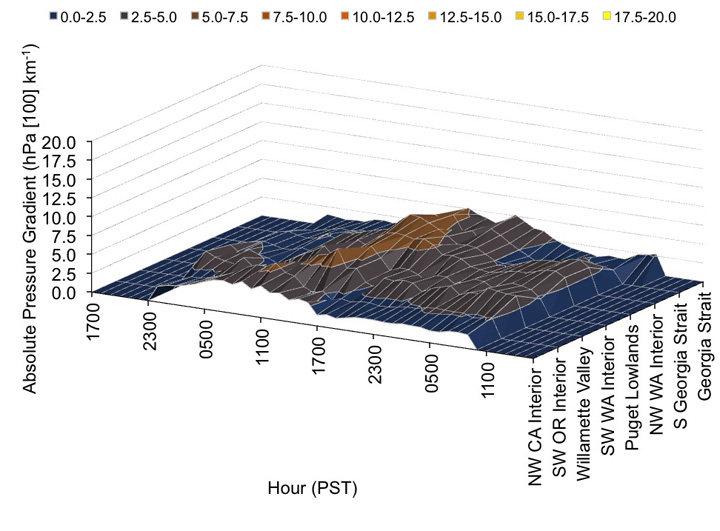
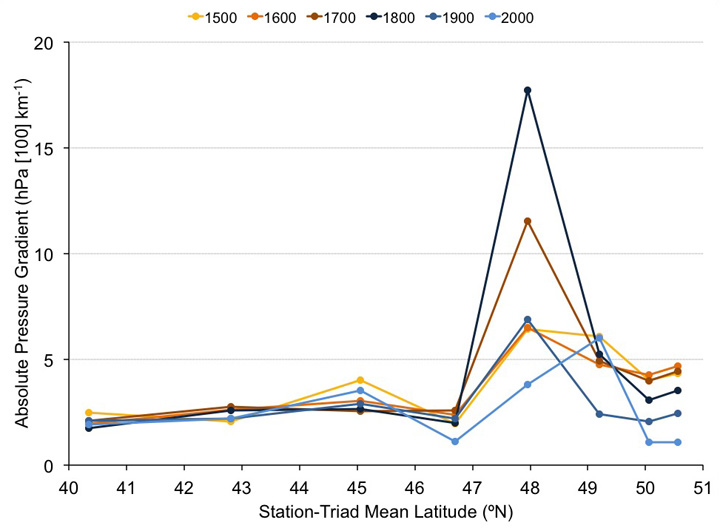
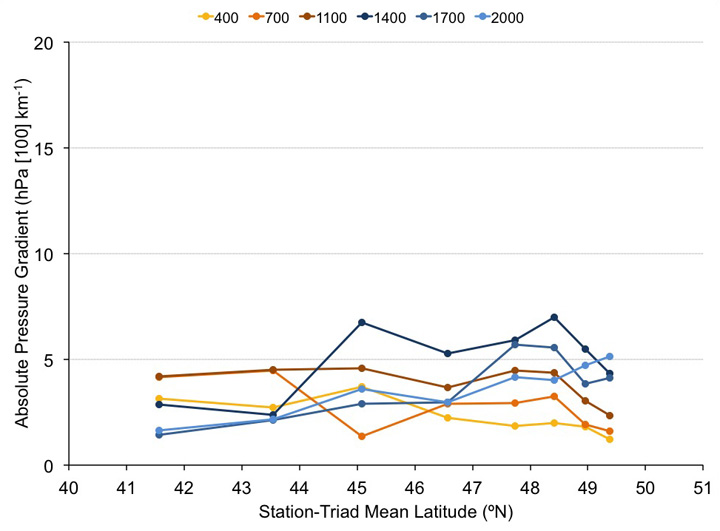
The Ides of October Storm grew from the remnants of Typhoon Songda, a western Pacific tropical cyclone. This is not an unprecedented situation, as there appears to be a link between many major Cascadia storms and tropical systems. The entrainment of deep tropical moisture provides a good energy source for a developing midlatitude cyclone. A link to a tropical storm is not a necessary ingredient for a major windstorm, but simply boosts the likelihood of such an event. One of the most familiar events with a tropical connection is the 1962 Columbus Day Storm and its association with Typhoon Freda. The October 21, 1934 windstorm also appears to have tropical roots. In most cases of typhoon entrainment, the tropical cyclone has strongly degraded before its remnants have been entrained in the midlatitude westerly flow. The Ides Storm resulted from a very rare case where the associated typhoon became entrained in the westerly flow while still fully intact. This may have had some bearing on the forecasting difficulty and the storm outcome.

Looking at peak gusts for the Ides Storm, despite many variables in favor of high winds, including having a classic path, the early-season windstorm largely underperformed (Figure 1.1). There are many classic path windstorms in history that have produced a stronger outcome, especially in the most populated areas in the study region. On the coast, most of the stations that reported high winds were those that were well exposed, such as Cape Blanco and/or Destruction Island. Exposed in this context generally means has a large overwater fetch relative to the prevailing direction of the wind at the time of maximum gust. Stations that were even slightly sheltered, such as North Bend or Astoria, generally received far lower peak gusts than exposed sites even nearby. During all windstorms the exposed locations tend to report higher wind speeds--there is nothing unusual about this pattern. What is interesting here is that there is such a clear demarcation between exposed and sheltered sites, with high winds being restricted solely to the former. Also, the difference in peak wind speed between the exposed and sheltered sites appears to be a bit higher than usual, at least in some cases. At the exposed sites, peak wind gusts were generally 60 to 80 mph (100 to 130 km/h), and for the somewhat sheltered sites 35 to 55 mph (55 to 90 km/h).

The story along the coast is the same for the interior, with high winds by and large being restricted to site with long overwater fetch. The southwest Oregon valleys were largely missed by this storm. This is in contrast to many classic windstorms that have delivered strong winds, including high wind gusts in some instances, to places like Medford. In the Willamette Valley, wind gusts generally ranged from 40 to 55 mph (65 to 90 km/h), strong, but nothing like the recent December 11, 2014 classic windstorm, which was run-of-the-mill for the classic path category. The relatively low wind response also occurred in the Puget Lowlands and North Interior of Washington and the Lower Mainland and Greater Victoria regions of British Columbia, with peak gusts generally between 35 to 50 mph (55 to 80 km/h).

From a climatological perspective, the Ides storm produced a below average gust response. Using data form approximately 38 stations from northwest California to southwest British Columbia, the storm had an average peak gust of 41.6 mph (67 km/h). This is just 81% of a 12-storm average (1940-2016) for high-wind-generating extratropical cyclones following the classic path. In comparison, the December 11, 2014 windstorm produced a 47.8 mph (77 km/h) average, about normal, the November 13-14, 1981 windstorm 59.3 mph (95 km/h) and the 1962 Columbus Day Storm a phenomenal 75.6 mph (122 km/h).


1.2 Wind Forecasts

Analyses of Cascadia windstorms on The Storm King tend to be focused on what actually happened, as opposed what may have happened, or in other words forecast examinations are rare. Weather forecasting is a tough job. It really is. I had a chance to experience this while taking an intensive operational meteorology course at the Environment Canada (EC) offices in Vancouver, BC. In the Pacific Northwest, extreme wind and snow forecasts are among the toughest to do. So, to all the forecasters who faced the challenges of the Ides Storm, you have my apologies in advance if it seems like any toes get stepped on in this section.

The Ides Storm, being early season, added extra challenges to wind warnings. In mid October, many deciduous trees are still well foliated. Leaf-bearing trees have a higher coefficient of drag compared to denuded trees, meaning that full crowns result in higher loads for the same wind speed. Also, all trees have new growth increment from the previous growing season that generally has not been tested by strong winds. Pathogens may also weaken trees during the warm season. Thus, significant tree damage can occur at lower wind thresholds. I have discussed this at conferences such as the Pacific Northwest Weather Workshop, and it is well known among forecasters at least anecdotally. Thus, a high wind warning may be issued at lower wind speed thresholds than during later months like December and afterward. I note, however, in the case of the Ides storm, earlier windstorms had already swept through the region, including on October 6-7th and again on October 14th.

In order to simplify, focus will be kept to forecasts covering the most populated locations of the study area. The National Weather Service (NWS), Portland, issued for the north and central Willamette Valley a high wind warning for winds S 25 to 35 mph with gusts to 55 mph (40 to 55 km/h gusting 90) at 0430 PDT on October 15, 2016. NWS, Seattle, at 1000 PDT also issued a high wind warning, this one for winds S 20 to 35 mph with local gusts to 60 (35 to 55 km/h gusting 100) and covering the Seattle-Tacoma-Everette area and surrounds (the majority of the Puget Lowlands). At noon, EC issued a wind warning for the Metro Vancouver area and surrounds for expected southerly winds of 90 km/h or higher. This is a wise downgrading from 100 km/h during an earlier forecast posted at 0506 PDT. Of course, at all of the forecast offices there were earlier warnings and these differed somewhat from the ones issued just ahead of the storm. There probably should be a sociological analysis of how the idea that the Ides windstorm would be a major or even catastrophic windstorm--hence it getting named "Ides of October" even before it had developed--originated and then proliferated in the media (I currently have no plans to do this). In any event, a key part of forecasting is constant adjustment as new information becomes available. The latest numerical weather prediction model runs and most recent observational data may tell a different story than earlier information.

How did the October 15, 2016 windstorm measure up to the above forecasts? Comparing the readings on the map it seems clear that the NWS Portland prognostication captured what eventually did happen quite well. Most peak gusts in the north and central Willamette Valley were in the rather narrow range of 51 to 53 mph (81 to 85 km/h). Further north, forecast accuracy breaks down.

Wind speeds in the Puget Lowlands simply did not match the forecast--most especially for gust. While there is an instance of a gust at the upper end of the warning rage, the 61 mph report from West Point in Seattle, this station is among the very well exposed sides discussed above. In most cases, West Point has the highest reading among the key observing sites in the area, and when winds at this location are exceeded at another it is almost always Paine Field, another fairly wind-prone site. This fact invalidates West Point for verification of a wind warning. To do so would be like firing into the side of a barn at point-blank range and claiming a high level of marksmanship. It would be cheating. In fact, the wind climatology at West Point emphasizes a need for wind warnings in the Puget Lowlands and Northern Waters to have a separation between exposed and sheltered locations, as is done for wind forecasts on the Pacific Coast. The shores of the Puget Sound are a marine coastline and it makes sense to treat them as such when providing wind forecasts.

Looking at other long-term stations in the Seattle area, like Boeing Field, Renton and SeaTac, gust speeds did not even reach 40 mph. Ouch. The Ides windstorm underperformed many other events in recent times, and in fact barely rates as being more than a typical blustery cold-season storm, like the Christmas Day event of 2005. Indeed, the precursor windstorm on October 14, 2016 proved to be stronger at many stations, giving it a higher average. Paine Field in Everett, though not as exposed as West Point, is nevertheless a rather favored site for high wind readings as noted above, especially in situations conducive to southeast winds in the North Interior. This station failed to live up to its reputation during the Ides Storm. Even when allowing for a greater potential for tree damage in the Autumn, widespread peak gusts of 35 to 45 mph (55 to 75 km/h) are better placed in the wind advisory category.


Table 1.1, below, lists Seattle-area peak gusts, in mph, for recent storms (those that have struck since ASOS was fully implemented).


Storm
Tacoma McChord
SeaTac Airport
Renton Airport
Boeing Field
West Point
U of W ATG
Everett Paine
Average
15OCT2016
47
39
30
39
61
37
43
42.2
14OCT2016 45 45 35 39 55 37 53 44.1
13MAR2016 55 56 48 54 67 49 60 55.6
10MAR2016 46 45 43 47 53 40 60 47.7
29AUG2015 54 46 39 41 55 ~37 61 47.6
11DEC2014 58 49 46 49 55 41 62 51.4
25OCT2014 40 49 45 46 52 45 46 46.1
12MAR2012 41 40 35 35 45 28 47 38.7
02APR2010 43 47 43 44 55 40 62 47.7
12DEC2008 46 45 37 45 59 44 53 47.0
18OCT2007 48 53 46 41 56 39 56 48.4
15DEC2006
69
69
51
56
70
55
66
62.3
04FEB2006
47
47
44
47
66
48
52
50.1
01JAN2006
41
49
40
40
54
40
45
44.1
25DEC2005
40
38
38
35
48
35
48
40.3
27DEC2002
51
52
49
48
59
56
58
53.3
16JAN2000
60
52
53
54
69
55
60
57.6
03MAR1999
55
60
51
52
68
MM
57
57.2

Of relevance to the Seattle area peak gusts is a classic-path pattern that has been discussed more than once on The Storm King: Peak winds in the Emerald City are almost always lower than those at Portland (Figure 1.2). On average, the difference is about 10 mph. Given the south to north track of classic path windstorms, peak winds always arrive in Portland several hours before Seattle. Thus, there is an opportunity to use Portland observations as a gauge to help forecast the magnitude of Seattle's peak gust. In the case of the Ides Storm, Portland's peak gust of 53 mph (85 km/h) suggested a peak of around 43 mph (69 km/h) at SeaTac Airport. This estimate is fairly close to what occurred, and pointed in a direction well below the high wind warning.


Figure 1.2 above Average peak gust for 12 windstorms that followed the classic path from 1940 to 2016. Northwest Oregon tends to be hit the hardest during these storms, with parts of northwest Washington a close second. Portland's average peak gust of 66 mph (106 km/h) is the highest of all interior stations and is fully 10 mph (16 km/h) above the average peak gust at SeaTac. Click on map for a larger version.


Moving across the border into the Lower Mainland of British Columbia, the story is quite similar to the Puget Lowlands. Peak gust speeds generally fell well short of the forecast. In many southeasterly windstorms, Abbotsford tends to lead Vancouver and Victoria in peak gust. During the Ides storm the situation reversed, with Victoria having the highest gust, 49 mph (80 km/h), followed by Vancouver with 43 mph (69 km/h) and Abbotsford with a mere 37 mph (59 km/h). The peak gusts during the 2015 storm were all below 90 km/h, with Abbotsford falling a full 30 km/h short. Given that the precursor storm on October 14th brought high winds to the Lower Mainland, with a gust of 61 mph (98 km/h) at Abbotsford that likely brought down many of the vulnerable trees and branches, the Ides storm caused relatively minor damage. This is reflected in power outages. The October 14, 2016 windstorm knocked out electrical service to at least 75,000 BC Hydro customers at peak, most of them in the Lower Mainland. The Ides Storm affected about 35,000, with about 2/5 in the Lower Mainland and another 2/5 on northern Vancouver Island, the rest being on the southern half of the Island.

The missed forecasts are a product of a weather system that did not behave as expected. Wind speeds were quite low relative to many of the wind-speed indicators associated with the storm. This fact will be examined in more detail.


2.0 Selected Analyses


2.1 Storm Track


Figure 2.1 above Storm track estimation largely based on surface maps provided by the US. NOAA Weather Prediction Center, surface data and satellite photo interpretation. Date and time in PST and central pressure in hPa (mb).


The October 15, 2016 windstorm followed the classic path (Figure 2.1), moving inside 130ºW south of 45ºN, then recurving and tracking north-northeast up the coast. The extratropical cyclone reached peak intensity while off of the north Washington coast. Using a cyclostrophic estimation with wind and pressure inputs from Buoy 46087 and a distance estimate from the above storm track estimation, the storm had a central pressure around 967 hPa (28.56" Hg) just before landfall. This marks a pretty potent system, the deepest classic-path extratropical cyclone since the major December 12, 1995 storm. However, surface pressure throughout the region had been broadly depressed by precursor storms, including October 14, 2016. Thus, the Ides storm's 967 hPa may have been more equivalent to a more typical 980 hPa (28.94" Hg) low. This fact is may explain the relatively weak near-surface wind response further from the low center, though the 980 hPa classic windstorm of January 16, 2000 managed some significant wind gusts. Also, as will be shown below with pressure gradients, a relatively weaker central pressure is only a partial explanation at best.

Also in the category of partial explanations is the exact track. Numerical weather prediction models suggested a path with the center landing in the vicinity of Tatoosh Island, actually a bit to the east. Instead, the actual track was further west, with the low landing on southern Vancouver Island in the vicinity of Pachena Beach. This deviation of about 30 miles (~50 km) has been cited as a key reason for the low wind response relative to forecasts in western Washington. However, some issues exist with this explanation. The Ides Storm tracked neatly inside the classic path windstorm range (Figure 2.2). Indeed, the October 15, 2016 event followed a track that ended up quite close to the Washington coast relative to other classic events. Windstorms that have delivered stronger winds to the Seattle area than the Ides Storm have tracked much further west. This includes the January 16, 2000 extratropical cyclone, an event that did not have an extremely deep central pressure like the more well-known major November 14, 1981 storm.


Figure 2.2 above Tracks for selected classic path windstorms. The Ides of October 2016 windstorm is shown in brown, with the August 29, 2015 windstorm in orange and December 11, 2014 in blue. Earlier windstorms are shown in gray.


A subset of the track explanation is that the storm progressed rather quickly, not allowing sufficient time for extreme winds to develop at a particular location. However, the Ides storm does not exhibit an outstanding forward speed relative to other classic path storms (Table 2.1). Indeed, off of the Washington Coast, the Ides Storm slowed down--as is typical of extratropical cyclones just before landfall--to a modest speed of about 30 mph (50 km/h). Other storms have had faster motion. In fact, the 1962 Columbus Day Storm had a forward speed approaching 50 mph (80 km/h) while off the Oregon coast, at the same time that this system delivered record wind speeds to the Willamette Valley. There is an argument to be made that, for a classic windstorm, a faster speed is more conducive to high winds because the total northward momentum of the storm can add additional impetus to already fast southerly winds.


Table 2.1 below lists the bearing, distance traveled and average forward speed of the low-pressure centers for selected classic path windstorms. Transit times while the storms tracked off of the Oregon and Washington coasts are provided, plus numbers for a combination of data for both coasts. The position data is taken right from the storm track maps on The Storm King. Track positions for the 1962 event are from Lynott and Cramer (1966).


Storm and Region Bearing (º) Distance (km) Hours Speed (km/h) Speed (mph) Speed (knots)

15 Oct 2016 Oregon Coast 40 412 6 69 43 37
15 Oct 2016 Washington Coast 18 422 9 47 29 25
15 Oct 2016 Overall 29 834 15 56 35 30
             
29 Aug 2015 Oregon Coast 31 460 9 51 32 28
29 Aug 2015 Washington Coast 17 407 6 68 42 37
29 Aug 2015 Overall 24 867 15 58 36 31
             
11 Dec 2014 Oregon Coast 20 475 9 53 33 29
11 Dec 2014 Washington Coast 22 240 9 27 17 14
11 Dec 2014 Overall 21 715 18 40 25 21
             
12 Oct 1962 Oregon Coast 22 468 6 78 48 42
12 Oct 1962 Washington Coast 11 306 6 51 32 28
12 Oct 1962 Overall 16 774 12 65 40 35


Climatological Notes

Extratropical cyclones following the classic path are a rare events historically. In recent years there has been a cluster of such storms, including the December 11, 2014, August 29, 2015 and of course the Ides storm in 2016 (Figure 2.2). Aside from these storms other weaker systems have also followed this track during the same time frame. The time period 2014-2016 may contain the biggest cluster of such events on record. It is also interesting that the year 2016 has produced no less than four windstorms of note, two of which were late season, occurring on March 10th and March 13th, and the other two being early season, the October 14th and October 15th storms. This kind of mirror symmetry has showed up before (e.g. 1962) and likely reflects a persistent large-scale pattern supportive of windstorms.

Since the storm season of 2014-15, a strong tendency for meridional, or south to southwest, flow has been present. This is the kind of pattern that is conducive of classic windstorms. One side effect of this has been the near absence of intense westerly wind events in the Vancouver Metro area and down the Strait of Juan de Fuca. Such west winds are generally a routine occurrence, usually with several strong storms each year. Since 2014, the familiar howl of the west wind has been quite muted for residents in typical strike zones.

The persistent meridional flow appears to be related to the recent strong El Niño. Though the El Niño has since faded as of the time of this writing, there may be a lag in the response of the global weather patterns, and thus we continue to see the development of storms following the classic path. Persistent meridional flow patterns were associated with the big 1982-83 El Niño and perhaps less so around the time of the 1997-98 event. Further discussion on this can be found near the end of the introduction to the March 13, 2016 windstorm.


2.2 Pressure Gradients and Peak Gust Speed


Figure 2.2 above A 1-km resolution visible satellite image taken at 1600 PDT on October 15, 2016. The compact core of the Ides Storm is located nearly due west of Quillayute. Some deeper convection is evident near the center of circulation, suggesting that the storm still had some vigor at this time. Image courtesy of the National Weather Service.


Some of the most interesting characteristics about the October 15, 2016 windstorm involve the pressure gradients and the associated wind response. The Ides Storm had a very compact core. This shows up on satellite photos (Figure 2.2). Particularly intense pressure gradients surrounded the center, but only over a relatively small spatial scale. Outside of this core, pressure gradients were steep, but not out of the ordinary for a strong midlatitude cyclone. In essence, the Ides storm had a funnel-shaped pressure cross-section (Figure 2.3). Such a profile is typically the mark of a deepening storm. It is also reminiscent of a tropical cyclone. The storm likely maintained this funnel-shaped profile up to landfall. Upon interacting with the steep terrain of Vancouver Island, pressure gradients tend to relax quite rapidly, and the profile tends to reshape into a more bowl-like one. Even so, a vestige of the funnel-like profile is still evident is interior sea-level pressure cross-sections as the low-pressure center tracked right over Comox (not shown).


Figure 2.3 above Coastal sea-level pressure cross sections in hPa taken at various times as the Ides Storm tracked northward up the coast. At 0200 PST (not PDT) October 16, 2016 is a near-perfect capture of the cyclone's funnel-shaped pressure profile. A very intense pressure gradient is evident on the immediate south side of the low, reflecting a very compact core within about 1.0º of latitude.


There is also anecdotal evidence of the persistence of a strong pressure gradient being maintained close the low-pressure center as the storm tracked inland. A brief period of intense winds with gusts estimated to be at least 80 mph (130 km/h) by a Master Mariner struck the Cowichan Lake area on Vancouver Island around 2015 PDT. This timing coincides quite well with the passage of the low just to the west of this region. The southeast wind gusts of 67 to 68 mph (107 to 109 km/h) at Ballenas and Sisters Islands in the Georgia Strait also fits with the preservation of a fairly intense pressure gradient around the core even as the low tracked due north all the way across Vancouver Island. This is somewhat unusual, and would typically only happen under a situation of good jet stream support. Interestingly, by the time the Ides Storm landed on Vancouver Island, the jet max appears to have moved well inland, away from the surface low. One is left wondering if the Ides extratropical cyclone contained some vestige of Typhoon Songda's warm core given the persistence of a funnel-shaped pressure profile.

The steep pressure gradients associated with the compact core show up in varous other ways. This includes sea-level pressure traces (Figure 2.4). The compact core is evident in the sharp "tooth", or cusp, in the pressure trace for Buoy 46087. This core missed the other stations shown. The barometer at Tatoosh Island even captures a more dramatic profile than 46087. After a brief rise, probably due to the passage of the leading front, the pressure fell an incredible 7.6 hPa between the hours of 1700 and 1800 PDT, one of the fastest hourly declensions in the record for any Cascadia weather station. At this point, the pressure had fallen to 968.4 hPa (28.60" Hg), indicating a sub-970 hPa (28.64" Hg) extratropical cyclone. Afterward, for the next two hours, the pressure surged upward by 6.3 and 6.5 hPa/hr. Given a tendency for markedly greater extremes than surrounding barometers (Quillayute, 46087), the Tatoosh readings are somewhat in question. This is why 46087 data is used in its stead--the numbers are a bit more conservative.


Figure 2.4 above Hourly sea-level pressures in hPa for coastal stations arranged south (warm colors) to north (cool colors). Time begins at 1500 PST on October 14, 2016.


The compact core also produces a strong signal among coastal 1-dimensional pressure gradients (Figure 2.5). For many regions, the Ides Storm tended to produce weaker gradients than the precursor storm on October 14, 2016. However, near the core, the situation reverses, with an gradient in excess of 17 hPa/100 km between Quillayute and 46087. If data from Tatoosh Island were used, the indicated pressure gradient would be in excess of 20 hPa/100 km, the strongest among any of the analyzed storms on The Storm King. Times are PST.


Figure 2.5 above Hourly one-dimensional pressure gradients in hPa/100 km for coastal stations arranged south (warm colors) to north (cool colors). The precursor storm on October 14, 2016 is captured on the left side of this graph, with the Ides Storm on the right. Time begins at 1500 PST on October 14, 2016.


Now considering 2-dimensional pressure gradients, when compared to other recent classic path windstorms, namely December 11, 2014 and August 29, 2015, the Ides Storm generally brought the strongest pressure gradients (Table 2.2). In fact, for the northwest Washington coast, the pressure gradient on October 15, 2016 briefly climbed to an truly extreme level. The value of 17.7 hPa/100 km is the third highest absolute pressure gradient among the storms that have been analyzed. Only the peak gradient of 19.8 hPa/100 km of the November 3, 1958 windstorm over southwest Washington, and the 18.3 hPa/100 km gradient of the March 12, 2012 windstorm over northern Vancouver Island are known to be higher. It is the highest 2D gradient known for the northwest Washington coast, exceeding the 15.3 hPa/100 km magnitude of the April 2, 2010 windstorm and 14.7 hPa/100 km produced by March 3, 1999 event. It is important to keep in mind that, as far as is known, the 1962 Columbus Day Storm did not bring as intense a pressure gradient to the region as the Ides Storm, with a peak value of 15.5 hPa/100 km over southwest Washington, and some evidence that the gradient had relaxed to about 10 hPa/100 km as the low tracked just east of Tatoosh Island. Missing pressure data prevents the computation of a 2D gradient for the same stations used in the northwest part of the state.


Table 2.2 below Peak hourly and 3-hr average absolute (2-dimensional) pressure gradient (hPa/100 km) for selected areas in the study region. Values for three recent classic path windstorms are shown, along with an overall storm average.


Region Absolute Pressure Gradients (hPa/100 km)
Maximum Hourly Maximum 3-h Average
15 Oct 2016 29 Aug 2015 11 Dec 2014 15 Oct 2016 29 Aug 2015 11 Dec 2014
Northwest Oregon 5.8 5.2 5.7 5.2 4.6 5.2
Southwest Washington Coast 6.5 3.1 7.5 5.1 2.3 6.1
Northwest Washington Coast 17.7 7.8 11.8 10.6 6.3 7.8
Willamette Valley 6.7 5.4 5.3 5.7 5.1 4.3
Puget Lowlands 6.1 7.0 8.8 6.1 6.7 8.4
South Georgia Strait 5.8 5.4 5.8 5.1 3.6 4.4
             
Average 8.1 5.7 7.5 6.3 4.8 6.0


The 17.7 hPa/100 km gradient of the Ides Storm puts it in a rare category, and marks it as a very intense system. This gradient puts into question the idea that the more westerly storm track is the reason for the relatively low wind speeds. Despite passing further offshore than the numerical models indicated, this storm managed to bring a pressure gradient to the Olympic Peninsula that is in excess of a number of strong to catastrophic windstorms. The earlier extratropical cyclones noted above generally brought stronger winds to the Washington coast than the Ides Storm, and in some cases truly intense winds. Pressure-gradient based models of near-surface wind speeds, using peak 3-hourly averages to allow enough time for winds to accelerate to the full potential of the gradient, suggest that the Ides Storm had the capacity to bring widespread wind gusts of 60 to 80 mph (100 to 140 km/h) at non-exposed sites like Hoquiam and Quillayute. Peak gusts in the region fell far short of this. The gust of 78 mph (126 km/h) at Destruction Island is being excluded because this is an exposed location prone to high wind speeds. In fact 78 mph is rather low for this station when compared to other storms, including the August 29, 2015 event that brought a gust to 90 mph (145 km/h) to the island and this with a much lower maximum pressure gradient.

Outside of the northwest Washington coast, maximum pressure gradients between the three storms are broadly comparable. When comparing observed near-surface wind speeds with pressure gradients for locations in the complex terrain of the Pacific Northwest, the relationship is typically moderately weak, say R-squared values in the range of 0.3 to 0.5 for well-behaved sites. There is much noise due to local geographic effects and other contributions to wind speeds outside of the surface pressure gradient. Thus, any wind response signal from differences in pressure gradient by less than approximately 50% can easily be lost in the noise. Therefore, the range of peak gradients for the Puget Lowlands, 6.1 to 8.8 hPa/100 km, or about 30%, is probably not that significant. Of course, any extra boost does not hurt. One might expect peak wind (not so much gust) speeds to differ by about a factor of 1.2 between the two extremes assuming all other conditions were equal--and this almost never happens.

Based on some pressure gradient models developed from the data for past classic path windstorms, the reported peak gusts for the Willamette Valley are commensurate with the measured peak pressure gradient. The storm behaved exactly as expected. The unusual event is the December 11, 2014 windstorm. With gusts up to 67 mph (107 km/h) at Portland International, this gale stands out relative to the peak pressure gradient. At the opposite end of the spectrum, the August 29, 2015 windstorm produced a relatively low 43 mph (69 km/h) peak gust.

The wide variability of peak gust speed (and also peak wind) compels looking at some other variables outside of gradient magnitude. A very important detail associated with pressure gradient that has not been discussed so far is the orientation of the gradient field (Table 2.3). This is also known as pressure slope.


Table 2.3 below Peak hourly and 3-hr average absolute (2-dimensional) pressure gradient orientation for selected areas in the study region. Values for three recent classic path windstorms are shown, along with an overall storm average.


Region Pressure Slope Orientations (º)
For Maximum Hourly Gradient For Maximum 3-h Average Gradient
15 Oct 2016 29 Aug 2015 11 Dec 2014 15 Oct 2016 29 Aug 2015 11 Dec 2014
Northwest Oregon 116 126 137 117 129 145
Southwest Washington Coast 93 53 156 82 34 154
Northwest Washington Coast 103 121 112 116 128 137
Willamette Valley 127 123 156 121 124 156
Puget Lowlands 103 118 175 108 125 142
South Georgia Strait 80 131 130 77 82 125
             
Average 104 112 144 104 104 143


This data in the table tell a very compelling story. The Ides storm had a strongly easterly pressure slope orientation relative to the most hard-hitting storm of the three being analyzed here, December 11, 2014. The difference between the average pressure slope orientation for the 2014 and the Ides storms is a quite significant 40º. When related to the trend of the major terrain features like the coast ranges and Cascades, this is enough for a two-fold difference in southerly peak wind speed for a given pressure gradient magnitude.

For example, looking specifically at the Willamette Valley readings and adjusting for conditions using the cosine rule and near-surface wind theory: For Portland, the Ides Storm peak gust speed of 53 mph translates to 71 mph when the pressure gradient conditions for the December 11, 2014 windstorm are accounted for. Pretty close to the measured 67 mph gust. And when the adjustments are made for the August 29, 2015 windstorm, a 43 mph peak gust is returned. Bang-on. (Caveat: These are back-of-the-envelope calculations and are subject to error.)

The strongly easterly pressure slope orientation at the time of peak pressure gradient appears to be the best explanation for the relatively low peak wind response during the Ides Storm. To some extent it may explain why almost without exception the exposed sites were favored for high wind criteria gusts. Pressure gradient orientation is not as critical for peak wind determination over the open water, where surface friction is considerably less than on land.


2.3 Why Were Pressure Gradients Oriented Strongly East During the Ides Storm?

To some extent, this is where the discussion comes full circle, back to the storm track. Since the storm had a very compact core, locations even 100 km from the center would probably be left in a strongly easter pressure gradient (Figure 2.6). There is an easterly pressure slope over the interior of Washington and southwest British Columbia. For certain regions, especially in Washington, a track into the Olympic Peninsula likely would have resulted in a better pressure gradient orientation as the low moved north of places like the Puget Lowlands. This would have allowed better support for southerly winds given the same pressure gradient.


Figure 2.6 above Weather Prediction Center surface analysis for 0000 UTC October 16, 2015 (1700 on October 15th PDT).


Over western Oregon a southerly pressure slope is evident behind the storm's main cold front. This is supportive of southerly winds. However, the low-pressure center is far to the north at this time, nearing the Vancouver Island coast. The pressure gradient has fallen to a level not supportive of high winds. The position of the front is a critical factor, and in the case of the Ides Storm likely played a role in the lower surface-wind response. Storm track, storm size and associated pressure gradient fields are relating just part of the story.

For Oregon, the Ides Storm leading frontal system reached the coast after the low had tracked to the north of the state (Figure 2.7). The front trailed the low in a somewhat unusual manner. For many classic windstorms, the leading fronts tend to move further inland and have more of a northwest to southeast orientation, not perfectly meridional. The classic case is the Columbus Day Storm where the main front, stretched out in the eastern quadrant of the low, swept northward in rough lock-step with the low, arriving at places almost the same time that the storm center passed the location's latitude. This near-perfect timing likely contributed to the extreme winds that occurred in 1962. Some of the most effective mechanisms for mixing upper-level wind speeds to the surface are found along the main frontal boundaries. The pressure gradient also tends to reorient behind the front, becoming more favorable for south winds. During the Ides Storm the front, and its attendant mixing and pressure gradient reorientation trailed well behind the low, tended to arrive at a time when surface pressure gradients were on the wane.

An important aspect of frontal passage is the scouring out of an entrenched cold surface layer that is often present in the offshore flow ahead of incoming low-pressure centers. The cold, dry surface layer can act as a shield, preventing the mixing of wind momentum from above. A typical windstorm pattern is for the leading occluded or cold front to cause warming temperatures at the surface as the cold air layer is scoured out. Even with a cold front the temperatures may warm because the air behind the boundary is not a chilly as the cold, continentally modified air pouring through mountain gaps in the easterly pressure gradients ahead of the low. The warming temperatures are often a signal that the southerly winds are about to start. The removal of the surface layer is an important detail in conceptual windstorm models (e.g. Mass and Dotson 2010). During the Ides Storm, the removal of any emplaced cold surface layer--and this would be relatively speaking given the early-season nature of this storm--happend late, since in general the front arrived well after the low had passed to the north. This is especially true of Oregon, less so in Washington.


Figure 2.7 above Weather Prediction Center surface analysis for 2100 UTC October 15, 2015 (1400 on October 15th PDT).


Another factor evident in the two figures is the mature low in the northwest corner of the two surface maps. This system gradually moved in behind the Ides Storm, keeping surface pressures relatively low, and thus forcing a relatively quick return to a more easterly gradient behind the windstorm. Pressure rises after the Ides low had passed appear to have been suppressed by the incoming mature system (Figure 2.8). For the majority of sites, pressure rises were rather modest for a classic-path windstorm. The only exceptions occur at those stations close to the compact core, such as Quillayute and Buoy 46087. The lagging meridional front may have also played a role in reduced pressure tendencies, limiting the potential for a classic frontally-generated pressure surge. A detailed isallobaric analysis would likely show rather modest pressure tendencies in the wake of the Ides Storm, relative to events like December 11, 2014, with generally modest pressure rises. Pressure declensions ahead of the storm, by the way, were pretty strong and well within what would be expected for a healthy classic windstorm.


Figure 2.8 above One-hour pressure tendencies in hPa for coastal stations arranged south (warm colors) to north (cool colors). The precursor storm on October 14, 2016 is captured on the left side of this graph, with the Ides Storm on the right. Time begins at 1500 PST on October 14, 2016.


2.4 A Brief Look at Upper-Air Conditions

Balloon soundings from Salem for 0500 PDT on October 15th, ahead of the Ides Storm, show height 850 winds around 46 mph (74 km/h) with a direction of 200º. Twelve hours later, after the Ides Storm had passed to the north, 850 winds were around 54 mph (85 km/h) with a 215º direction. Given the right mixing, these speeds could reach the surface. The observations agree well with the reported near-surface gusts of 46-53 mph observed in the north Willamette Valley. The soundings also show a strong jet stream right over the area between heights 350 to 250, with wind speed up to 150 mph (240 km/h) and direction around 200º during the 1700 PDT observation. All of these conditions are pretty much what would be expected for a classic-path windstorm. However, the reported speeds are lower than for other storms, such as December 11, 2014, which brought 75 mph height 850 winds over Salem. Lower upper-level wind speeds fits with a lower surface wind response for the Ides Storm.

At Quillayute, the 1700 PDT observation happened with the storm center relatively close to the station. Height 850 winds were 70 mph (113 km/h) out of 185º. With a good mixing mechanism, this momentum could have surfaced. Apparently, this did not happen given Quillayute's 48 mph (80 km/h) peak gust, even as the leading front moved through earlier. The easterly surface pressure gradient associated with this storm, certainly in place as the front moved through, may have limited the potential for good coupling with the strong southerly upper-level winds. There is no evidence of the jet stream at height 350 to 250, the feature being located further east, over the Cascades.

In terms of upper-level winds, there appears to be nothing outstanding that would point toward the low surface response. In fact, near the storm center, upper-level winds appear to have been of sufficient strength to contribute to gusts of 60-70 mph (100-115 km/h), certainly near the coast. The easterly surface pressure gradient orientation seem to offer the best explanation for relatively low winds during the Ides Storm.


3.0 Storm Data


3.1 Absolute (2-Dimensional) Pressure Gradients

Table 3.1 below For 18 pressure-wind triangles located in the study region, peak absolute (2-D) pressure gradients (hPa/100 km), associated pressure slope (º), geostrophic potential wind (Mg in mph) and estimated peak surface wind and gust (mph) for overland regions based on the gradient magnitude and the presence of turbulent drag from surface roughness.


Location Station Triad Mean Lati-tude (ºN) Max Pres Grad (hPa /100 km) Pres Slope (º)

Peak Mg (mph)

Est Peak  2-Min Wind (mph) Est Peak  3-Sec Gust (mph) Time (PST) Day (PST) Mo (PST)
Coast
Northwest California UKI-RBL-CEC 40.35 4.6 126 89 30 50 0800 15 10
South Oregon CEC-OTH-RBG 42.81 5.4 132 99 30 50 0900 15 10
North Oregon OTH-AST-PDX 45.05 5.7 130 101 30 50 1200 15 10
South Washington AST-HQM-OLM 46.70 6.5 93 112 35 55 1200 15 10
North Washington HQM-46087-WSP 47.95 17.7 103 298 55 80 1800 15 10
South Vancouver Island TTI-WEB-YQQ 49.20 6.1 132 102 30 50 1400 15 10
Central Vancouver Island WEB-WRU-YZT 50.06 5.6 66 91 30 50 0700 15 10
North Vancouver Island WRU-46207-YZT 50.56 4.7 8 76 25 45 1600 15 10
Interior
Northwest California RBL-LMT-MFR 41.56 4.4 136 83 30 50 0900 15 10
Southwest Oregon MFR-EUG-BDN 43.54 5.6 123 101 30 50 1000 15 10
Northwest Oregon EUG-PDX-AST 45.30 5.8 116 102 30 50 1200 15 10
Willamette Valley EUG-HIO-TTD 45.08 6.7 127 119 35 55 1400 15 10
Southwest Washington PDX-OLM-TCM 46.57 5.8 118 101 30 50 1500 15 10
Puget Lowlands TCM-PAE-CLM 47.73 6.1 103 104 30 50 1500 15 10
Northwest Washington PAE-CLM-YVR 48.41 7.0 69 117 35 55 1400 15 10
Puget Trough OLM-YVR-YHE 48.51 6.1 99 102 30 50 1600 15 10
South Georgia Strait YYJ-YVR-YXX 48.95 5.8 80 97 30 50 1600 15 10
Georgia Strait YYJ-YQQ-WSK 49.38 5.1 118 85 30 50 2000 15 10


By and large, the maximum absolute (2-dimensional) pressure gradients agree quite well with the measured near-surface wind response of the Ides Storm (Table 3.1). The key exception, as shown above (Figure 2.5, Tables 2.2 and 2.3), is the north Washington Coast where the pressure gradient reached extreme, near-record,levels. Given the gradient, the estimated peak wind for the region is around 55 mph (90 km/h) with gusts potentially to 80 mph (130 km/h). This did not happen, save at the very exposed Destruction Island. Other areas with at least a slightly elevated wind speed potential with an estimated wind of 35 mph (60 km/h) gusting 55 mph (90 km/h) include the Willamette Valley and north Washington Interior. Both of these locations did experience winds up to this potential, though for the latter the highest winds were largely confined to exposed stations. Pressure slopes at peak gradient had a tendency to be east-southeast to east, not the most supportive orientation for high southerly winds.


Figure 3.1 above Absolute (2-D) pressure gradients (hPa/100 km) for coastal regions. Trendlines from southern pressure-wind triangles are shaded in orange, with northern in blue.


Figure 3.2 above Absolute (2-D) pressure gradients (hPa/100 km) for interior regions. Trendlines from southern pressure-wind triangles are shaded in orange, with northern in blue.


Figure 3.3 above Intercomparison of the peak absolute pressure (or 2-D) gradient (hPa/100 km) for coastal (black) and interior (gray) locations arranged by mean latitude.


During the Ides Storm, coastal and interior pressure gradients were largely similar over much of the strike zone (Figures 3.1, 3.2 and 3.3). The intense gradient on the north Washington Coast, of course, was the big exception. For coastal stations, the trend towards increasing pressure gradients from south to north is quite similar to the December 11, 2014 windstorm, though with a more extreme peak at the north end. The interior sections really did not follow the pattern, with the highest gradients being roughly the same from south to north, unlike the windstorm in 2014.

With classic-path windstorms, there is a typical pattern of southern regions reaching peak gradient first, followed by a northward migration afterward as the low follows its meridional track. This is seen in the coastal pressure gradients (Figure 3.1). However, the peak gradients for interior regions are much more tightly clustered temporally, almost happening at the same time. It appears that even as the Ides Storm maintained a compact core with intense gradients, the area just outside of this center may have been undergoing a gradual weakening. To some extent, this helps explain the easterly pressure slopes at maximum gradient, as many interior locations may have experienced their peaks even before the low moved north of their given latitude. A case in point is the northwest Washington interior, where maximum gradient occurred at 1400 PST, well before the low reached the latitude of even the southern-most station in the pressure-wind triangle.


Figure 3.4 above Three-dimensional display of the peak absolute pressure (or 2-D) gradients (hPa/100 km) for coastal locations arranged from south to north on the right axis. Flat zones on the left and right margins of the landscape are times without data: the chart extends 48 hours, but only 34 to 36 hours are analyzed.


Figure 3.5 above Three-dimensional display of the peak absolute pressure (or 2-D) gradients (hPa/100 km) for interior locations arranged from south to north on the right axis. Flat zones on the left and right margins of the landscape are times without data: the chart extends 48 hours, but only 34 to 36 hours are analyzed.


Three-dimensional displays of the absolute pressure gradients for the Ides Storm support the previous discussion (Figure 3.4). The extreme peak gradient on the north Washington Coast is hard to miss. The northward progression with maximum gradients happening at later times for coastal sections is also evident with the "mountain" peaks trending along a diagonal. The temporal clustering of interior peak gradients is evident in a long ridge arranged parallel to the time axes (Figure 3.5). The ridge is relatively flat, indicating the tendency for similar peak gradients throughout the interior.


Figure 3.6 above Absolute (2-D) pressure gradient coastal cross-sections (hPa/100 km). Earlier times are represented by the warm colors, with later times the cool colors.


Figure 3.7 above Absolute (2-D) pressure gradient interior cross-sections (hPa/100 km). Earlier times are represented by the warm colors, with later times the cool colors.


The north Washington Coast experienced a dramatic escalation in pressure gradient over the span of about two hours during the Ides Storm (Figure 3.6). The extreme gradient quickly relaxed to a more typical value for a strong Pacific storm in just a single hour. Thus, the time period of most extreme gradient only lasted for a short period, not long enough for winds to accelerate to their full potential, assuming airflow that starts at lower than maximum speeds. However, given a three hour average gradient of 10.6 hPa/100 km (Table 2.2), an extreme value, the pressure gradient still points to the potential for wind gusts approaching 70 mph (115 km/h) for the less exposed locations on the coast. This, of course, did not happen and is discussed in more detail in Section 2.2 above.

The interior absolute pressure cross-sections again show the tendency for maximum gradient around the same time throughout much of the study area (Figure 3.6). From approximately 44.5º to 49.0ºN, say from Eugene north to Vancouver, British Columbia, interior pressure gradients peaked around 1400 PST, about the time the low had reached the latitude of Hoquiam, Washington. Then the gradients held roughly steady or began slowly relaxing, save for the northern-most regions, even as the low continued its north-northeast track to the south Vancouver Island shore.


4.0 Summary and Conclusions

The October 15, 2016 "Ides Storm" followed a classic path, tracking meridionally up the Pacific Coast. Relative to the classic windstorms with good data, the Ides Storm is among those systems that tracked quite close to the coast, approaching 125ºW at the time of landfall on Vancouver Island. The Ides Storm also had an extreme central pressure at peak depth, estimated at 967 hPa just before landfall. As it tracked northward, the storm brought strong to intense pressure gradients over Cascadia. All these conditions are favorable for high winds both on the coast and in the interior. Despite this, reported peak gusts relative low, just 81% of an average determined from 12 classic windstorms from 1940-2016 (Ides Storm included).

Key reasons for the relatively low peak gust speeds appear to be as follows:

1) The pressure gradient orientation tended to be strongly easterly, even relatively close to the storm center. The reduced the support for strong south winds after the storm had passed to the north of a given latitude.

2) The reason for the tendency for easterly pressure gradients is twofold. First, the storm had a very compact core, with the strongest gradients confined to a region encompassed by about 1º of latitude. Second, due to the compact nature of the storm, the exact track mattered greatly. Had the extratropical cyclone followed a path closer to the 1962 Columbus Day Storm, moving inland just east of Tatoosh Island, the pressure gradient orientation over western Washington would likely have shifted more favorably for strong southerly winds.

3) The Ides Storm's leading frontal system trailed the low considerably, assuming a strongly meridional orientation. This is a recipe for slow frontal movement that probably limited pressure rises in the wake of the storm, a situation that is unlike many stronger windstorms that brought with them fronts with more progressive longitudinal (negative tilt becoming positive tilt) arrangements. The leading frontal system is often the feature that scours out the typical entrenched cold surface layer that is often present ahead of incoming low-pressure centers. The cold surface layer can act as a shield against vertical mixing of upper momentum. The strongest vertical mixing mechanisms may also be associated with the front. Closer coincidence of frontal passage with the closest approach of the low is likely a better recipe for high winds.

4) A relatively deep and mature low tracked into the region right after the Ides Storm. The mature system appears to have helped limit pressure rises in the Ides Storm's wake. This trailing low also likely forced the pressure gradient orientation back to a more easterly orientation, unfavorable for strong south winds at many locations in the region, relatively quickly.

5) Two strong storms moved through the area from October 13th to 14th, helping depress surface pressures throughout the region. The Ides Storm developed in this area of already low background pressure. Thus, the estimated minimum central pressure of 967 hPa (28.56" Hg) is probably best adjusted upward to around 980 hPa (28.94" Hg) when considering the storm's potential for high winds. The compact nature of the Ides Storm, with a limited area of high winds, is reminiscent of typical 980 to 988 hPa (28.94" to 29.18" Hg) extratropical cyclones.

The Ides of October Storm of 2016 is a reminder that every windstorm is unique, bringing its own flavor to the region. Even when many of the necessary ingredients are in place, high winds may not materialize.


Data Sources and Bibliography


Data Sources

Surface observations are from the National Climatic Data Center, the National Data Buoy Center, Environment Canada and the University of Washington. Surface maps used for storm track determination are from the US. Weather Prediction Center. Upper-air analysis is based on maps from the US. National Center for Environmental Prediction. Satellite photos are from the US. National Weather Service. Upper-air sounding data are from the University of Wyoming Department of Atmospheric Science.

Peer-Reviewed References

Lynott, R. E. and O. P. Cramer, 1966: Detailed analysis of the 1962 Columbus Day windstorm in Oregon and Washington. Mon. Wea. Rev., 94, 105-117.

Mass, C. F. and B. Dotson, 2010: Major extratropical cyclones of the Northwest United States: Historical review, climatology and synoptic environment. Mon. Wea. Rev., 138, 2499-2527.

Last Modified: November 27, 2016
Page Created: October 26, 2016

| Back |