 |
|
A Review of Winter 2010-2011
4/11/2011 During the autumn of 2010, there was considerable media interest in anticipation of the forthcoming winter being cold and wet in WA as a result of the relatively strong La Niña in the equatorial Pacific Ocean. La Niña definitely increases the odds of a colder and wetter than normal winter in the Pacific Northwest, but how did this past winter actually turn out? Figure 1 shows the sea surface temperature (SST) anomalies from 2000 through February 2011 in Niño 3.4 region of the equatorial Pacific Ocean. As seen in the figure, the anomalies stayed at about 1.5°C throughout the whole winter. The Niño 3.4 index indicates that this La Niña was a moderate event, and you can see in Figure 1 that the Niño 3.4 SST anomalies are on par with the ones in 2007-08. Another measure of this phenomenon, the multivariate ENSO index (MEI), classified this event as strong since its onset (more info). In terms of the MEI, the anomalies during the present case have kept pace with those of the 6 strongest La Niña events in the historical record. The event is weakening in both indices, and conditions are expected by the Climate Prediction Center to return to near neutral by the summer. 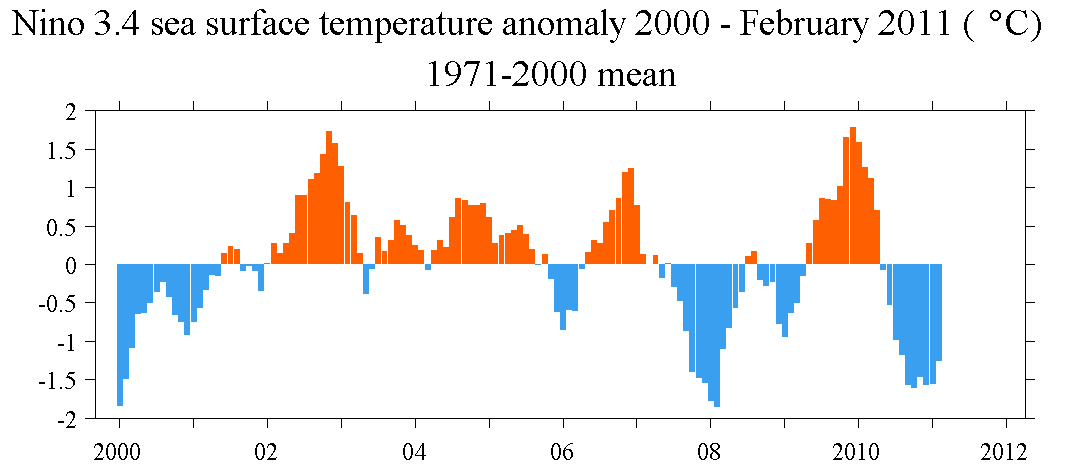
Figure 1: SST anomalies from 2000 through February 2011 in the Niño 3.4 Region of the tropical Pacific. Figure created by Todd Mitchell (JISAO). Please click on the figure to see the full-size image. How did this year's seasonal temperature and precipitation anomalies compare with those of past La Niña events? Figures 2 and 3 show the composite temperature and precipitation anomalies for past La Niña events as defined by Bond and Harrison (2006), indicating cooler and wetter than normal conditions for the Pacific Northwest. The temperature anomalies compared to the 1971-2000 normal for this past winter (Figure 4) were between 0.5°F and 1.5°F cooler than normal for most of the WA climate divisions and of similar magnitude to the temperature anomalies in the composite image. The precipitation anomalies for the past winter (Figure 5) were also similar to composite numbers, with wetter than normal conditions statewide though not quite as wet in western WA as the composite images show. On the other hand, the 2010-2011 temperature anomaly image indicates that this was not the "typical La Niña" for the US as a whole; the east coast, mid-Atlantic, and the southeast, for example, were cooler than normal (Figure 4) when past La Niña events indicate that conditions should have been warmer than normal (Figure 2). The precipitation pattern for the US was much more consistent with past La Niña events. 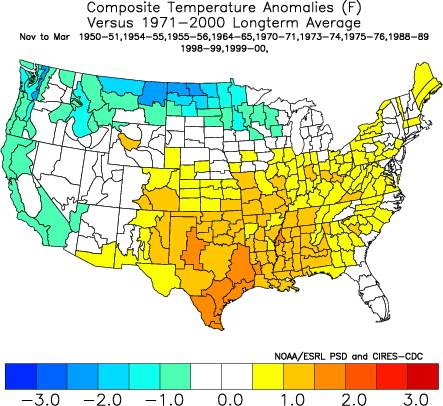
Figure 2: Composite Nov-Mar temperature anomalies (Fahrenheit) for the past La Niña events (from ESRL). 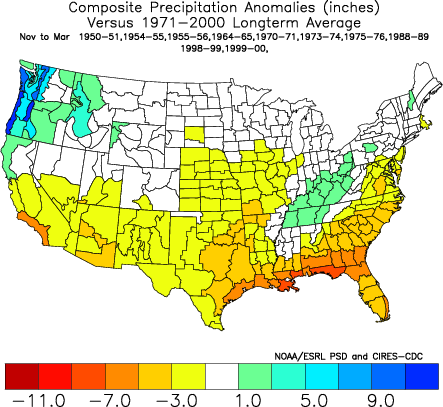
Figure 3: Composite Nov-Mar precipitation anomalies (inches) for the past La Niña events (from ESRL). 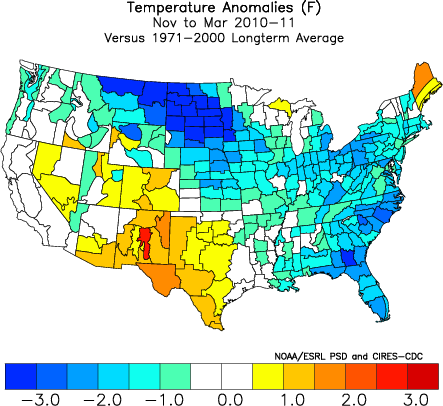
Figure 4: Nov-Mar temperature anomalies (Fahrenheit) from the 1971-2000 normal for the 2010-2011 winter (from ESRL). 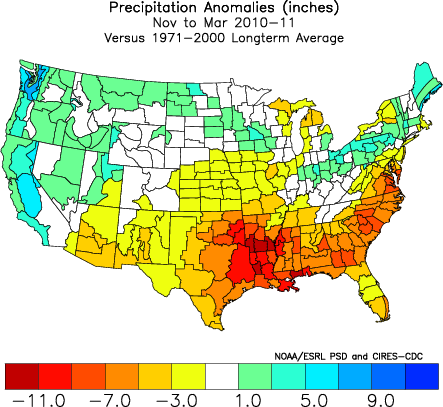
Figure 5: Nov-Mar precipitaion anomalies (inches) from the 1971-2000 normal for the 2010-2011 winter (from ESRL). The average 500 hPa geopotential height anomaly field for November through March is also shown below, both for the composite La Niña events (Figure 6) and for this past winter (Figure 7). For both the composite of La Niña events and this past winter, above normal 500 hPa heights are prominent from the central North Pacific into the Bering Sea. On the other hand, past La Niña events have generally been accompanied by decidedly negative 500 hPa heights extending from the Pacific Northwest across western Canada and eastern Alaska, and the past winter included only a weak manifestation of this feature (note that Figs. 6 and 7 have different color bars). An important consequence was a weaker westerly flow this winter (though still greater than normal), bringing somewhat less moisture to WA than what may otherwise be expected during a La Niña event. 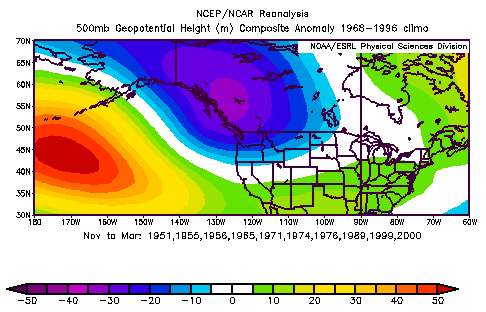
Figure 6: 500 hPa geopotential height anomalies from November through March for past La Niña events from ESRL. 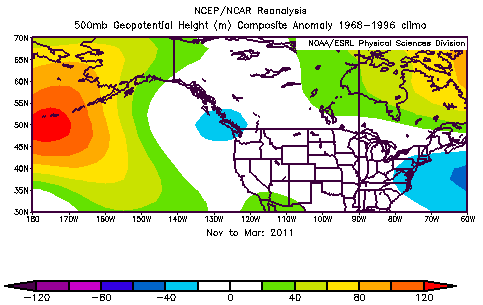
Figure 7: 500 hPa geopotential height anomalies from November 2010 through March 2011 from ESRL. The average winter conditions describe what the season was like in general, but examining the sub-seasonal variations gives more insight into how the winter progressed. You may recall that the beginning of November was quite mild. The mild spell in combination with an unusually cold and snowy period at the end of the month resulted in very large ranges of high temperatures in one month: 51°F for Spokane and 60°F for SeaTac Airport, for example. Despite the cold and snow at the end of November, the month was generally on the dry side for most of WA. In contrast with November, December was generally warmer and wetter that normal. Much of the December precipitation fell in one heavy event on the 11th and 12th. January was also warmer than normal for most of the state, but the precipitation varied greatly; the east slopes of the Cascades and most of central WA was dry while the rest of the state was either at or above normal for precipitation. By the end of January, the snowpack in the Cascades was below normal for that point in the season. A shift from the warmer than normal conditions finally occurred in February, however, as the month was much colder than normal (~4°F in some places) for the state. Precipitation was still below normal, but a few of the storm systems brought needed snow to the mountains. March was extremely wet for many portions of the state and the cool, active weather pattern brought heavy snow to the mountains. Snowpack statewide built to normal to above normal depths from the end of February through March. The April 1 percent of normal snow water equivalent (SWE) from the National Resources Conservation Service is shown in Figure 8. The Olympics, north Cascades, south Cascades, and the Blue Mountains all have above normal SWE while the central Cascades and the Spokane basin are near normal. This is good news for the summer water supply, and the Northwest River Forecast Center's March 31 water supply forecast (Figure 9) projects streamflow from now through September to be normal (90-110%) to above normal (110-125%). 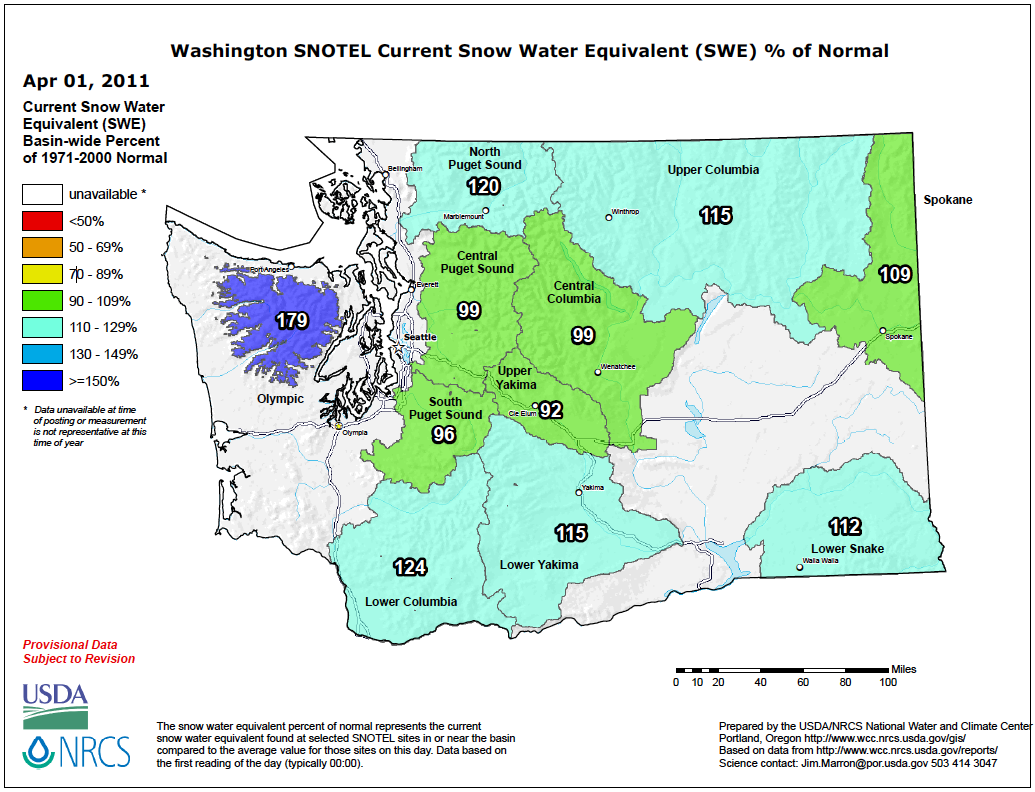
Figure 8: Snowpack (in terms of snow water equivalent) percent of normal for WA as of April 1, 2011 (from NRCS). Please click on the figure to see the full-size image. 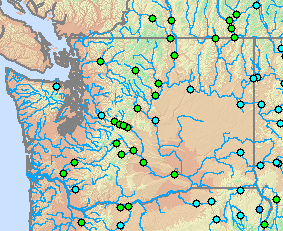 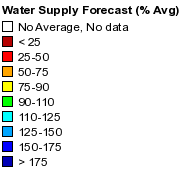 Figure 9: April through September 2011 water supply forecast for WA as of March 31, 2011 from the National Weather Service River Forecast Center. Seasonal totals of lowland snow varied around the state and did not fit into a clear pattern. Table 1 shows Nov-Mar total snow for several WA stations as well as the 1971-2000 normal. Many stations east of the Cascade Mountains had close to normal or above normal total snowfall for November through March. Seasonal snow totals tended to be near-normal on the west side of the Cascades. 
Table 1: Total November 2010 through March 2011 snowfall (inches) for several WA stations. Note that the Bellingham snow normal was taken from the Bellingham International Airport site. In summary, the fall forecast for a relatively cool and wet winter for WA was an accurate one, though the temperature anomalies were perhaps not as strong as initially thought. The strong SST anomalies in the fall indicated that the 1955-1956 winter might be a good analog year. That idea did not really pan out, however, as the 1955-1956 winter was much colder than normal (Nov-Mar anomalies between 2 and 6°F). As for next winter, forecasts made at this point in the season (spring) have very little skill. Once summer rolls around, ENSO predictions become more reliable, and we should then be able to anticipate how it is liable to impact our weather for the following fall and winter. ReferenceBond, N.A., and D.E. Harrison (2006): ENSO's effect on Alaska during opposite phases of the Arctic Oscillation. International Journal of Climatology, 26, doi: 10.1002/joc.1339.
|


 |