 |
|
Monitoring Precipitation near the Howard Hanson Dam
The heavy rainfall in January 2009 damaged the Howard Hanson Dam (located on the Green River in King County). The water was stored in the dam at a record high elevation of 1189 feet resulting in two depressions in the right abutment of the dam. Measures have been taken to temporarily fix the damage, and communities potentially affected have been making preparations since the damage was first discovered. Mountain precipitation was below normal this winter (thanks, in part, to the El Niño) and flooding was not an imminent risk for the Green River at any point. We will continue to post the water year precipitation at the two sites near the dam for the remainder of this water year and for next. The dam's reduced capacity for holding water in the reservoir still poses a danger for next winter as the permanent fix for the dam will take sufficient time to complete. Figure 1 shows a map of the stations in the vicinity of the Howard Hanson Dam, with some of them labeled. The dam and the reservoir are enclosed in the black box on the map. To find out more about the stations near the dam, visit our Climate Inventory Map. Two stations near the dam (Cougar Mountain SnoTel and Landsburg COOP) report real-time precipitation data, and the accumulated precipitation for the 2010 water year (Oct 1, 2009 through Sept 30, 2010) will be plotted on this page compared to the 1971-2000 normal (Figures 2 & 3). The 2009 water year accumulated precipitation is also plotted for the Cougar Mountain station. This information will be updated in near real-time to monitor the precipitation in the dam vicinity compared to the 30-year normal. More information regarding conditions near the dam can be found at the National Weather Service Seattle site. Please see the 2011 water year page for the latest information. 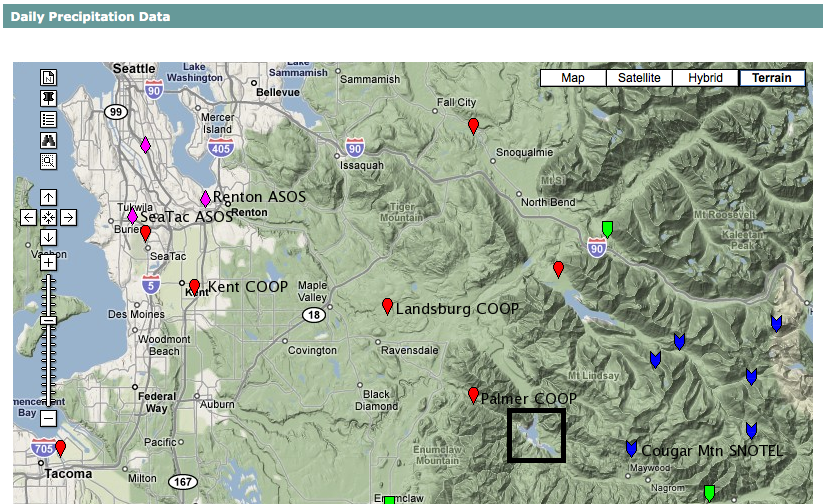
Figure 1: Stations around the Howard Hanson Dam (enclosed in the black box). Selected stations are labeled. Please click on the figure to see the full-size image. 
Figure 2: 2010 water year accumulated precipitation for Cougar Mountain SnoTel (green) compared to the 30-year normal (black). The accumulated precipitation for the 2009 water year is also plotted (blue). Please click on the figure to see the full-size image. 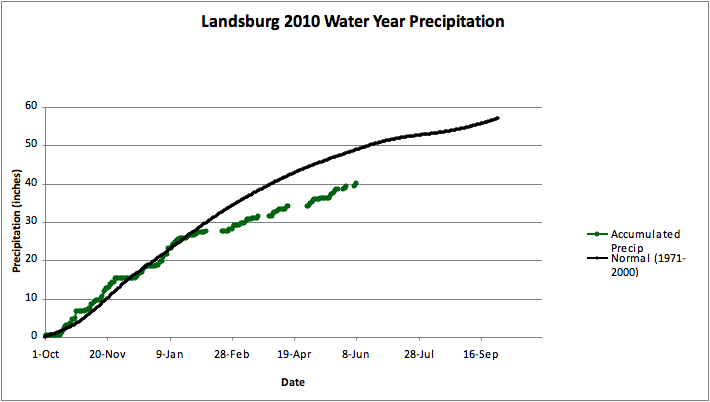
Figure 3: 2010 water year accumulated precipitation for Landsburg (green) compared to the 30-year normal (dashed black). The preliminary station data has many consecutive days of missing data in February, March, and April (indicated by the blank space on the graph) so the cumulative precipitation sum is now underestimated. Please click on the figure to see the full-size image. [This figure will no longer be updated due to the large amount of missing data].
|


 |