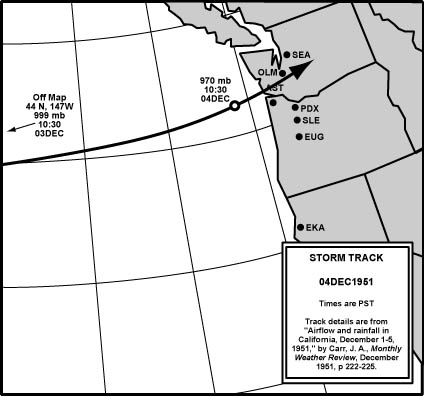
The Major Windstorm of December 4, 1951 compiled by Wolf Read |
|
The powerful cyclone of December 4, 1951 was a major event for Oregon. This was the storm that people remembered and discussed up until the Columbus Day Storm of 1962. The windstorm established many record barometric minimums that either still stand today, or were surpassed only by 1962 Big Blow 11 years later, or the December 12, 1995 windstorm some 44 years later. Massive windthrow occurred in parts of the Coast Range, resulting in a loss of billions of board feet. High winds found their way through much of Oregon, with gusts of 65 to 75 mph not uncommon even east of the Cascades. For the Beaver State, this was likely the most powerful windstorm of the 1950s. Unfortunately, peak gust records aren't as complete from1951 as they are during later times, such as in 1962 during the great Columbus Day storm. Judging from anecdotal accounts, wind speeds were probably much higher on the South Coast of Oregon than indicated, as well as at some inland areas, such as Salem. Corvallis had peak 1-minute winds of 64 mph, with a gust to 72 noted. Eugene showed peak 1-minute winds to 40, with a similar strength gust to Corvallis. It's possible that brief gusts over 72 mph affected Corvallis and they just weren't noted--bursts to 90 aren't out of the question. Later storms like the Columbus Day event would show 1-minute winds of 58 to 69 mph across the South Willamette Valley, with gusts of 86 to 127, which is why the 1951 readings are called into question. Salem in 1951 had a similar maximum 1-minute wind to Eugene, but with a peak gust of just 52 mph noted. Judging from Eugene, gusts at Salem could have easily been higher than 52. The December 4, 1951 windstorm contributed to a massive outbreak of Douglas-fir
beetle (Dendroctonus pseudotsuqae) that occurred after the devastating
storm seasons
of 1950-51,
1951-52 and
1952-53 [1]. October 26-27, 1950 witnessed
two strong, fast-moving windstorms that were felt throughout much of the
Pacific
Northwest. This was followed a few months later by a strong
gale on January 15, 1951. During the summer, Douglas-fir beetles built up
quickly in the downed timber from these, and lesser, storms. According to
foresters, the windthrow caused by December 4, 1951 windstorm was unparalleled
in the past 40 years [2] and added fuel for the Douglas-fir beetle fire.
A double
windstorm strike during January 7 to 9, 1953 provided more
fodder. Source: National Climatic Data Center, unedited surface observation forms, and "Airflow and rainfall in California, December 1-5, 1951," Carr, J. A., Monthly Weather Review, December 1951, p 122-125. |
|
General Storm Data Pressure Minimums and Maximum Gradients Table 1, below, lists the lowet barometric pressures achieved during the December 4, 1951 storm for 11 Pacific Northwest locations. The incredibly low readings at Salem, Olympia and Sea-Tac were records that stood for 44 years--it took the powerful December 12, 1995 cyclone to best them. The Portland reading still stands as the lowest barometer for December (not quite beat by the 28.73" low during December of 1995), and is #2 overall next to the 28.56" reading from the January 9, 1880 Storm King. One of the lowest inland readings during the December 4, 1951 storm was at Chehalis, Washington, with a minimum of 28.66". The near-equal timing of pressure minimums from Eugene northward is the mark of a cyclone moving inland with a strong eastward motion. Of significance is the 28.62" altimeter reading at Astoria. The Columbus Day storm would produce the exact same sea level pressure reading. The potentcy of the December 4, 1951 storm is reflected in this low barometer. Source: Pressure minimum data is from the National Climatic Data Center, unedited surface observation forms, save for the Portland reading, which is from the NCDC's Local Climatological Data, December 1951. |
|
Notes Table 1: [1] No sea level pressure data on the surface observation forms for Astoria in the 1951 time period.The reading is from notations of altimeter, which is a good approximation. [2] Pressure readings at North Head were taken at 3-hour intervals, and the 28.61" low is the lowest 3-hour reading. Note that at 16:00 (3 hours later), the barometer still read an incredibly low 28.62", and during the time between the two readings the pressure could have been lower. [3] The barometer at Olympia stayed below 28.80" for seven consecutive hours. [4] The barometer at Sea-Tac stayed below 28.80" for four consecutive hours. [5] Average exludes the North Head reading. |
Figure 1, below, shows the sea-level pressure trends for Pacific Northwest interior stations. Minimums get steadily lower from Medford to Portland, before "leveling off" from Portland to Olympia--the cyclone passed between these stations, and produced a similar effect on their barometers. Barometers north of Olympia showed higher readings. Minimums between 970 and 975 mb are incredibly rare. |
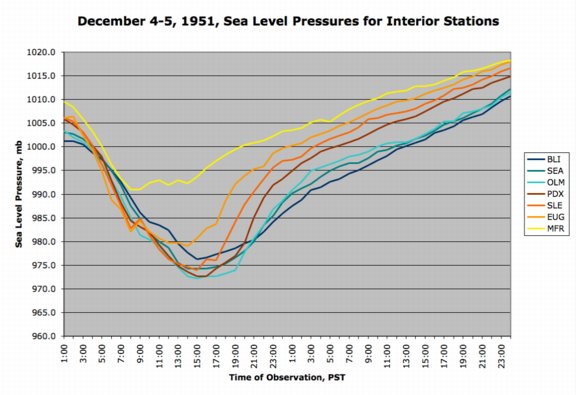
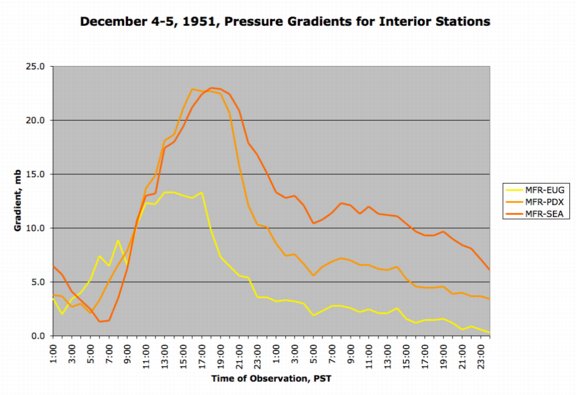
Table 2, below, lists the maximum pressure gradients achieved during the December 4, 1951 storm for 10 Pacific Northwest measures. Note the striking -7.4 mb gradient north of Astoria, while at the same time a strong +21.3 mb gradient resided south of the same location to North Bend, indicating that the deep low was making landfall at that time (16:00) very close to Astoria/North Head. The +15.2 mb reading for EUG-PDX is the strongest Willamette Valley gradient found for the 1948-2002 period. It is significantly higher than the Columbus Day Storm's +9.9 mb, and 1.5 mb higher than the October 2, 1967 storm's +13.7 mb. Source: all pressure gradient data is calculated from hourly readings obtained from the National Climatic Data Center, unedited surface observation forms, and in the case of Portland, Local Climatological Data, December 1951. |
|
Notes Table 2: [1] No sea level pressure data on the surface observation forms for Astoria in the 1951 time period, though hourly altimeter data is available for part of the day, which provided the minimum pressure at Astoria. For this table, North Head data sits in for Astoria. Since pressure was recorded in 3-hour intervals at North Head, the gradient is the largest among the 3-hour observations (as opposed to 1-hour for other stations). [2] See [1], above. Plus, no pressure data for Quillayute in the 1951 time period. The data is for Tatoosh Island. [3] See [1], above. [4] No pressure data for Quillayute in the 1951 time period. The data is for Tatoosh Island. [5] Available pressure data for Portland was in 6-hour intervals, so this reading could be low, and the timing of the actual maximum gradient could be different. [6] See [5], above. |
Figure 2, below, shows the trend in pressure gradients during the storm. The MFR-EUG gradient, though strong, peaked at a level below some other windstorms of history, such as Columbus Day 1962. The MFR-PDX readings got quite strong. MFR-SEA doesn't get higher that MFR-PDX because the low passed between PDX and SEA. What's not shown on this graph are the extreme short-distance gradients in the Willamette Valley. The EUG-SLE reading peaked at +8.5 mb (+0.25") at 18:00 PST, and the SLE-PDX reading reached +8.1 mb (+0.24") at 20:00. For the longer EUG-PDX gradient, readings at the 8.0 to 8.5 mb level can be indicative of a significant windstorm! No doubt the December 4, 1951 cyclone was a major event! |
Pressure Tendencies Table 3, below, lists the peak hourly fall and climb at eleven key stations in the Pacific Northwest during the December 4, 1951 storm. Some of the declensions are phenomenal. Eugene's -6.1 mb (-0.18") single-hour declension is the highest ever recorded at the station (as far as it known), and is among the sharpest drops ever indicated for any of the stations. At Salem, starting with the 04:00 observation, the hourly declension rate sustained at -4.0 to -4.8 mb (-0.12" to -0.14") for four consecutive hours, totalling -17.6 mb (-0.52"). The -4.5 mb (-0.13") average drop is very close to the -4.6 mb (-0.136") average that occurred during the great Columbus Day Storm of 1962, a near match to the benchmark windstorm. Pressure rises during the December 4, 1951 windstorm were quite strong for some stations, but none are records. Source:Pressure tendency data is calculated from hourly readings obtained from the National Climatic Data Center, unedited surface observation forms, and in the case of Portland, Local Climatological Data, December 1951. |
| ||||||||||||||||||||||||||||||||||||||||||||||||||||||||||||||||||||||||||||||||||||||||||
Table 3 Notes: [1] Hourly sea-level pressure data not reported for Astoria in 1951--though the Kollsman setting (altimeter) was noted from 06:30 to 19:00 each day. Three-hourly sea-level pressure records at North Head were used. Max hourly changes are the average rate determined by dividing the three-hourly tendency by three. Both the peak rate of fall and rise indicated are probably low. Indicated times are the end-time for the three-hour tendencies. The time of max hourly rise is the last of two consecutive +9.8 mb three-hourly occurrences. |
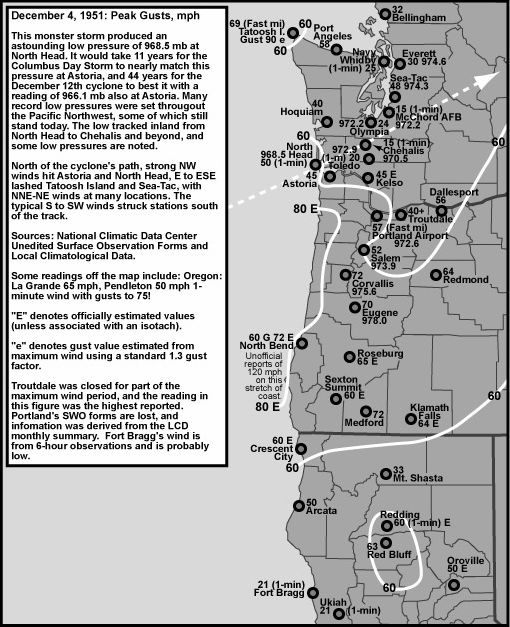
Peak Wind and Gust Table 4, below, list the peak wind and gust for eleven key stations in the Pacific Northwest for the December 4, 1951 windstorm. With an average peak gust of 54.5 mph for the eleven stations, this storm was just shy of the major category of 55.0 mph-plus storms. The track across Southwest Washington, which spared northern locations like Olympia and Bellingham strong winds, contributed to lowering this storm's average. The December 4, 1951 cyclone produced a wide variety of wind directions--almost a confusion. A strong westerly surge nailed places like Arcata, North Bend and Medford--apparently in association with a powerful cold front. West winds struck more weakly at Olympia, long after the low had passed through the region. Powerful south winds raced up the Willamette Valley as the low tracked inland just north of Portland. From the available readings, this southerly gale was clearly one of the most powerful to strike the Willamette Valley in the 1950-to-present timeframe. It is a good bet that Salem's reported peak gust of 52 mph is lower than what actually occurred. In Washington, strong easterly winds pummeled Sea-Tac and Tatoosh Island as the storm raced toward the coast, with brisk north-northeast winds at Bellingham. These were the typical pre-storm easterlies, though their strength was fairly unusual at places such as Sea-Tac. The Cascade foothills region probably received a significant easterly gale out of this event. The low's southerly track prevented destructive southerly winds from striking much of Western Washington. Olympia was spared a gale, though there was fear that such would strike: a forecast of 35 to 45 mph winds with possible gusts to 60 was noted on Olympia's observation form. It was a close call for Olympia, with strong winds striking Kelso just 50 miles to the south. |
| Location | Peak |
Direction |
Obs Time of |
Peak |
Direction |
Obs Time of |
| California: | ||||||
| Arcata | 30 |
SE |
07:10 HRS, 4th |
50 |
WSW |
15:30 HRS, 4th |
| Oregon: | ||||||
| North Bend [1] | 60 |
W |
16:28 HRS, 4th |
72 |
W |
16:28 HRS, 4th |
| Astoria [2] | 30 |
W |
17:15 HRS, 4th |
45 |
E |
11:00 HRS, 4th |
| Medford | 35 |
SSE |
07:09 HRS, 4th |
72 |
WSW |
12:32 HRS, 4th |
| Eugene [3] | 40 |
SW |
16:28 HRS, 4th |
70 |
SSW |
13:35 HRS, 4th |
| Salem | 40 |
S |
14:28 HRS, 4th |
52 |
S |
14:28 HRS, 4th |
| Portland [4] | 57 |
S |
MM, 4th |
74 |
S |
MM, 4th |
| Washington: | ||||||
| Tatoosh I. [5] | 49 |
E |
09:28 HRS, 4th |
60 |
E |
09:28 HRS, 4th |
| Olympia | 16 |
W |
00:28 HRS, 5th |
24 |
W |
00:28 HRS, 5th |
| Sea-Tac | 35 |
ESE |
10:26 HRS, 4th |
48 |
ESE |
10:25 HRS, 4th |
| Bellingham | 20 |
NNE |
14:28 HRS, 4th |
32 |
NNE |
14:28 HRS, 4th |
| AVERAGE | 37.4 |
S |
54.5 |
S |
Table 4 Notes: [1] Peak gust is noted as an estimated reading. [2] Wind records were taken at Astoria from about 06:00 to 19:00 each day in 1951. Peak winds occurred in the hour before the last observation for the day (last obs was 18:00 on December 4th). The 30 mph peak wind is the last of six occurrences. [3] The 40 mph peak wind at Eugene is that last of four occurrences. [4] Unedited surface observation forms missing for Portland. The peak wind value is peak fastest mile as reported in the Local Climatological Data (LCD) monthly summary for Portland, December 1951. Peak gust is estimated from peak wind using a standard 1.3 gust factor. Time of peak wind was not noted. From the available six-hour observations on the LCD, the highest noted winds, SSW 28 mph, were at the 16:00 hour on the 4th. [5] Peak wind and gust is the last of two occurrences. Gust indicated as estimated on the observation form. |
References [1] Hagenstein, W. D. and Furniss, R. L. 1955. “Cooperation speeds salvage of windthrown and beetle-killed timber in Oregon and Washington.” Society of American Foresters Proceedings. P 167-168. [2] Forest Log. 1952. “Timber stands hit by December gales.” January 1952. Vol. 21, no. 6, p 4. [3] Same reference as [1], above. |
Last Modified: March 10, 2004 You can reach Wolf via e-mail by clicking here. | Back | |