With little fear of exaggeration, it
can be stated that the Columbus Day Storm of 1962 was the most powerful windstorm
to strike
the Pacific Northwest in the 20th century. Certainly no windstorm since
has generated as much widespread devastation as the Big Blow, not even close.
Comparisons of peak gusts, where they can be had, tend to put the Big Blow
at the top, but such figures are abstract, and often don't reveal the very
reasons why those who lived through the Columbus Day Storm remember it so
vividly. The sudden violence of the wind compelled many people to take cover
in their homes or basements, a lasting memory, and the sheer magnitude of
destruction, in literally all categories of accounting, puts this storm
far above any other. For example, the northwest Oregon town of Lake Oswego
had about 4,000 houses within its borders in 1962--the Columbus Day Storm
damaged 70% of these structures [1]. A more typical windstorm might not
even harm this many houses within the entire range of its influence. Indeed
throughout the Willamette Valley, undamaged homes were the exception, not
the rule. In 1962 dollars, the Columbus Day Storm caused an estimated
$230-280 million in damage to property in California, Oregon, Washington
and British Columbia combined, with $170-200 million happening in Oregon
alone [2]. This damage figure is comparable to eastern hurricanes that made
landfall in the 1957-1961 time period: Audrey, 1957, $150M, Donna, 1960,
$387M, and Carla, 1961, $408M [3]. The "Big Blow" was declared
the worst natural disaster of 1962 by the Metropolitan Life Insurance Company.
In terms of timber loss, about 11.2 billion board feet was felled by the
Big Blow in Oregon and Washington combined. In sheer gustiness of wind,
as indicated by the ratio of maximum gust speed to sustained wind speed,
called the gust factor, the Columbus Day Storm behaved more like a hurricane
than a typical midlatitude cyclone [4]. The large number of 1,000-year-old
plus trees blown down suggests that the Columbus Day Storm may have been
the event of the millennium [5], though such inferences are speculative
at best.
The Columbus Day Storm was born explosively when the highly degraded
extratropical remains of typhoon Freda drifted into a powerful storm formation
zone off of northern California and regenerated the ailing cyclone [6].
The extratropical cyclone origin gives the event a unique place among Northwest
windstorms, for, as far as is known, this has not happened at any other
time in the period of climatological record. Certainly the remains of dead
typhoons have arrived on the Pacific Coast on many occasions since 1950,
but few have come ashore as strong storms, and none but the ghostly remains
of Freda in 1962 have been spun into a terrific wave cyclone. The abundant
energy that arrived with the tropical system may partly explain the level
of violence achieved during the Big Blow. And this tropical influence suggests
that the storm of 1962 be placed in its own category. A lone, dark overachiever
whose closest cousins may be those powerful extratropical storms experienced
on the East Coast, such as post-landfall hurricane Hazel of 1954. There
are other reasons for a unique place in Pacific Northwest climatology, such
as pressure tendencies that mirrored fast-moving landfalling systems while
the center of the Columbus Day cyclone stayed offshore, as will be discussed
in detail in the storm data section, and simply the storm's incredible peak
wind velocities (more on this shortly).
The Columbus Day Storm struck at a time when many regularly reporting
weather stations were operating. This gives the Big Blow a unique place
when it is compared to major events that are deeper in the past, such as
the 1880 Storm King. With a large body of good data, the storm can be studied
in great detail, from its formation, to its track, and its effects at a
wide variety of locations. Of course, many storms have struck during the
period of excellent climatological record. Out of all these tempests, the
Columbus Day Storm was an event that generally stands far above the others.
It is for the above reasons that the Columbus Day Big Blow is often used
as a benchmark for comparing windstorms, as is done at this website. Thus,
many facts and figures about the Columbus Day Storm are found on pages dedicated
to other windstorms.
However, caution should be used when making certain types of comparisons.
As discussed on the December 12, 1995 windstorm page, there are aspects
about the Columbus Day Storm that are different from the standard attack
from a big cyclone passing northward off of the Pacific Coast. The Columbus
Day cyclone's minimum central pressure of about 960 mb really wasn't that
unusual among the other big storms of history [7]. For instance, with a
minimum pressure of 954 mb, the December 1995 storm was deeper, as was the
November 1981 storm's 958 mb [8]. However, the Columbus Day winds were much
stronger than the 1995 and 1981 storms. The 11-station average peak gust
figures used on this website reveal this: 61.4 for December 1995, 65.9 for
November 1981, and a screaming 80.5 for Columbus Day 1962 [9]. The Big Blow
of 1962 was the only storm to break 70 in the 11-station measure for the
1950-to-present era, and it accomplished this by a large margin! The Columbus
Day Storm is an outlier, a singularity. An event like the Columbus Day Storm
probably won't happen again for another 100 years, maybe even 1,000. For
some comparisons, the Columbus Day Storm probably should be put in its own
category--especially when trying to forecast the peak wind potential of
a new cyclogenic bomb based on windstorm climatology. |
References for the Above Introduction
[1] Oregon City Enterprise-Courier, October 15, 1962, p. 9.
[2] Damage estimates are from may sources, including, (1) Lucia,
E., The Big Blow, p 64. (2) Phillips, Earl L, "Columbus
Day Storm in Washington October 12, 1962," Weather Bureau State Climatologist
Office, no completion date given. (3) Sumner, Howard C, "Pacific
Coast storm, October 11-13, 1962," Weekly Weather and Crop Bulletin,
National Summary, U.S. Department of Commerce, Weather Bureau,Vol XLIX,
No. 44, October 29, 1962. Other figures cited after this line also from
these sources, unless indicated otherwise.
[3] Simpson, R. H., Riehl, H., The Hurricane and its Impact, p.
21.
[4] See, Simpson, R. H., Riehl, H., The Hurricane and its Impact, p. 204-212, for a more thorough explanation of gust factor and how it
relates to hurricanes and other types of storms. Basically, a typical midlatitude
storm might generate gusts about 1.3 times that of the sustained wind speed,
and a hurricane's gusts often reach 1.5 times the sustained windspeed. Though
many locations saw gusts in the 1.3 range in the Columbus Day Storm, there
were those with significantly higher ratios: take Bellingham, WA, for instance,
which reported at 23:58 PST sustained winds of 58 mph with gusts to 98.
That's a ratio of over 1.6.
[5] Oregonian, November 17, 1981, suggested in the Editorials
Section, page B4.
[6] Discussion on the storm's tropical connection can be found in several
references, including: (1) Franklin, Dorothy, "West Coast Disaster,"
in the technical discussion, "The Terrible Tempest of the Twelfth."
(2) Lynott, Robert E., Cramer Owen P, "Detailed analysis of the 1962
Columbus Day windstorm in Oregon and Washington," Monthly Weather
Review, February 1966, Page 110.
[7] Minimum central pressure for the Columbus Day Storm is from Lynott,
Robert E., Cramer Owen P, "Detailed analysis of the 1962 Columbus Day
windstorm in Oregon and Washington," Monthly Weather Review,
February 1966.
[8] Minimum central pressures for the November 1981 and December 1995
storms are from Willson, Dave, Kosovitz, Ira, "Columbus Day 1962 Storm,"
online summary provided by the National Weather Service, Portland,
aired on October 2002.
[9] Peak gust data is from the National Climatic Data Center,
unedited surface observation forms for Aracta, Medford, North Bend, Eugene,
Salem, Portland, Astoria, Olympia, Sea-Tac, Tatoosh Island and Bellingham,
October 12, 1962 (forms WBAN 10A and 10B). |
As Powerful as a Hurricane
Table 1, below, compares the Columbus Day Storm peak gusts
to those of Hurricane Hazel. There is a tendency among weather officials
not to do these kinds of comparisons because the two types of storms--midlatitude
cyclones and hurricanes--are so different. There is also the added "taint"
from the fact that the Columbus Day Storm was generated in part by entraining
the extratropical remains of typhoon Freda, and the news media in some cases
suggested that the Columbus Day Storm was Freda. However, hurricane
Hazel, after making landfall near Myrtle Beach, SC, and then shooting northward
up the Eastern Seaboard, "degenerated" into a very powerful extratropical
cyclone, according to some interpretations of the events in 1954. (For hurricanes
that accelerate rapidly northward, it often becomes difficult to ascertain
just when the core becomes extratropical. See especially Simpson, R. H.,
and Riehl, H, "The Hurricane and its Impact," pp. 178-184 for
more a more thorough discussion of this fact.) So possibly Hazel wasn't
a far cry different from the Columbus Day Big Blow--both storms seem to
have spent part of their existence in a gray zone between solidly defined
hurricanes and midlatitude cyclones, the mark of Nature's disdain for the
hard categories often created by humans. And, indeed, there are plenty of
similarities between Hazel and the Columbus Day Storm: both storms had a
significant tropical influence, both made landfall in mid-October, the two
storms first struck to the south and then veered northward at a fast clip
and raced all the way into Canada, they kicked up record wind speeds over
a large part of their prospective afflicted coastal strips, and they dumped
heavy rains over large regions. And so, we have the side-by-side comparisons
of wind speeds below. This is to remind the reader just how powerful the
Columbus Day Storm was, evidence that the Pacific Northwest can be struck
by truly severe weather on occasion. |
Columbus Day Storm of October 12, 1962
And Hurricane Hazel
of October 15, 1954 |
Columbus Day 1962 |
Hazel 1954 |
| Location |
Peak Gust |
Location |
Peak Gust |
| Newport, OR |
138 mph |
Patuxent River NAS, MD |
127 mph |
| Corvallis, OR |
127 mph |
Mt. Washington, NH |
127 mph |
| Portland, Morrison Bridge, OR |
116 mph |
Washington DC Nat AP, VA |
113 mph |
| Troutdale, OR |
106 mph |
Langley AFB, VA |
111 mph |
| Portland Intl AP, OR |
104 mph |
Annapolis NAF, MD |
100 mph |
| Renton AP, WA |
100 mph |
Willow Grove NAS, PA |
99 mph |
| Bellingham, WA |
98 mph |
Norfolk NAS, VA |
98 mph |
| Astoria, OR |
96 mph |
Richmond Byrd AP, VA |
91 mph |
| Vancouver, WA |
92 mph |
Aberdeen Phillips Field, MD |
89 mph |
| Salem, OR |
90 mph |
Griffiss AFB, NY |
88 mph |
| Tacoma McChord Field, WA |
88 mph |
Cherry Point MCAS, NC |
88 mph |
| Eugene, OR |
86 mph |
Lakehurst, NAS, NJ |
86 mph |
| North Bend, OR |
81 mph |
Fayetteville Pope AFB, NC |
81 mph |
| Everett Paine Field, WA |
81 mph |
Washington DC Bolling, MD |
81 mph |
| Hoquiam, WA |
81 mph |
Atlantic City NAS, NJ |
77 mph |
| Olympia AP, WA |
78 mph |
Dahlgren Weapons Lab, VA |
76 mph |
| Crescent City, CA |
69 mph |
Quantico MCAS, VA |
71 mph |
| Seattle NAS, WA |
66 mph |
Hempstead AFB, NY |
70 mph |
| San Francisco Intl AP, CA |
63 mph |
Weeksville NAF, NC |
67 mph |
| Mt. Shasta, CA |
63 mph |
Portland Intl Jetport, ME |
67 mph |
| Roseburg, OR |
62 mph |
Chicopee Falls Westo, MA |
64 mph |
| Arcata, CA |
58 mph |
Sumpter Shaw AFB, SC |
58 mph |
| Medford, OR |
58 mph |
Brunswick NAS, ME |
51 mph |
| Seattle-Tacoma Intl AP, WA |
58 mph |
Manchester Grenier, NH |
47 mph |
| Yreka, CA |
52 mph |
Boston Logan Intl AP, MA |
41 mph |
| Sources for Table 1, above: For the Columbus Day Storm, sources
include the National Climatic Data Center unedited surface observation
forms and Cimate Visualization Database, the National Weather Service,
Portland and Seattle, and Fitzgerald, Dorothy, "West Coast Disaster,"
1962. All of the peak gusts for Hurricane Hazel come from the National Climatic
Data Center's Climate Visualization Database, and are converted from knots. |
Some Details About the Columbus Day Storm
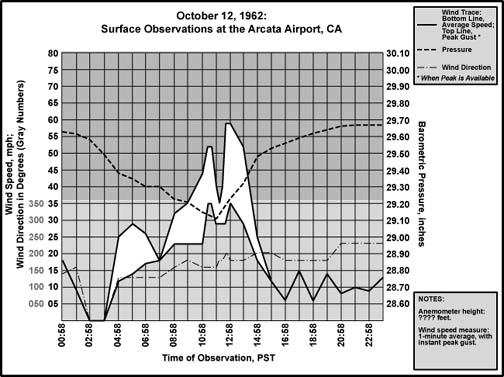
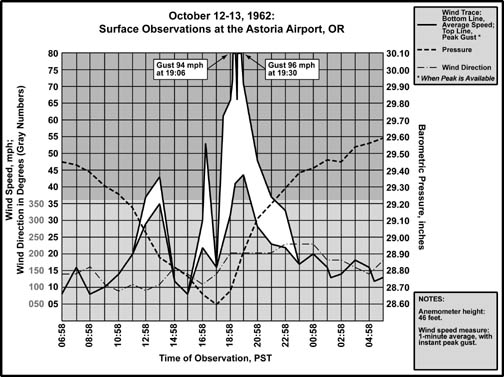
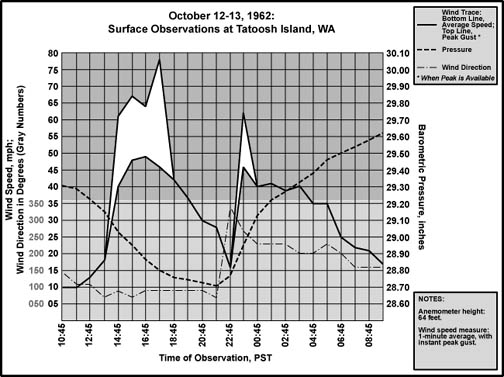
Meteograms
Data for these charts are from microfilm copies of the original unedited
surface observation forms for October 11 and 12, 1962, obtained from the National Climatic Data Center.
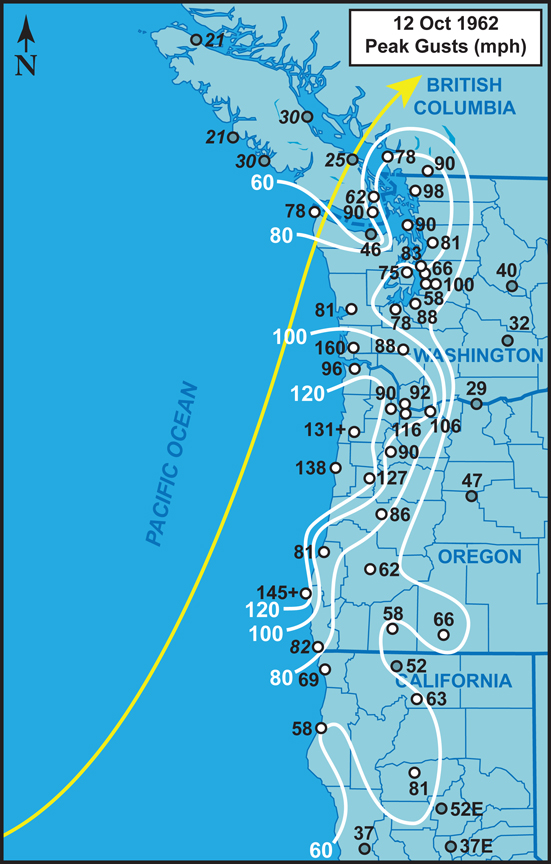
Meteograms, coastal stations, south to north:
These graphics reveal the rapid progress of the storm as it raced northward
just offshore, hammering Arcata with a strong whole gale, throwing incredible
hurricane winds at Astoria, and then weakening as the cyclone's center neared,
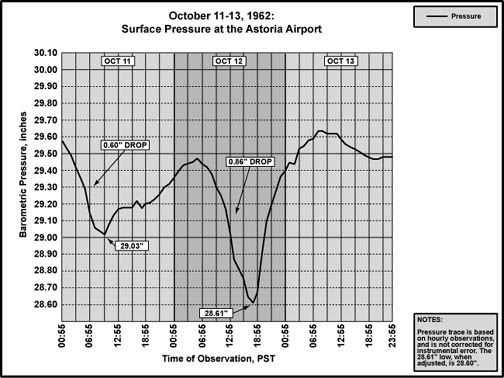
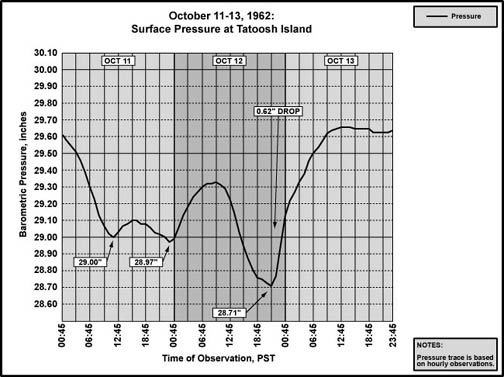
and passed over, Tatoosh Island. |
When comparing Tatoosh Island with Astoria in the above meteograms, note
the strong east winds that picked up ahead of the incoming storm at both
stations. East winds tend to escalate at these two stations, and others,
including Portland, ahead of the big storms, as the pressure gradients tend
to be favorable for airflow from that direction. On Columbus Day 1962, east
gusts at Astoria reached 43 mph during the first spike of winds on the meteogram,
whereas the trace at Tatoosh is much more exxagerated, with gusts as high
as 78 mph. Indeed, the pre-low-center-passage easterly winds at Tatoosh
were much stronger than the westerly winds that picked up after the cyclone's
center passed over the island. This has created some confusion among lists
of peak gusts for the Columbus Day Storm. Some meteorologists from the time
didn't "count" the easterly winds that escalated ahead of the
storm, and listed the peak gust as 62 mph for Tatoosh, which was the westerly
maximum. This is probably because the mechanism for generating the two separate
periods of maximum winds was somewhat different. However, 78 mph speaks
pretty loudly, and, on this web page, I use this value for Tatoosh's peak.
Meteograms, interior stations, south to north:
One day, when I have lots and lots of time, I'll add more to this small
collection. |
|
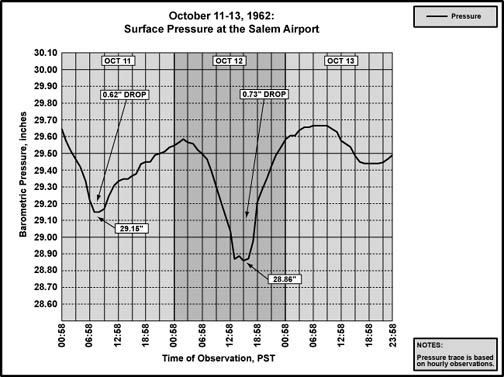
Barograms
Data for these charts are from microfilm copies of the original unedited
surface observation forms for October 11 through 13, 1962, obtained from
the National Climatic Data Center. These charts depict the uncorrected hourly
observations from the surface observation forms, and do not include special
reports that might have indicated pressure minima.
Coastal stations, south to north: |
| Interior stations, south to north: |
Pressure "Spectra"
Coastal station barographic traces compared in absolute time. This graphic
demonstrates the rapid intensification of the storm as it progressed northward
just off the Oregon coast. Peak intensity was achieved before the time the
cyclone had reached the latitude of Astoria, as indicated by a sharp V-trace,
and the lowest pressure of the four stations. Note that North Bend's actual
low pressure was 28.70" at 14:30, which was between the hourly observations.
By the time the low had reached Tatoosh Island, it had weakened and broadened,
making a curve more reminiscent of later storms, like November
1981 and December 1995. Note that the
cyclone's center almost passed right over Tatoosh, while it raced northward
about 50 miles west of Astoria. That the Tatoosh trace doesn't show a sharper
curve than Astoria under these circumstances is a pretty clear sign of a
degrading storm system. |
|
Barograph Charts
These barographs were obtained from the National Climatic Data Center.
Note that these are records of station pressure, not Sea-Level pressure.
Station pressure tends to be lower than pressures adjusted to sea-level,
the magnitude of the difference being related to a stations elevation.
Below is a copy of the actual Columbus Day Storm barograph trace for
Salem, barometer elevation 201.3 feet. The Columbus Day Storm produced the
sharp "V" to the right. This trace also shows the fairly strong
dip of the October 11th storm to the left center. For the Columbus Day Storm,
note the sharply defined double-dip at the bottom of the "V",
a feature was turned up strongly at Willamette Valley stations during this
storm. The initial dip was due to the passage of the storm's leading front.
This kind of double-dip signature has appeared in many windstorms, often
more weakly than the one below. Apparently, double-dips didn't get much
attention until the Columbus Day Storm's clear examples, and this feature
is often remarked upon in scientific literature on the storm of '62. |
| Below is a copy of Eugene's barograph trace, barometer elevation 373 feet.
The magnitude of the storm caused much worry over the barogram. The needle
started flirting with the bottom of the graph around 13:32, forcing a reset,
and the indicator was raised a full 1.00". The needle began to rise
shortly after, and was reset back to its original position at 14:25. However,
the storm's famous double-dip caught the forecasters off-guard, and the
needle dropped below the bottom border of the graph around 15:20. The barometer
was then reset 0.50" at 15:40, and left alone until 19:00, when it
was returned to its original setting. |
General Storm Data
Minimum Pressures and Peak Gradients
Table 2, below, is a list of the lowest barometric pressures,
and time of occurence, produced by the two storms of October 11th and 12th,
1962. It appears that Portland's lowest pressure was achieved during the
first dip in the double-dip signature shown in the storm, and Eugene and
Salem had minimum during the second dip, which accounts for the earlier
arrival of pressure minimum at Portland.
For the period 1950 to present, the 11-station average minimum pressure
for the Columbus Day Storm, 28.84" (976.6 mb), is second only to the
28.69" (971.6 mb) value achieved during the December 12, 1995 storm.
Among the lowest pressures measured during the October 12, 1962 event
was 28.54" (966.5 mb) at Destruction Island, WA, and 28.42" (962.4
mb) from the picket ship MS, off the Northern California coast.
Sources: Microfilm copies of the unedited surface observation forms,
obtained from the National Climatic Data Center. Destruction Island
and picket ship minimum pressures are from Sumner, Howard C, "Pacific
Coast storm, October 11-13, 1962," Preliminary report, Weekly Weather
and Crop Bulletin, National Summary, U.S. Department of Commerce, Weather
Bureau, Vol XLIX, No. 44, October 29, 1962. Some minimums, including Salem,
Sea-Tac and Bellingham, are from Decker, Fred W., Cramer, Owen P., Harper,
Byron P, "The Columbus Day 'Big Blow' in Oregon," Weatherwise,
December 1962. |
| Location |
Lowest
Pressure
Storm # 1 |
Storm # 1
Approx Time
of Lowest Pressure |
Lowest
Pressure
Storm # 2 |
Storm # 2
Approx Time
of Lowest Pressure |
| California: |
|
|
|
|
| Arcata |
29.38" |
08:00 HRS, 11th |
29.11" |
12:00 HRS, 12th |
| Oregon: |
|
|
|
|
| North Bend |
29.11" |
06:00 HRS, 11th |
28.70" |
14:30 HRS, 12th |
| Astoria |
29.03" |
10:00 HRS, 11th |
28.62" |
18:00 HRS, 12th |
| Medford |
29.33" |
07:00 HRS, 11th |
29.03" |
13:00 HRS, 12th |
| Eugene |
29.15" |
08:00 HRS, 11th |
28.86" |
16:00 HRS, 12th |
| Salem [1] |
29.15" |
08:00 HRS, 11th |
28.80" |
16:20 HRS, 12th |
| Portland |
29.15" |
10:00 HRS, 11th |
28.84" |
15:13 HRS, 12th |
| Washington: |
|
|
|
|
| Quillayute [2] |
29.00" |
12:00 HRS, 11th |
28.71" |
22:00 HRS, 12th |
| Olympia |
29.17" |
11:00 HRS, 11th |
28.83" |
19:05 HRS, 12th |
| Seattle (Sea-Tac) |
29.16" |
11:00 HRS, 11th |
28.88" |
19:00 HRS, 12th |
| Bellingham |
29.23" |
12:00 HRS, 11th |
28.90" |
22:00 HRS, 12th |
| |
|
|
|
|
| AVERAGE |
29.17" |
|
28.84" |
|
|
Table 2 Notes:
[1] Among the hourly sea-level pressure notations at Salem, the lowest
reading was 28.86". Sea-level pressure was not indicated in the special
reports between the hourly observations. However, altimeter was noted in
the special reports. In the case of Salem, the lowest altimeter pressure
indicated was 28.79" at 16:20 HRS. Salem's lowest pressure has been
stated as 28.80" in a number of publications.
[2] No pressure data for Quillayute, WA, for the 1962 time period. The
readings are for Tatoosh Island. |
Table 3, below, is a list of the maximum hourly pressure
gradients, and time of occurrence, for the two storms. The passage of an
upper-level trough behind the October 11th storm caused short-lived barometric
drops for stations in the north part of the region. Pressure gradients tightened
again during the night--in some cases more strongly than during the passage
of the Oct 11th cyclone--and wind speeds elevated to gale force in places
like Astoria and Tatoosh Island. Thus, the region strongly affected by this
upper-level trough experienced three separate gale-wind events in the span
of about 30 hours from October 11th to 12th.
Of the gradient measures for the Columbus Day Storm, the ACV-OTH, OTH-AST,
MFR-EUG and AST-DLS readings are the highest in the 1950-to-present record.
The December 12, 1995 windstorm holds the record for steepest ACV-AST with
+33.9 mb (+1.00"), the October 21, 1934 storm holds the records for
OTH-TTI with +33.2 mb (+0.98") and SEA-BLI with +11.5 mb (+0.34"),
the Otober 2, 1967 storm holds the record for EUG-PDX with +13.7 mb (+0.40"),
and the January 20, 1993 "Inaguration Day Storm" holds the record
for PDX-SEA with a whopping +15.4 mb (+0.45"). The +17.0 mb (+0.50")
reading for the MFR-EUG measure during the Columbus Day Storm is nothing
short of phenomenal--the next two highest events for this measure were +14.8
mb (+0.44") on October 2, 1967 and +13.3 mb (+0.39") on December
4, 1951.
Source: Microfilm copies of the unedited surface observation forms, obtained
from the National Climatic Data Center. |
| Location |
Max Gradient, mb
Storm # 1 |
Approx Time
of Max Gradient
Storm # 1 |
Max Gradient, mb
Storm # 2 |
Approx Time
of Max Gradient
Storm # 2 |
| Coast: |
|
|
|
|
| ACV-OTH |
10.3 |
06:00 HRS, 11th |
24.0 |
15:00 HRS, 12th |
| OTH-AST |
8.5 |
11:00 HRS, 11th |
23.9 |
18:00 HRS, 12th |
| AST-TTI [1] |
5.1 |
13:00 HRS, 11th |
17.7 |
23:00 HRS, 12th |
| ACV-AST |
16.3 |
10:00 HRS, 11th |
33.0 |
18:00 HRS, 12th |
| OTH-TTI |
12.4 |
12:00 HRS, 11th |
27.3 |
22:00 HRS, 12th |
| Interior: |
|
|
|
|
| MFR-EUG |
10.8 |
15:00 HRS, 11th |
17.0 |
16:00 HRS, 12th |
| EUG-PDX |
3.7 |
10:00 HRS, 11th |
9.6 |
18:00 HRS, 12th |
| PDX-SEA |
3.7 |
14:00 HRS, 11th |
9.9 |
20:00 HRS, 12th |
| SEA-BLI |
2.4 |
19:00 HRS, 11th |
9.2 |
00:00 HRS, 13th |
| AST-DLS |
-13.8 |
08:00 HRS, 11th |
-17.5 |
18:00 HRS, 12th |
|
Table 3 Notes:
[1] No pressure data for Quillayute, WA, for the 1962 time period. Tatoosh
Island was the primary station in Northwest Washington before 1964. |
Pressure Tendencies
Table 4, below, lists the maximum hourly pressure falls
and rises achieved during the Columbus Day Storm for 11 Pacific Northwest
stations. These tendencies are phenomenal, the mark of a truly unique storm.
The 11-station average peak declension of -4.6 mb (-0.14") per hour
is the highest in the 1950-to-present era. Only the windstorms of December
21, 1955 with -4.1 mb (-0.12") and December 4, 1951 with -4.4 mb (-0.13")
have come close to the extreme Columbus Day Storm value. The story is the
same for average pressure rise. The Columbus Day Storm's average value of
+6.2 mb (+0.18") is in a class by itself, with the runners-up being
the Thanksgiving Day storm of 1983 with +4.4 mb (+0.13"), the powerful
cyclone of December 12, 1995 with +4.5 mb (+0.133") and the windstorm
of February 24, 1958 with +5.2 mb (+0.15") for eight of these stations
(TTI, EUG and PDX missing pressure data during the February 24, 1958 storm).
Interestingly, despite the high average tendencies, when individual stations
are examined, very few long-standing records were set on Columbus Day 1962.
Only the peak climb values for Medford, Eugene, Salem and Bellingham still
stand as records today, and Eugene only because the pressure surge from
the February 7, 2002 South Valley Surprise
started between the regular observation times, resulting in a +7.5 mb (+0.21")
peak reading on the hour (16:54), when indeed a +10.2 mb (+0.30") rise
occurred in about 48 minutes (from 16:24 to 17:12).
The high average hourly declension for the Columbus Day Storm is no different.
Still-standing records were set at just Astoria and Salem during the Columbus
Day Storm. The storms that produced the higher readings for both pressure
fall and climb at the other stations are quite varied. Often the record
setter is a cyclone that passed very close to a particular station, and
because of this nature, it is almost always a different storm for each station's
record. The list is long and convoluted. For example, there's North Bend.
The +8.8 mb (+0.26") surge on Columbus Day of 1962 was incredible--rarely
do one-hour pressure rises reach into the eight-mb range in the Pacific
Northwest--but it is far short of the truly astounding one-hour surge of
+16.6 mb (+0.49") during a landfalling cyclone on November 10, 1975 and +14.2
mb
(+0.42") also
during
another landfalling storm on
February
7, 2002. The 1975 and 2002 storms were very localized to Southwest Oregon. For
example, on february 7, 2002, Astoria,
at
the north end of the state, had a meager +2.4 mb (+0.07") maximum climb
out of the event, far short of the +7.7 mb (+0.23") surge seen on Columbus
Day 1962, and Astoria's all-time biggest hourly jump of +8.0 mb (+0.24")
during the Inauguration Day storm of 1993.
That the Columbus Day Storm set the all-time maximum average pressure
tendencies for the 1950-to-present era while not setting most individual
station records, reflects on an event that strongly affected the entire
region quite uniformly, unlike many of the individual station record-setters.
Source: Pressure data is from the National Climatic Data Center,
unedited surface observation forms. |
Maximum Pressure Tendencies for the 1962 Columbus Day
Storm |
| Location |
Max
Hrly
Fall
mb |
Time of
Max Fall
PST |
Max
Hrly
Rise
mb |
Time of
Max Rise
PST |
| California: |
|
|
|
|
| Arcata |
-3.7 |
05:00 HRS, 12th |
+5.4 |
15:00 HRS, 12th |
| Oregon: |
|
|
|
|
| North Bend |
-5.0 |
12:00 HRS, 12th |
+8.8 |
17:00 HRS, 12th |
| Astoria |
-5.1 |
13:00 HRS, 12th |
+7.7 |
20:00 HRS, 12th |
| Medford |
-3.5 |
12:00 HRS, 12th |
+5.8 |
15:00 HRS, 12th |
| Eugene |
-5.0 |
13:00 HRS, 12th |
+7.6 |
18:00 HRS, 12th |
| Salem |
-5.5 |
14:00 HRS, 12th |
+7.6 |
19:00 HRS, 12th |
| Portland |
-4.4 |
14:00 HRS, 12th |
+5.5 |
20:00 HRS, 12th |
| Washington: |
|
|
|
|
| Tatoosh Island |
-4.0 |
15:00 HRS, 13th |
+6.2 |
00:00 HRS, 13th |
| Olympia |
-5.4 |
15:00 HRS, 12th |
+4.3 |
23:00 HRS, 12th |
| Seattle |
-4.6 |
15:00 HRS, 12th |
+3.9 |
01:00 HRS, 13th |
| Bellingham |
-4.1 |
16:00 HRS, 12th |
+5.8 |
02:00 HRS, 13th |
| |
|
|
|
|
| AVERAGE |
-4.6 |
|
+6.2 |
|
|
Peak Wind and Gust
Table 5, below, details the peak winds for the Columbus
Day Storm at eleven key weather stations in the Pacific Northwest. "Peak
Wind" is the highest observed 1-minute average, and "Peak Gust"
is highest instantaneous speed (sometimes referred to a peak 1-second gust).
Power outages afflicted Astoria, Salem, Portland and Olympia as the storm
built in intensity at the respective sites, which resulted in either estimated,
or low readings.
An 11-station average peak wind of almost 50 mph with an average peak
gust of just above 80 mph puts this storm far above any other since
1950. Many windstorms struggle for an average peak gust that is the
equivalent to the Columbus Day Storm's averge peak wind! The next
closest storm was the November 14, 1981 event, which produced an average
peak gust of 65.9 mph, fully 14 points below the tempest of 1962.
Another way of looking at this is that for the Willamette Valley, the lowest official
peak gust was the 86 mph burst that hit Eugene. This "low" reading of 86 mph
is higher than the highest official peak gust for any other Willamette Valley
storm 1948-2003!
Source: All these readings are from the National Climatic Data Center,
microfilm copies of the unedited surface observation forms. |
| Location |
Peak
Wind
mph |
Direction
Pk Wnd
16ths |
Obs Time of
Peak Wind
PST |
Peak
Gust
mph |
Direction
Pk Gst
16ths |
Obs Time of
Peak Gust
PST |
| California: |
|
|
|
|
|
|
| Arcata |
35 |
S |
12:58 HRS, 12th |
58 |
S |
12:58 HRS, 12th |
| Oregon: |
|
|
|
|
|
|
| North Bend |
35 |
SSW |
15:40 HRS, 12th |
81 |
S |
14:58 HRS, 12th |
| Astoria [1] |
44 |
SSW |
19:58 HRS, 12th |
96 |
SSW |
19:30 HRS, 12th |
| Medford |
40 |
SSW |
14:40 HRS, 12th |
58 |
SSW |
14:40 HRS, 12th |
| Eugene |
63 |
S |
15:56 HRS, 12th |
86 |
S |
15:56 HRS, 12th |
| Salem |
58 |
S |
17:58 HRS, 12th |
90 |
S |
17:58 HRS, 12th |
| Portland [2] |
63 |
SSW |
18:57 HRS, 12th |
104 |
SSW |
18:55 HRS, 12th |
| Washington: |
|
|
|
|
|
|
| Tatoosh I. |
49 |
E |
16:52 HRS, 12th |
78 |
E |
17:49 HRS, 12th |
| Olympia |
58 |
SW |
19:20 HRS, 12th |
78 |
SW |
19:20 HRS, 12th |
| Sea-Tac |
44 |
SSW |
23:31 HRS, 12th |
58 |
S |
20:57 HRS, 12th |
| Bellingham |
58 |
SSE |
23:58 HRS, 12th |
98 |
SSE |
23:58 HRS, 12th |
| |
|
|
|
|
|
|
| AVERAGE |
49.7 |
S |
|
80.5 |
S |
|
Table 5 Notes:
[1] Power outage at 18:08 resulted in estimated wind direction after
this time.
[2] Values for Portland are officially estimated readings. Peak SSW winds
reached 46 mph gusting to 72 at 17:32--the last instrument reading before
a power failure at 17:46 stopped the instruments. A fastest mile taken up
to 17:46 yielded 88 mph, the highest value for this wind measure ever recorded
at Portland. The estimated peak gust of 90 knots (104 mph) falls closely
in line with the peak of 106 mph reported at the nearby Troutdale Airport.
Had there been no wind estimations at the Portland Airport, the readings
from Troutdale would have been the substitutes. The peak winds of 69 mph
and already mentioned triple-digit gust wouldn't have changed the storm's
11-station averages significantly. |
Table 6, below, lists peak wind values for additional stations
throughout the Pacific Northwest and Northern California. "Peak Wind"
is the highest observed 1-minute average, and "Peak Gust" is highest
instantaneous speed (sometimes referred to a peak 1-second gust), with some
exceptions: The Oak Harbor NAS average reading is for a 1-hour period, with
peak instant gust. Power was lost during the height of the storm at some
of these stations, including Red Bluff, Sexton Summit, Roseburg, and Paine
Field. This could have resulted in missed wind readings, which suggests
the possibility that the values in the record weren't the maximum velocities
during the storm.
Source: All these readings are from the National Climatic Data Center,
microfilm copies of the unedited surface observation forms, with the following
exceptions: Renton, WA, the U.S. Navy Sea Plane Base on Whidbey Island (listed
as Oak Harbor), and Stampede Pass are from "Columbus Day Storm in Washington,"
report prepared at the Weather Bureau State Climatologist Office by Earl
L. Phillips, and the Klamath Falls data is from "West Coast Disaster,"
by Dorothy Franklin, 1963. |
| Location |
Peak
Wind
mph |
Direction
Pk Wnd
16ths |
Obs Time of
Peak Wind
PST |
Peak
Gust
mph |
Direction
Pk Gst
16ths |
Obs Time of
Peak Gust
PST |
| California: |
|
|
|
|
|
|
| San Francisco |
43 |
S |
16:54 HRS, 12th |
63 |
S |
-- HRS, 12th |
| San Jose |
25 |
SE |
17:50 HRS, 12th |
35 |
SE |
17:50 HRS, 12th |
| Hayward |
35 |
SSE |
18:00 HRS, 12th |
48 |
SSE |
18:00 HRS, 12th |
| Oakland |
35 |
SSE |
17:19 HRS, 12th |
40 |
SSE |
16:58 HRS, 12th |
| Alameda NAS |
36 |
W |
17:58 HRS, 12th |
46 |
W |
17:38 HRS, 12th |
| Sacramento |
42 |
SW |
18:22 HRS, 12th |
66 |
SW |
18:22 HRS, 12th |
| Santa Rosa |
40 |
S |
15:09 HRS, 12th |
63 |
S |
15:09 HRS. 12th |
| Ukiah |
29 |
SSE |
12:58 HRS, 12th |
37 |
SSE |
12:58 HRS, 12th |
| Stockton [1] |
23 |
SSE |
18:58 HRS, 12th |
35 |
SSE |
18:58 HRS, 12th |
| Modesto |
30 |
ESE |
16:00 HRS, 12th |
44 |
ESE |
16:00 HRS, 12th |
| Sacramento |
42 |
SW |
18:22 HRS, 12th |
66 |
SW |
18:22 HRS, 12th |
| Red Bluff |
54 |
SSE |
12:58 HRS, 12th |
71 |
SSE |
12:58 HRS, 12th |
| Redding [2] |
58 |
SSE |
15:00 HRS, 12th |
81 |
SSE |
15:00 HRS, 12th |
| Oregon: |
|
|
|
|
|
|
| Sexton Summit |
56 |
S |
13:35 HRS, 12th |
MM |
MM |
MM |
| Roseburg |
34 |
S |
15:58 HRS, 12th |
62 |
S |
15:58 HRS, 12th |
| Corvallis |
69 |
SSE |
16:00 HRS, 12th |
127 |
SSE |
16:00 HRS, 12th |
| Troutdale |
69 |
SSW |
19:07 HRS, 12th |
106 |
SSW |
19:10 HRS, 12th |
| Klamath Falls |
-- |
-- |
-- |
65 |
-- |
16:00 HRS, 12th |
| Redmond |
46 |
SSW |
16:37 HRS, 12th |
60 |
SSW |
16:37 HRS, 12th |
| The Dalles |
17 |
SW |
19:58 HRS, 12th |
29 |
SW |
19:58 HRS, 12th |
| Pendleton |
41 |
WSW |
19:34 HRS, 12th |
53 |
WSW |
19:34 HRS, 12th |
| Washington: |
|
|
|
|
|
|
| Hoquiam |
48 |
S |
20:58 HRS, 12th |
81 |
S |
20:20 HRS, 12th |
| Toledo |
58 |
S |
18:58 HRS, 12th |
89 |
S |
18:58 HRS, 12th |
| Tacoma, McChord |
52 |
S |
20:25 HRS, 12th |
87 |
S |
20:25 HRS, 12th |
| Renton [3] |
46 |
SSE |
21:57 HRS, 12th |
100 |
SSE |
20:00 HRS, 12th |
| Boeing Field |
44 |
SSE |
19:58 HRS, 12th |
66 |
SSE |
19:47 HRS, 12th |
| Seattle NAS |
40 |
S |
20:55 HRS, 12th |
66 |
S |
20:19 HRS, 12th |
| Everett, Paine |
52 |
SE |
22:06 HRS, 12th |
81 |
SE |
22:06 HRS, 12th |
| Oak Harbor |
46 |
SE |
22:00 HRS, 12th |
90 |
SE |
22:00 HRS, 12th |
| Navy Whidbey |
41 |
SSE |
21:55 HRS, 12th |
67 |
SSE |
22:15 HRS, 12th |
| Stampede Pass |
31 |
E |
15:58 HRS, 12th |
47 |
E |
15:58 HRS, 12th |
| Yakima |
21 |
SSW |
00:58 HRS, 13th |
32 |
SSW |
00:58 HRS, 13th |
| Wenatchee |
29 |
SE |
23:58 HRS, 12th |
40 |
SE |
00:58 HRS, 13th |
| Moses Lake |
39 |
S |
23:25 HRS, 12th |
66 |
S |
22:25 HRS, 12th |
Table 6 Notes:
[1] Last of several occurrences for both peak wind and gust.
[2] The gusts noted at Redding are designated as estimated readings.
[3] Last of several occurrences for peak wind (not gust). |
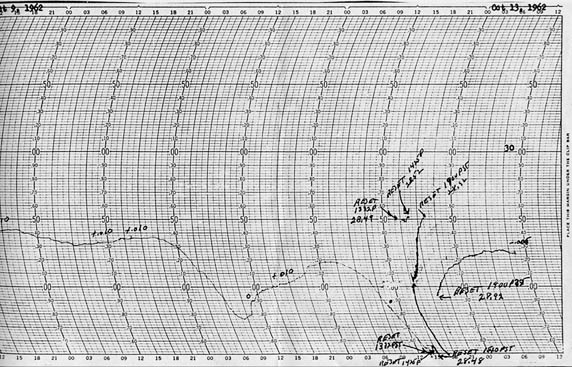
A Vast Trail of Destruction
Shown below is a copy of the original surface observation form for Corvallis,
OR, used for the time period October 10th to October 15th. Weather observations
were fairly routine up to 14:00 on October 12th. Then the 15:00 observation
was missed, and what followed is quite extraordinary. Winds at 16:00 had
elevated to 60 knots gusting to 85 (69 mph gusting to 98), with a peak gust
noted at 110 knots (127 mph)! Just a few moments later, at 16:15, "ABANDONED
STATION" is clearly written in the middle of the form. The next day,
it is also noted, "Unreported from 04:00 - 12:00 due power failure
and instruments demolished." This is the only time in the history of
the Pacific Northwest that an officially supervised weather station had
to be abandoned due to high winds. A strong reminder of just how powerful
the Columbus Day Storm was. |

|
Photos Courtesy of the Oregon Climate Service
Much thanks to George Taylor for sending the following Columbus Day Storm
pictures to me.
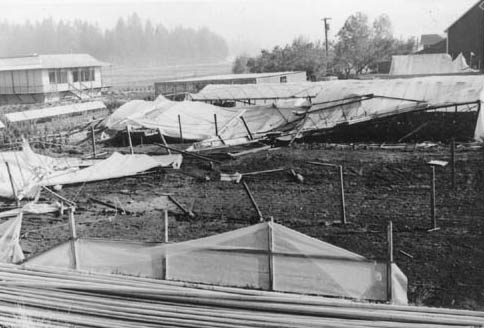
Photo 1, below: North Willamette Experiemental Station. |
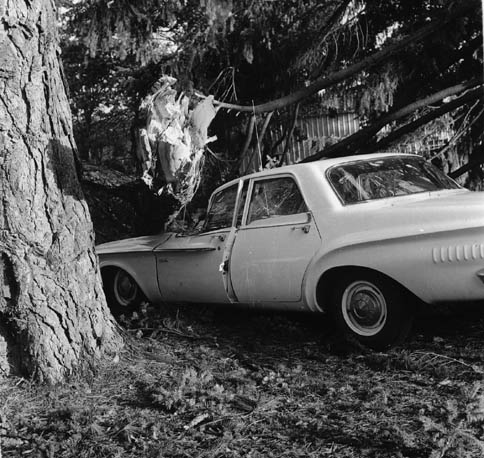
| Photo 2, below: Smashed Dodge Dart, Oregon State University
campus. |
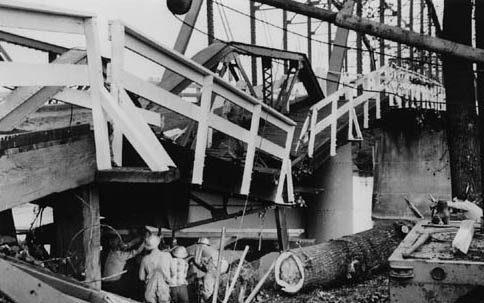
| Photo 3, below: Van Buren Bridge, Corvallis. |
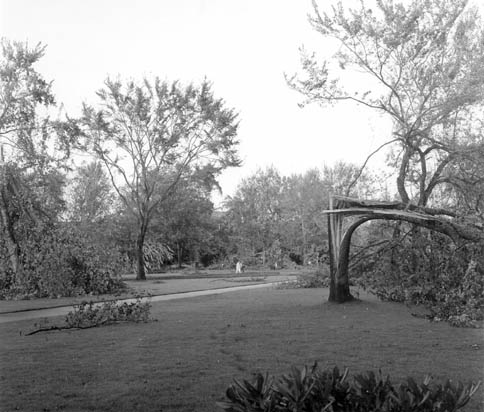
| Photo 4, below: Oregon State University campus, Corvallis. |
Like a Hurricane
Many eyewitness accounts suggested that the
Columbus Day Storm was like a hurricane. These comments were sometimes
made by people who had experienced hurricanes beforehand. Here's a
piece of weather data that just about corroborates these claims, from
Red Bluff, California: Rainfall 0.41" in 5 minutes, accumulating to
0.98" within 15 minutes, with peak average wind 68 mph (fastest mile),
gusts higher,
and a temperature around 64 F. The temperature is slightly cool for
a hurricane, and the average winds weren't quite at the 75 mph cutoff
for hurricane
status (plus the highest winds occurred before the heavy rain event),
but the figures aren't too far off the mark, especially with rainfall
rates
at 8.20"/hr
for
that
first
5-minute
period. A person
witnessing the conditions generated by the Columbus Day Storm would
have compelling evidence to make the claim "Like a hurricane." |
Annotated Bibliography
For those wishing to find out more about the mother of all Pacific Northwest
windstorms, here's a list of known articles and books on the Columbus Day
Storm, many of which were used as references for this web page:
Books
1) Franklin, Dorothy. "West Coast Disaster." Gann Publishing
Co. 1963? 180 pages. Many photos. Includes some technical discussion by
Jack Capell, KGW-TV Meteorologist, and maps from a Bonneville Power Administration
study by Byron P. Harper (see articles, below). This is a very accessable
account of the storm's progress through California, Oregon, Washington and
British Columbia.
2) Lucia, Ellis. "The Big Blow." News-Times Publishing Co.
1963. 64 pages. Photos. A nicely written summary of the major disaster,
especially as it affected Oregon.
3) Taylor, George, Hatton, Raymond R. "The Oregon Weather Book:
A State of Extremes." Oregon State University. 1999. Aside from covering
the broad and complex topic of Oregon climate, the book also includes a
summary of the state's high wind events, and takes a look at the Columbus
Day Storm.
Articles
1) Coparanis, John D. "Meteorological bombs as they affect Oregon." National Weather Service, Portland, document. January 1985. This
insightful examination of the forecasting aspects of powerful cyclones includes
study of the Columbus Day Storm. 21 pages with at least 17 pages of supplimental
material. Good tables, charts, and some satellite photos of other storms
(not the Columbus Day event).
2) Decker, Fred W., Cramer, Owen P., Harper, Byron P. "The Columbus
Day 'Big Blow' in Oregon." Weatherwise. December 1962. Pages
238-245. An excellent summary of the storm.
3) Harper, Byron P. "Report on October 12 wind storm." Bonneville
Power Administration Power Operations Branch, Forecasting Unit. October
31, 1962. Six pages, plus five with supplimental information.
4) Lynott, Robert E., Cramer Owen P. "Detailed analysis of the 1962
Columbus Day windstorm in Oregon and Washington." Monthly Weather
Review. February 1966. Pages 105-117. This is as advertised--a very
detailed and technical examination of the storm. Includes upper air analysis
as well as extensive surface analysis.
5) Phillips, Earl L. "Columbus Day Storm in Washington October 12,
1962." Weather Bureau State Climatologist Office. No completion date
given. Seven pages. Has tables listing the hourly observations at many stations.
6) Sumner, Howard C. "Pacific Coast storm, October 11-13, 1962."
Preliminary report. Weekly Weather and Crop Bulletin, National Summary.
U.S. Department of Commerce, Weather Bureau. Vol XLIX, No. 44. October 29,
1962. Two pages. Quick summary of the storm events. Has a summary table
of minimum pressures and peak winds.
Online Publications
1) Clements, Kathleen C. "Columbus
Day Storm: 'Worst Disaster Ever' October 12, 1962." Salem History
Project by the Oregon State Library. No air date given, found January 2003.
Nice summary of events in Salem. Includes some photographs.
2) Willson, Dave, Kosovitz, Ira. "Columbus
Day 1962 Storm." Provided by the National Weather Service, Portland.
Aired in October 2002. Includes links to many storm damage photos and records
of the KGW radio broadcasts from Portland during the storm. |
Figure Archives
 |
|