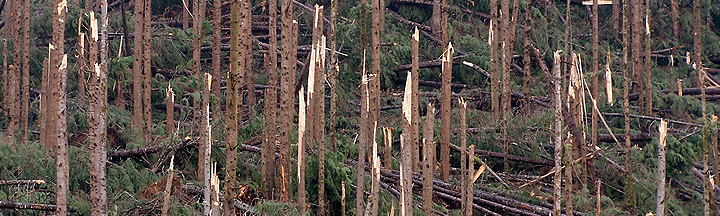
The Storm King

The Climatology and Meteorology of Windstorms That Affect the Cascadia Region of North America, Including the US. Pacific Northwest And Southwest British Columbia, Canada

(Was: Some Historical Weather Events in the Pacific Northwest)

compiled by

Wolf Read, PhD
Contact information is in the graphic at the bottom of the page

My doctoral dissertation: "The Climatology and Meteorology of Windstorms That Affect Southwest British Columbia, Canada, and Associated Tree-Related Damage to the (BC Hydro) Power Grid". This study is also relevant to Western Washington interests and less so Western Oregon, and is available from the UBC Library cIRcle Repository (the 71 MB file may take a little while to download).

My presentations: Here is a list of links to many of my windstorm-related talks. These presentations include windstorm case studies, windstorm climatology, wind-tree interactions, wind damage to the power grid, the examination of the Pacific Decadal Oscillation and a possible link with windstorm frequency and more.

Disclaimer: This is a personal website; therefore the opinions expressed herein are my own. Please do not assume that these opinions are those of the Office of the Washington State Climatologist (OWSC) or the Oregon Climate Service (OCS). Part of this research was kindly funded by the OCS. Many thanks go to the OWSC and the OCS for hosting these webpages.


Left: March 20, 1995, 15:00 ZULU. This intense extratropical cyclone compelled forecasters at the National Weather Service, Portland, to post this warning at 22:00 PST March 19, 1995:

" ..HIGH WIND WARNING FOR THE COAST TONIGHT AND MONDAY...

"HIGH WIND WARNING IS NOW IN EFFECT FOR THE OREGON COAST. WINDS ALONG THE COAST WILL INCREASE TONIGHT AND BECOME 35 TO 45 MPH WITH GUSTS TO 75 MPH IN THE NORTH AND NEAR 90 MPH IN THE SOUTH AHEAD OF THE COLD FRONT. WINDS HAVE ALREADY GUSTED TO 40 MPH AT SEA LION CAVES...59 MPH AT GOLD BEACH...AND 94 MPH AT CAPE BLANCO."


The 
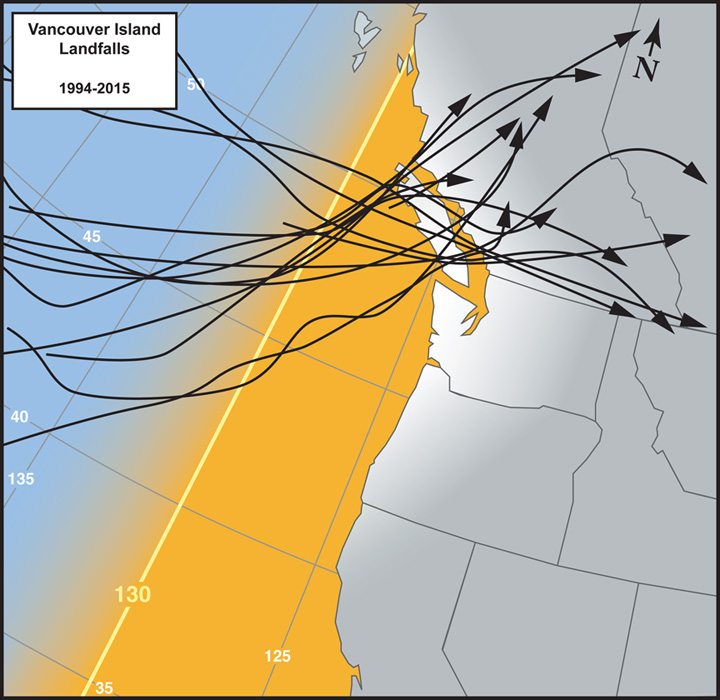
above storm is a very potent form of extratropical (or midlatitude) cyclone, also known as ETCs. Many have struck the West Coast within the relatively short period of meteorological record. These systems can match a Category 3 hurricane in both minimum central pressures and sustained wind speeds. Such storms have a reach far beyond that of a typical hurricane: they can throw a cold rain into the Alaska Panhandle while at the same time pummel the San Francisco Bay Area with a warm, saturated gale. These tempests can threaten human life, and can cause damage into the hundreds of millions, even billions.

In part, this website was put in place to dispel the idea that severe weather somehow does not strike the Pacific Northwest, which appears to largely be a misconception among some weather interests east of the Rockies.

For example, the March 12-13, 1993 "Storm of the Century" has been touted as the strongest extratropical storm to strike the United States in the 20th century. This appears wrong on a number of counts. The Storm Data publication of the National Climatic Data Center for the March 1993 event is particularly revealing in this regard.

A strong argument could be made that the great Columbus Day Storm of 1962 holds the "Storm of the Century" title, and for good reason. Sure, the 1993 storm produced more lowland snow; the Columbus Day Storm was a relatively warm early-Autumn system and snow just did not happen, save perhaps at the highest elevations. However, wind speeds are a different matter. Wind generally causes more damage than snow. Sure, when snow gets deep enough, it can become a problem for traffic flow and, perhaps more importantly, tree and roof integrity. However, for much of the region that saw snow during the 1993 event, accumulation just did not reach epic proportions, with 6-10" common.

Of the storms on record, only eastern hurricanes, possibly some wake low events, and some thundergusts match the strength of winds reported during the Columbus Day Storm (tornadoes notwithstanding). The supposed "Storm of the Century" just does not come close to the peak gusts officially recorded during the Columbus Day Storm. Generally, for March 1993 the peaks were in the range of 50 to 70 mph, with scattered readings around 75 to 85 mph. Most of the latter readings happened at coastal stations. For the Columbus Day Storm, official wind gusts reached 127 mph in the Willamette Valley. Many stations had gusts between 75 and 100 mph, and this includes quite a few locations that were inland (including Corvallis). So much for the storm of 1993!

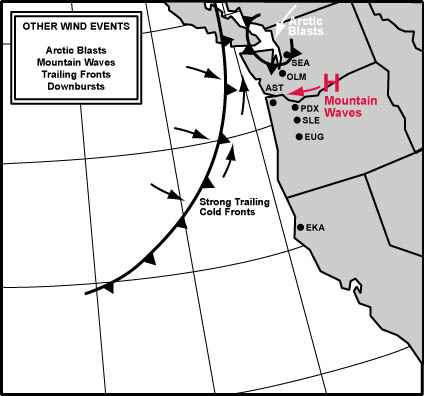
One of the main foci of the case studies below is to demonstrate severe weather events in the Pacific Northwest. In addition, this research is intended to develop a comprehensive climatology of windstorms that affect the Cascadia region. Much attention is given to extratropical cyclones, since severe weather is typically associated with these weather systems. Given that the atmosphere is capable of varied and diverse phenomena, other types of events are also examined.


Updates as of November 2016

1) Added further information on pressure wind triangles and absolute (2-D) pressure gradients.

2) Material on the December 21, 2015 "Storm King" event is now being added to the site.

2) An examination of the "Ides of October", or October 15, 2016, classic-path windstorm has been posted. The main focus of the analysis is on the relatively low peak near-surface wind response that occurred despite the storm bringing many of the required ingredients for high winds.

3) I have added a page with links to PDF files for many of my windstorm-related talks. These presentations include windstorm case studies, windstorm climatology, wind-tree interactions, wind damage to the power grid, the examination of the Pacific Decadal Oscillation and a possible link with windstorm frequency and more.

Previous updates:

1) A preliminary page on the August 29, 2015 summer windstorm has been put up. This is just a seed page, one that includes a link to a paper I had published on this unusual windstorm.


I gradually add new information whenever I have the time. Just click on the links below to see official data, my own records and anecdotes, photos, and more, though each account may not have everything.


Subjects in Chronological Order Last Updated
The Storm King: The "Great Gale" of January 9, 1880 January 13, 2004
The Classic Windstorm of December 10, 1906 November 29, 2007
The January 29, 1921 Olympic Blowdown December 30, 2007
The Major Windstorm of October 21, 1934 November 30, 2015
A Classic Windstorm on December 21, 1940 November 29, 2007
The Intense Spring Gale of April 23, 1943 April 30, 2004
The Major Classic Windstorm of December 4, 1945 April 16, 2004
The Double Windstorms of October 26-27, 1950 May 30, 2003
The Major Windstorm of December 4, 1951 March 10, 2004
The Classic Windstorm of April 14, 1957 April 1, 2004
The Intense Cyclone of November 3, 1958 February 5, 2008
The SW OR Windstorm of February 24, 1961 May 30, 2003
The Mid-Spring Gale of April 27, 1962 December 2, 2003
The Columbus Day Storm ("Typhoon Freda") of 1962 October 30, 2015
The Spring Gale of March 27, 1963: Storm King I July 30, 2004
The February 5, 1965 Gale: Storm King II July 30, 2004
The Strong October 2, 1967 Gale: Storm King III November 13, 2003
The Strong Classic Windstorm of March 26, 1971 March 2, 2003
The Sudden Windstorm of March 1, 1974 February 25, 2003
The Intense Cyclone of November 9-10, 1975 March 25, 2004
The December 15, 1977 Puget Sound Cyclone February 26, 2004
The Kitsap Blowdown of February 13, 1979 February 20, 2004
The Double Windstorms of November 13-15, 1981 July 9, 2004
The Gale of December 21, 1982 September 6, 2004
The Thanksgiving Day Storm of 1983 May 8, 2003
The Surprise Gale of March 16, 1984 February 26, 2003
The Storm Train of January 1986 February 26, 2003
Down the Atmospheric River: A Stormy Trio on January 6-9, 1990 February 6, 2008
The Northerly Gale of December 1990 February 16, 2006
The Inauguration Day Storm of 1993 March 5, 2003
The November 15, 1994 South Valley Windstorm May 8, 2003
The Major Windstorm of December 12, 1995 March 1, 2003
The Windstorm of February 6, 1999 March 2, 2003
The Major Windstorm of March 2-3, 1999 February 4, 2006
The Classic Windstorm of Janaury 15-16, 2000 November 9, 2015
The NW OR Squall Line of December 13, 2001 March 5, 2003
The February 7, 2002 South Valley Surprise December 5, 2008
The Storms of December 14-16, 2002 March 5, 2003
The December 16, 2002 South Valley Storm March 9, 2003
The December 27, 2002 Minor Windstorm March 19, 2004
The January 1, 2004 Cyclone: Snowstorm October 20, 2015
The January 29-30, 2004 Minor Windstorm March 19, 2004
The November 5, 2005 SW Washington Gale December 4, 2005
The Christmas Day Gale of 2005 February 18, 2006
The New Year's Windstorm of 2006 February 19, 2006
The February 4, 2006 Windstorm February 23, 2006
A Windstorm and Atmospheric River on November 15, 2006 See my dissertation
The Southeaster of December 11, 2006 See my dissertation
The Major Hanukkah Eve Windstorm of December 14-15, 2006 October 30, 2015
Early Autumn Bluster: October 18, 2007 November 16, 2007
The Powerful Windstorm of November 12, 2007 See my dissertation
The Great Coastal Gale of December 1-3, 2007 November 23, 2008
The Easter Weekend Windstorm, April 2, 2010 See my dissertation
The Intense Windstorm of March 12, 2012 See my dissertation
The Semi-Classical Windstorm of October 25, 2014 On the back-furnace
The December 11, 2014 Classical Windstorm December 11, 2015
A Rare Summer Windstorm on August 29, 2015 September 18, 2016
An Unusual Windstorm on November 17, 2015 On the crafting table
The December 21, 2015 "Storm King" Event November 25, 2016
The Queen Charlotte Sound Low of March 10, 2016 October 18, 2016
The Olympic Peninsula Extratropical Cyclone of March 13, 2016 October 29, 2016
The "Ides of October" 2016 Classical Windstorm and Forecast Bust November 27, 2016
   
Background Material  
Station List and Rationale for the Peak Gust Maps April 12, 2016
   
Windstorm Barometric Pressure  
Pressure-Wind Triangles and 2D Pressure Gradients November 28, 2016
Could the Columbus Day Storm Winds Be Surpassed? December 16, 2015
Pressure Gradients, Storm Tracks, Wind Speed March 1, 2003
Some Barograph Traces March 1, 2003
   
Windstorm Rankings (The Important Stuff!)  
Pacific Northwest Strongest Storms 1950-2004 September 9, 2004
Adjustments to "Modern" Storms 1995-2006 November 29, 2008
Willamette Valley Strongest Storms 1950-2002 February 28, 2003
Seattle's Strongest Storms 1950-2002 February 24, 2003


Intercomparison of Windstorms by Track Class
Comparative Analysis of Four Class 1 Events September 21, 2007
Comparative Analysis of Four Class 2 Events September 21, 2007
Comparative Analysis of Four Class 3 Events February 24, 2006
Comparative Analysis of Four Class 4 Events September 23, 2007
Comparative Analysis of Four Class 5 Events September 24, 2007
Comparative Analysis of Four Class 6 Events September 24, 2007
   
Related Topics  
Just How Strong Was That Windstorm? March 5, 2003
A Breakdown of Fatalaties in NW Windstorms February 5, 2008
   
Special Features  
Eastern Hurricanes Vs. PNW Cyclones August 23, 2004
In Memory of Trade-Wind Instruments September 21, 2003
Maximum Anemometers: Nor'Easter and Vigilant September 20, 2003

Rough Breakdown of Windstorm Events by Track Type

Placement of some storms in certain categories is tentative, especially for those that have not been given a webpage at this time. And, like most systems of classification, this one is far from perfect. Gray areas exist: The difference between the offshore-trending southeasters that skim ashore on Washington's Olympic Peninsula, and those storms that dive more directly into Washington moving in from the southwest instead of south-southwest which can place such events in the Washington landfall category, are fairly subtle, and arguments can be made for moving borderline cases into one or the other category.

Explanation of the Following Storm Tack Maps

The closer a given extratropical cyclone approaches the coast, the higher the probability that high winds will occur within the study region. A long-standing rule-of-thumb is that incoming storms most likely pose a wind hazard when they cross inside (i.e. move east of) the 130ºW longitude line, indicated in bright yellow in the accompanying maps below. As with all generalizations of Nature's complex phenomena, there are exceptions to this rule. For example there is a relationship, albiet a rough one, between a storm's central pressure and the extent that gale and storm-force winds extend from the low center. The deeper the low, the further the reach. Thus, a modest 990 hPa storm may have to pass inside 127ºW before it poses a real threat to the region, whereas an intense 940 hPa low might have the capacity to deliver a damaging windstorm from 133ºW. Thus the gradient in the orange color demarking the over-ocean area of windstorm hazard. Land areas shaded in white highlight the region most prone to destructive winds for the given track types. Again, this is a generalization. Each storm has its own set of unique characteristics that affect local wind speeds.

The tracks shown on the maps are the paths of actual high-wind generating extratropical cyclones from the climatological record. The tracks are not comprehensive, but were chosen to show some of the variability. A wide variety of track locations, directions and path changes are associated with windstorms in the study region.

Listed storm events without links are in the works.


Group 1

Offshore-Tracking Southeasters or "Classic Windstorms"
Often the Major Events

Essentially a subset of extratropical cyclones that track across Vancouver Island (Group 4). Deep southern origins combined with a strongly meridional path distinguish these storms from the others. To be in this category, the low-pressure center must track inside 130ºW south of 45ºN. The path puts the center of circulation close to a large stretch of coast, typically triggering high winds from the San Francisco Bay northward into the Lower Mainland of British Columbia. The wide area of effect makes this class of windstorm particularly important. The archetype event in this category is the catastrophic 1962 Columbus Day Storm.


The January 29, 1921 Olympic Blowdown

The Double Windstorms of October 26-27, 1950

The Double Windstorms of December 21-22, 1955

The Spring Gale of April 14, 1957

The Columbus Day Storm (i.e. "Typhoon Freda") of 1962

The Strong Classic Windstorm of March 26, 1971

The Double Windstorms of November 13-15, 1981

The Surprise Gale of March 16, 1984

The Major Windstorm of December 12, 1995

The New Year's Day Storm of January 1, 1997

The Classic Windstorm of January 16, 2000

The Storms of December 14-16, 2002

A Rare Summer Windstorm On August 29, 2015


Group 2

Oregon Landfalls
Some of Oregon's Strongest Storms

To be in this category, the center of the extratropical cyclone must land on the Oregon coast. With these tracks, high winds tend to be focused on western Oregon, sometimes extending into northern California. The Willamette Valley is very prone to damaging winds during those storms that pass through the Northwest corner of Oregon, in some cases bringing catastrophic gales such as the January 9, 1880 tempest.


The Storm King of January 9, 1880

The Springtime Gale of March 27, 1963

The October 2, 1967 Storm King "Jr."

The Sudden Windstorm of March 1, 1974

The Sudden Blast of January 10-11, 1988

The November 15, 1994 South Valley Windstorm

The February 7, 2002 South Valley Surprise

The January 1, 2004 Cyclone: Snowstorm and Blizzard


Group 3

Washington Landfalls
Some of Washington's And Oregon's Strongest Storms

To be in this category, the center of the extratropical cyclone must land on the Washington coast. The Puget Lowlands are particularly vulnerable to storms tracking into the Olympic Peninsula. However, a few individual windstorms in this group have brought high winds to Portland, OR, Seattle, WA, and Vancouver, BC, including the catastrophic October 21, 1934 gale. Another memorable event is the extremely deep December 4, 1951 storm that tracked nearly due east into extreme southwest Washington, delivering an intense gale to western Oregon.


The Major Windstorm of October 21, 1934

The Strong Storm of January 15, 1951

The Major Windstorm of December 4, 1951

The Intense Cyclone of November 3, 1958

The Windstorm of December 20, 1961

The Powerful Windstorm of January 19, 1964

On the Track of '58: The Windstorm of December 15, 1977

The Thanksgiving Day Storm of 1983

Down the Atmospheric River: A Stormy Trio on January 6-9, 1990

The Devastating Inaugural Day Storm of January 20, 1993

The Underachieving Cyclone of January 18, 1996

The Semi-Classic Windstorm of October 25, 2014
The December 21, 2015 "Storm King" Event


Group 4

Vancouver Island Landfalls
Some of Southwest British Columbia's and Washington's Strongest Storms

This category includes high-wind-generating extratropical cyclones that land on Vancouver Island, save for those that are placed in Group 1. There appears to be a tendency for Vancouver Island tracks to cluster at the north and sound ends of the island. If this is not the product of random errors in track determination or human bias, then perhaps the pattern is an outcome of low-pressure centers moving around the relatively high central Vancouver Island ranges, and the Olympic Mountains--though it must be noted that a number of Washington landfall storms appear to have tracked right over the Olympics. The depicted windstorms occurred over a fairly short time interval of 22 years. During the fall and winter months Vancouver Island is often under the mean storm track, with a high frequency of extratropical cyclones passing over the island. In one survey, 50 low-pressure centers moved over the north half of Vancouver Island between January 2008 and April 2013, an average of about nine a year. Typically, the stronger storms on these tracks bring high winds to Vancouver Island and Washington, with some of the larger systems extending into northwest Oregon. One noteworthy event is the 2006 Hanukkah Eve Storm that delivered a powerful gale to both Vancouver, BC, and Seattle, WA, with strong winds extending down into Oregon.


Kitsap Blowdown of February 13, 1979: So Long Hood Canal Bridge

The Gale of January 16-17, 1986

The NW OR Squall Line of December 13, 2001

The January 29-30, 2004 Minor Windstorm

The February 4, 2006 Windstorm
A Windstorm and Atmospheric River on November 15, 2006
The Southeaster of December 11, 2006
The Major Hanukkah Eve Windstorm of December 14-15, 2006
The Powerful Windstorm of November 12, 2007
The Easter Weekend Windstorm of April 2, 2010
The Deep Extratropical Cyclone of March 12, 2012


Group 5

Other Windstorms
Includes Powerful Local Gales

Strong local wind events (e.g. Foehns), gap winds (e.g. Columbia Gorge), strong continental-polar air outbreaks, thunderstorm downbursts and tornadoes.


The SW OR Windstorm of February 24, 1961

The Northerly Gale of December 1990


"Hey, what about the rest of California?"

For San Francisco Bay Area storm watchers, I suggest taking a look at Jan Null's "Bay Area Storm Index" (BASI).

It is a very neat way of gauging the big baddies of the Bay Area.

"Okay, but what about SoCal?"

What--there is weather down there?


Acknowledgements

For their generosity with help and information, I thank the people at the National Climatic Data Center, the Western Region Climate Center, Environment Canada, the National Weather Service, especially those people working at the Eureka, Portland and Seattle offices, the National Data Buoy Center, the Oregon Climate Service, the Office of the Washington State Climatologist, the University of Washington Department of Atmospheric Sciences, the University of British Columbia Forest and Conservation Sciences (for providing a major research opportunity) and Earth and Ocean Sciences, and the Oregon Historical Society. Without the efforts of the people working at these varied organizations, the information provided on these pages wouldn't have been available. Thank you all!

Copyright Notice

All text, graphics, photos and illustrations on the pages of this storm-related website are copyright 1981-2015 by Wolf Read, hereafter referred to as the author/illustrator, unless stated otherwise. This website is intended to help educate the public on dangerous Pacific Northwest storms, and, as it is also a research project in progress, to provide some groundwork for those interested in doing storm research for themselves. In keeping with that direction, and in the tradition of scientific information sharing, permission for reproducing material on this website will be granted, provided that these conditions are met: 1) credit is clearly given to the author/illustrator and this website in the reproduction, and 2) the author/illustrator is notified of how and where the material is being used (e-mail link below). Note that this permission can only be extended to material created by the author/illustrator.

Thanks for visiting this website!


Page Last Modified: November 28, 2016
Page Created: July 31, 2001

Project Started: October 17, 2000

(I am often very busy, and can take a fair amount of time to respond to e-mail.)