The Major West Coast Windstorm of a perspective by Wolf Read |
|
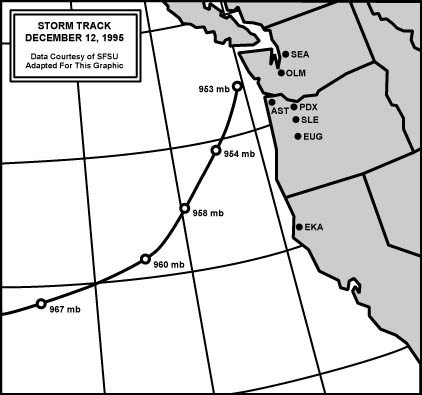
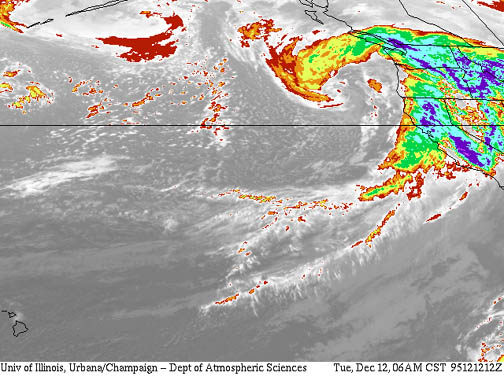
Every so many years, there arrives a windstorm that seems like a contender for challenging the great Columbus Day storm of 1962 for "largest wind event on record." Such blows include, but are not limited to March 26-27, 1971, November 14, 1981, and January 20, 1993. Though there has often been a lot of dramatic press coverage about such storms--with some good reason, as they were fairly powerful, even life-threatening, events--none of these windstorms have matched the grandeur of Columbus Day 1962. None. December 11-12, 1995, saw the development of yet another contender for top storm, a low that "bombed" (a slang term for explosive cyclogenesis, which is when a low pressure center deepens rapidly) off of the California coast, then tracked northeast-ward up the west coast into Washington, blasting towns and cities all the way up the U.S. West Coast. This storm almost matched the Columbus Day storm peak gust for peak gust along the immediate coast, and even exceeded it in select regions, like in the San Francisco Bay Area. But further north, the December 1995 storm didn't reach the strength of the Columbus Day blow in the Willamette Valley and in the Puget Lowlands. For Oregon, the lower wind velocities were partly due to the fact that the December 1995 storm generally did not track as closely to the coast as did the 1962 "Big Blow." The Columbus Day Storm hugged Oregon's Coast at a distance of 50-75 miles, starting from the southern border all the way up, heading in a generally northward track. The December 1995 storm started much further offshore of SW Oregon and raced northeastward, as an excerpt from this report issued at 9:45 PM PST Monday December 11, 1995 suggests: "Satellite imagery and ocean buoy reports confirm the development of an intense low pressure center 600 miles off the coast of Oregon. Forecast models continue to show the low moving northeast along the coast and into northwest Washington by Tuesday evening." Another report at 12:15 PM PST Tuesday December 12, 1995 reads: "At 12 Noon the intense storm was located about 100 miles west of Astoria Oregon and was moving northeastward towards the extreme northwest tip of Washington. By 4 PM PST it should be near Tatoosh Island." The greater distance offshore appears have been the big factor that prevented the kind of terrific gale seen in 1962 from striking Oregon. This can't be the reason why much of Western Washington was spared a Columbus-Day-like gale. After the 1995 cyclone passed the latitude of Astoria, it finally did come within a distance equal to the 1962 storm. A report from the NWS Seattle issued at 2 PM PST Tuesday December 12, 1995 mentions: "At 2 PM...The intense storm was located about 50 miles northwest of Astoria Oregon and moving northeast. The storm center is now expected to move across the Olympic Peninsula by 5 PM." The low did cross the Olympic Peninsula, putting the 1995 center much closer to many Western Washington locations when compared to the 1962 center. Stronger winds can expected nearer the center, where the steepest gradients often reside. Yet these locations didn't suffer winds any higher than places in Oregon. It appears that the December 1995 low was a bit broader than the Columbus Day Storm, with gradients not quite as dramatic. One indicator of this is with the Astoria-Hoquiam (AST-HOQ) measure of pressure gradient. The December 12, 1995 windstorm produced a peak AST-HOQ gradient of +8.6 mb (+0.25") at 19:00 as the low moved ashore just north of Hoquiam. The Columbus Day Storm produced a peak AST-HOQ gradient of +10.8 mb (+0.32") at 21:00 as the low scooted by just offshore. Due to the difference in tracks, the December 1995 storm was favored for a maximal gradient when compared to the Columbus Day Storm. That the Columbus Day Storm managed 2.2 mb higher than the 1995 event with less favorable low-center orientation suggest a more tightly wound cyclone in 1962. One other factor probably contributed to lower wind speeds throughout Western Oregon and Washington on December 12, 1995: storm speed. The Columbus Day Storm moved more rapidly than the 1995 event, and this difference could have contributed to the higher wind speeds witnessed in the earlier storm. Figure 1, below, was found on a San Francisco State University website on this storm: Explosively Developing Cyclone. This image was taken at 04:00 PST, just as the winds were beginning to escalate in the San Francisco Bay Area. The exact center of the low is northeast of the tip of the bent-back occlusion. The core was rather elongated to the northeast, and was showing some signs of developing a secondary center right off of Northwest Oregon. |
From the few datapoints available, it seems that most of the big 955 to 975 mb cyclones that follow northward tracks close to the U. S. West Coast ("Inside 130", as NWS forecasters like to say, which referrs to east of 130º W longitude) tend to produce maximum wind gusts of about 60 to 95 mph at offical stations on the coast and 50 to 75 mph at official stations inland. This is the standard scenario. This is generally what happened during the large events in October 1950, March 1971, November 1981, and during the December 1995 storm examined on this web page. Peak wind velocity among these storms, and other lesser events, varies with a rough correlation to minimum central pressure. The Columbus Day Storm was different. It's minimum central pressure of about 960 mb wasn't that unusual among the big cyclones. December 1995 was deeper. However, the Columbus Day winds were unusual. Gusts reached about 80 to 140 mph at official stations on the Oregon coast, and 85 to 125 mph at stations inland. This makes the Columbus Day Storm an outlier. It is off-the-curve unique. A singularity. An event like the Columbus Day Storm probably won't happen again for another 100 years, maybe even 1,000. The Columbus Day Storm probably should be treated as its own category--especially when trying to forecast the peak wind potential of a new cyclogenic bomb based on windstorm climatology. Figure 1, below, depicts the track that the December 12, 1995 cyclone followed. The 1995 low continued to deepen as it moved northward, somewhat unlike the Columbus Day Storm, which reached peak intensity off the Oregon Coast, and then slowly degraded as it raced northward. |
|
Personal Experience What follows is what I recorded in my journal during the December 1995 windstorm, with some notes on damage seen some time after the event. Keep in mind that, at the time, I lived in El Cerrito, a small incorporation on the east shore of the San Francisco Bay. This put me in the center of a region that saw windspeeds that challenged the Columbus Day Storm: |
|
|
General Storm Data Minimum Pressures and Peak Gradients Table 1, below, lists the lowest barometric pressure readings at various locations in the December 12, 1995 windstorm, and the Columbus Day Storm and compares them, when available. The readings for the December 1995 storm are spectacularly low. Note that Salem in 1995 dropped as low as did Tatoosh Island in 1962! The Columbus Day low-pressure center was beginning to fill significantly as it headed into the waters off of Washington. The lowest central pressure for the storm of 1962 was about 28.30" at 11:00 AM, when the low was 205 miles west of Eureka, CA (this information comes from Franklin, Dorothy, "West Coast Disaster," 1962). It seems that the December 1995 low didn't undergo much filling before making landfall on the Olympic Peninsula. Maybe the difference in tracks allowed the 1995 low to maintain integrity as it raced inland. After all, the Columbus Day Storm spent a large part of its existence close to shore, and the degrading effects of the vertical topography of the west. The December 1995 low, on its northeast track, didn't get very close to land until it had reached the latitude of Washington. There's a nice trend of increasing difference in barometric minimums in a northward direction, from about 0.10" in Northern California to about 0.30" in Northern Washington, with some exceptions (like Toledo). This reflects on the December 1995 storm's northeast tendency compared to the Columbus Day Storm's northward migration. Washington stations, in general were much closer to the center of action in 1995. The Columbus Day Storm's weakening offshore of Washington also contributed. Source for data in table: National Climatic Data Center, unedited surface observation forms, unless otherwise noted. |
|
Table 1, notes. [1] The 1995 value (958.8 mb) is from Buoy 46041 Cape Elizabeth, 52 miles west of Aberdeen, WA. From the National Data Buoy Center historical meteorological data. [2] The 1995 figure is from the Destruction Island C-MAN station, and was obtained from the National Data Buoy Center historical meteorological data. The 1962 figure is from Decker, Fred W., Cramer, Owen P., Harper, Byron P, "The Columbus Day 'Big Blow' in Oregon," Weatherwise, December 1962. [3] The 1995 figure is from the Tatoosh Island C-MAN station, and was obtained from the National Data Buoy Center historical meteorological data. [3] Sadly, the unedited surface observation forms for some stations during the December 12, 1995 windstorm are lost due to a corrupt data file at the NCDC. This includes Quillayute, Seattle, Medford and San Francisco. The minimum reading from Seattle is from the NCDC Storm Data publication for December 1995. |
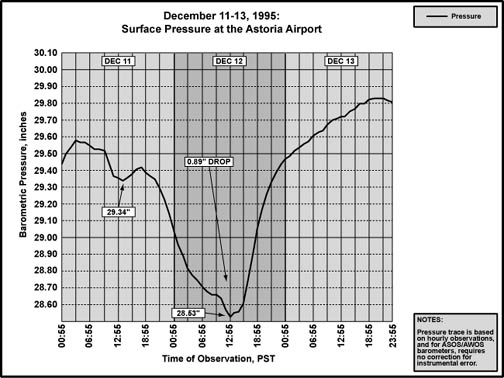
Table 2, below, lists the lowest barometric pressures achieved during the December 12, 1995 storm for the 11 key Pacific Northwest locations used in general comparison between storms on this website, and the time of occurrence of the barometric minimums. Many of these values are all-time record low pressures, including the readings at Arcata, Bellingham, Eugene, Olympia, Salem and Seattle. The minimum of 28.53" (966.1 mb) at Astoria, often noted as the all-time low pressure for that location, was short of the 28.45" (963.4 mb) reading witnessed durng the Storm King of Janaury 9, 1880. Portland's reading of 28.73" (973.0 mb) is at least third place, being short of the 28.72" (972.6 mb) reading from the great December 4, 1951 windstorm and the 28.56" (967.2 mb) reading from the January 9, 1880 event. At North Bend, the low pressure of 28.70" (971.9 mb) during the Columbus Day Storm was slightly lower than the 28.72" (972.6 mb) during the 1995 gale. At Tatoosh Island, the barometric pressure was at or below 28.75" (973.5 mb) from the 06:00 observation to 20:00, an incredible 14 hours! At Seattle, pressures held at or below 28.75" from 12:00 to 19:00, or seven hours. The long period of low pressure, plus the close association in time of pressure minimums at Western Washington locations, mark a very deep, broad low, one that appears to have been elongated in an west-to-east manner. The average minimum pressure of 28.69" (971.6 mb) for these stations is significantly lower than the 28.85" (977.0 mb) 11-station average for the Columbus Day Storm, and the 28.90" (978.7 mb) average for the December 4, 1951 cyclone. The December 12, 1995 cyclone produced the lowest pressure minimum average out of any cyclone to strike the Pacific Northwest in the 1950-to-present era. Source: Pressure data is from the National Climatic Data Center, Unedited Surface Observation Forms (most stations), and the National Data Buoy Center historical meteorological data (Tatoosh Island C-MAN station TTIW used in place of Quillayute, and West Point C-MAN station WPOW1 used in place of Sea-Tac). |
|
Table 2, notes. [1] Medford's unedited surface observation forms lost due to a corrupt data file at the NCDC. [2] Quillayute's unedited surface observation forms lost due to a corrupt data file at the NCDC. Tatoosh Island C-MAN station TTIW used in place of Quillayute. [3] Sea-Tac's unedited surface observation forms lost due to a corrupt data file at the NCDC. West Point C-MAN station WPOW use in place of Sea-Tac. [4] Due to missing data from Medford (see [1] above), the average in the case of the December 12, 1995 storm is from the ten available samples. |
Table 3, below, is a list of the maximum hourly pressure gradients, and time of occurrence, for the December 12, 1995 windstorm. Some of these measures are spectacular. The ACV-AST value of +33.0 mb (+0.97") ties the peak value for the Columbus Day Storm. The OTH-UIL reading of +31.8 mb (+0.94") beats the peak value of +27.3 mb (+0.81") witnessed during the Columbus Day Storm by a decisive margin. The Columbus Day Storm was clearly weakening as it moved into Washington's offshore waters, and this may account for the lower OTH-UIL (TTI) gradient for the 1962 event. The peak PDX-SEA gradient of +15.3 mb (+0.45") is second only to the +15.4 mb (+0.455") value generated by the Inauguration Day storm of 1993, and is significantly above the +9.9 mb (+0.29") peak value for the Columbus Day Storm--though it should be kept in mind that the PDX-SEA reading in December 1995 is actually a PDX-WPOW (West Point) reading, which is over a longer distance and therefore probably a millibar or two high when compared to the standard PDX-SEA measure. Source: Pressure data is from the National Climatic Data Center, Unedited Surface Observation Forms (most stations), and the National Data Buoy Center historical meteorological data (Tatoosh Island C-MAN station TTIW used in place of Quillayute, and West Point C-MAN station WPOW1 used in place of Sea-Tac). |
|
Table 3, notes. [1] Quillayute's unedited surface observation forms lost due to a corrupt data file at the NCDC. Tatoosh Island C-MAN station TTIW used in place of Quillayute. Incidentially, this makes for more accurate comparisons between this storm and those before the 1964 opening year for the Quillayute station, which replaced the Tatoosh station for many decades. [2] Medford's unedited surface observation forms lost due to a corrupt data file at the NCDC. [3] Sea-Tac's unedited surface observation forms lost due to a corrupt data file at the NCDC. West Point C-MAN station WPOW use in place of Sea-Tac. The different positions of SEA and WPOW probably cause the PDX-WPOW gradient to be about 1-2 mb high and the WPOW-BLI 1-2 mb low when compared to the standard PDX-SEA and SEA-BLI measures. [4] Sea-level pressure unrecorded at The Dalles from 23:00 to 05:00 each day. The peak gradient listed, having occurred right at the first DLS observation of the 12th, could have been higher before 06:00. |
Pressure Tendencies Table 4, below, lists the maximum hourly pressure falls and rises achieved during the December 12, 1995 storm for 11 Pacific Northwest stations. The peak -5.1 mb (-0.15") hourly drop at North Bend is the highest on record, slightly beating out the -5.0 mb (-0.148") recorded as the great Columbus Day Storm raced northward toward the station. The rest of the values, both in fall and rise, are quite strong, but other storms in history have exceeded these tendencies--in some cases by a large margin. In terms of the 11-station averages, the Columbus Day Storm was clearly ahead of the December 12, 1995 event on both counts with a -4.6 mb (-0.14") average hourly declension, and a +6.2 mb (+0.18") average hourly climb. The -3.5 mb (-0.10") average for the December 12, 1995 storm is behind at least five storms in the 1950-to-present era: November 14, 1981 (-3.7 mb / -0.11"), October 12, 1962, December 16, 1961 (-3.6 mb / -0.105"), December 21, 1955 (-4.1 mb / -0.12") and December 4, 1951 (-4.4 mb / -0.13"). And the +4.5 mb (+0.13") average for the 1995 storm is behind at least three storms in the 1950-to-present era: October 12, 1962, December 20, 1961 (+4.6 mb / +0.136") and February 24, 1958 (+5.2 mb / +0.15" based on eight stations). Some of the more spectacular pressure surges during the December 12, 1995 windstorm happened at buoys and automated stations along the Washington shoreline as the bent-back occlusion pushed inland behind the low center. At Destruction Island, starting at 20:00 on December 12th, the pressure surged from 972.3 mb (28.71") to 979.3 mb (28.92") in a single hour--that's +7.0 mb (+0.21"). At the time of the pressure jump, strong west-southwest winds poured in, sustaining at 62 mph and gusting to 70. Buoy 46041 Cape Elizabeth witnessed a +6.0 mb (+0.18") surge during the same hour, with southwest winds escalating to 43 mph gusting to 58. Welcome to the Information Age, era of twitchy machines. The ever-familiar corrupt data files from the NCDC for the MFR, SEA and UIL stations turns up here, with missing and or substituted values. Source: Pressure data is from the National Climatic Data Center, Unedited Surface Observation Forms (most stations), and the National Data Buoy Center historical meteorological data (Tatoosh Island C-MAN station TTIW used in place of Quillayute, and West Point C-MAN station WPOW1 used in place of Sea-Tac) and for the Destruction Island and Cape Elizabeth descriptions. |
| ||||||||||||||||||||||||||||||||||||||||||||||||||||||||||||||||||||||||||||||||||||||||||
Table 3, notes. [1] Medford's unedited surface observation forms lost due to a corrupt data file at the NCDC. [2] Quillayute's unedited surface observation forms lost due to a corrupt data file at the NCDC. Tatoosh Island C-MAN station TTIW used in place of Quillayute. Incidentially, this makes for more accurate comparisons between this storm and those before the 1964 opening year for the Quillayute station, which replaced the Tatoosh station for many decades. [3] The -2.8 mb/hr drop is the first of two occurrences, the other being at 02:00 on the 12th. [4] Sea-Tac's unedited surface observation forms lost due to a corrupt data file at the NCDC. West Point C-MAN station WPOW use in place of Sea-Tac. [5] Due to missing data from Medford (see [1] above), the average in the case of the December 12, 1995 storm is from the ten available samples. |
Peak Wind and Gust Table 5, below, provides a list of peak gusts from the December 1995 windstorm, and the Columbus Day Storm of 1962, so that the two storms can be compared. I also offer the difference in the peak gust speeds, and what that means in terms of wind force (i.e. the difference in the strength of the wind, as opposed the velocity). Wind force increases with the square of the velocity. In other words, when the velocity is doubled, the force is quadrupled. A 50 mph wind at sea level produces about 10 lbs per square foot of force. A 100 mph gust hits with four times the force--about 40 lbs per square foot, not 20 as one might suppose by simply doubling the force in correspondance with the increase in velocity. By examining the peak gusts in this light, we see that the Columbus Day Storm had significantly more punch than the December 1995 windstorm in many areas. Sources include the National Climatic Data Center (such as the Local Climatological Data, Unedited Surface Observation Forms, and online Climate Visualization Database), the National Weather Service at Portland (such as the online monthly summaries for Eugene, Salem and Portland) and Seattle (For example, Bellingham's peak gust was mentioned in a High Wind Warning Statement issued at 12:12 AM PST Wednesday December 13, 1995), and Franklin, Dorothy, "West Coast Disaster," 1962. Some of the figures below are tentative, and could be changed as I find more information on these two storms. Interestingly, for North Bend, OR, neither of these storms were the strongest in the past 40 years--November 1981 saw a gust to 92 mph at this location! |
|
Table 5, notes. [1] 62 mph is from the ASOS system. Apparently peak gust recorders registered 74 mph (source, National Weather Service, Portland, "Climate of Portland." This is also the source for the peak gust of 104 mph cited for the Columbus Day Storm.) [2] From NCDC's ClimVis Database. [3] The Seattle Naval Air Station (decomissioned in 1970) recorded a peak gust of 66 mph in the Columbus Day Storm, according to the NCDC's ClimVis Database. |
| Table 5 provided a straightforward comparison, however, study of the units-of-measure, and sensor location information, show that the data from the two storms were not collected in the same manner, rendering comparisons dubious. Table 6, below, shows winds at some of the above stations, and the associated instrument information, such as sensor height and location. Differences between 1962 and 1995 are significant. |
| |||||||||||||||||||||||||||||||||||||||||||||||||||||||||||||||||||||||||||||||||||||||||||||||||||||||||||||||||||||||||||||||||||||||||||||||||||
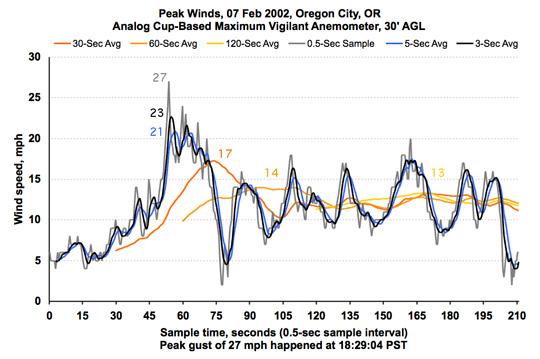
With the exception of some stations in Washington, wind speeds for the December 1995 storm were measured on the new ASOS/AWOS system, which provides wind data in a 2-minute average format with 5-second peak gust. The ASOS User's Guide states specifically that, "In ASOS, the peak wind is determined from the highest 5-second average wind speed that exceeds 25 knots since the last generated METAR." At the time of the Columbus Day Storm, the Weather Bureau recorded either average 1-minute winds and/or fastest mile, with peak instantaneous gust. For example, in the October 1962 Local Climatological Data for the Eugene airport, the peak wind is listed under fastest 1-minute, and it is noted that, "a momentary gust of 86 MPH [was] observed." Further complicating matters, however, is the old method of computing average wind, which, as noted in the discussion of wind speeds for November 14, 1981, has the possibility of observer error. Observer error may explain some of the wide variation between peak 1-minute wind and peak instantaneous gust recorded at some sites in the Columbus Day Storm. Note the 44 mph gusting to 58 at Sea-Tac and the 44 mph gusting to 96 at Astoria. It is possible that Astoria's actual peak 1-minute wind was higher than 44 mph--though the Columbus Day Storm was noted for extremely gusty winds, as corroborated by a 26 mph gusting to 81 reading at North Bend. It's probably telling that, on the standard Surface Observation Form used at the time of the Columbus Day Storm, the wording is such: "Fastest observed 1-minute wind speed ______ m. p. h. [Emphasis added]" This is one area where ASOS shines: wind measure is controlled by computer, which makes the methodology between stations consistent. If ASOS and AWOS stations provided a 1-minute average and instantaneous peak gust, these readings would tend to be higher than the new standard 2-minute average and 5-second peak. This means that the reported speeds for the 1995 storm are probably low when compared to the figures for the Columbus Day Storm. In an example from my own records, the February 7, 2002 South Valley windstorm produced a peak instantaneous gust of 27 mph on a new, well-calibrated anemometer. I videotaped the event, and later captured the footage on computer so that wind velocity in 0.5-second increments could be recorded. The data are shown in Figure 3, below. From this data, a running 5-second average was calculated. At 21 mph, the 5-second peak was much lower than the instant gust. That's a difference of 23%! Figure 3 clearly shows the "smoothing" effect that a 5-second running mean has on peak instant gusts. The average difference between the instant reading and the 5-second reading was 1.68 mph for this four-minute stretch of wind. With an average velocity of 11.38 mph over the four minutes, the average difference was 15%. Running averages for 30, 60 and 120 seconds were also calculated. Wind speed lowered for each time interval, though the difference is less between the longer time-periods. The peak one and two minute averages were quite close: 14.0 mph and 13.3, or within 5%. |
The peak instantaneous gust reported on December 12, 1995 for Portland, 74 mph, was taken on the old pre-ASOS wind gauge, and is therefore an instant (though now unoffical) reading [personal communication with Dave Willson, Lead Forecaster for NWS Portland, 2002]. With a peak 5-second gust of 62 mph at the Portland ASOS, there's a difference of 17% between the two readings, which is close to that 23% figure noted above. Averaging the two percentages and taking off with this "peak gust adjustment," the 5-second peak at Eugene converts to an instantaneous gust of 59 mph. Salem changes to 71 mph, and Astoria to 75. These are still significantly lower than the storm of '62, but not as much as the new National Weather Service wind measure format might suggest. A difference of 5% doesn't change the 2-minute averages much, keeping some of the 1962 readings significantly on top. Due to its high velocity, Portland's fastest mile of 88 mph in 1962 can be read as a 41-second average (essentially, wind moving at 88 mph will cover a mile in 41 seconds). In the wind data I took for the 2002 storm, the difference between the 41-second and 2-minute averages is about 15%. Portland's peak 2-minute wind of 51 mph for the December 1995 storm converts to a 59 mph 41-second speed, still far off the 1962 mark--that's a difference in wind force of about 2.2 times. There are many objections to these adjustments, not the least of which is that the anemometer used for the conversions is of a different make than an ASOS wind sensor. With a difference of about 40% between peak 5-second and peak 2-minute, it is clear that the winds at my location were significantly more turbulent than at less obstructed airport-based anemometers, which usually vary between 15% and 25% between average speed and gust. And the sample resolution of 0.5 second is also probably different. The above paragraph mainly serves to show what potential differences might exist between the two formats. The average difference between peak gust and peak 5-second wind at ASOS stations is probably more like 5-10% by conservative estimate. Unfortunately, changes in wind record format aren't the only complications introduced when comparing wind speeds between the two storms. Modern ASOS wind sensors tend to be higher than the 20-foot standard of the pre-automated era. According to the ASOS User's Guide, Most ASOS anemometers are put at the new FAA standard of 10 meters, or 32.8 feet, with some at 27 feet, depending on "site-specific restrictions or requirements." Anyone who's played around with setting up an anemometer knows that a relatively small increase in height can have a significant affect on peak winds. A change of 7-13 feet is 25-40% higher than the old 20-foot standard. Wind speeds will tend to be higher with the new system. This, in effect, means that the adjusted peak gusts are probably high in comparison to the Columbus Day Storm, with a few exceptions, like Astoria, where the anemometer has been lowered to meet the new standard. Ultimately, what is left after this analysis is a fairly muddy comparison that suggests the Columbus Day Storm had more powerful winds, at least at most Oregon locations. There is some evidence in the data that suggest the 1995 event was somewhat of a flip-flop of the 1962 one, with the strongest impact happening in Northern California, then again in the Seattle Area. The peak 5-second wind of 74 mph at San Francisco shines far above the 62 mph instantaneous gust in 1962, and Sea-Tac's pathetic 58 mph for the Columbus Day Storm is a mark below the 60 recorded in 1995. Despite well-calibrated anemometers set up at many locations, it seems that, like for the January 1880 cyclone, anecdotal evidence is still king when comparing windstorms! Comparison of the newspaper accounts, and personal experiences, suggest rather unanimously that, even though December 1995 was bad, the level of emergency that resulted during the 1962 Big Blow was far, far worse. Table 7, below, shows the December 12, 1995 windstorm's peak wind and gust for the stations in Table 6, adjusted to reflect the differences in sensor height and wind measure. Note that the power law formula was intended for sustained winds, not wind gusts, so its application in the peak gust column is a bit dubious. |
| ||||||||||||||||||||||||||||||||||||||||||||||||||||||||||||||||||||||||||||||||||||
| These adjusted December 12, 1995 peak wind values can then be compared to the Columbus Day Storm, as is done in Table 8, below. A positive value in the difference column reflects stronger winds during the 1962 event, negative reflects stronger winds during the 1995 event. The results put the Columbus Day Storm clearly on top for many places in Oregon. December 1995 has the edge over the 1962 storm far south in San Francisco, and in the Seattle area--but the difference is minor compared to the Columbus Day Storm's huge margin in places like the Willamette Valley. The Columbus Day Storm's lead narrows northward, indicative of the 1962 cyclone's weakening off the Washington Coast more than a significantly larger 1995 impact for Washington. |
| ||||||||||||||||||||||||||||||||||||||||||||||||||||||||||||||||||||||
| With the differences in wind measure now noted, the discussion can now move to Table 9, below, a list of the peak wind and gust for eleven key stations in the Pacific Northwest, their direction, and their time of occurrence. By my own personal methodology, a wind event rates the term "windstorm" when the average peak gust of these eleven stations reaches 39.0 mph (gale force) or higher. This ranking favors those storms that follow a northward path close to the U.S. Pacific Coast, and for good reason--such storms affect the largest land area, and therefore are potentially the most destructive. The incredibly deep December 12, 1995 cyclone followed such a path, with damaging, sometimes outright destructive, winds striking many points along the way, and this windstorm's average peak gust, 61.4 mph, ranks this event among the few great storms of history. Taken without modification for difference in wind measure, the 1995 strom is behind just three storms from the 1950-to-present era: January 15, 1951 with an average of 61.6 mph, October 12, 1962 with an average of 80.5, and November 14, 1981 with an average of 65.9. With a conservative 10% adjustment upward for peak gusts at known ASOS stations, the December 1995 storm shows an average peak of 64.4, which places it 3rd behind the November 14, 1981 and Columbus Day Storms. That's a close 3rd, and it could very well have edged second with an unusually high peak instant gust at a station or two. |
| Location | Peak |
Direction |
Obs Time of |
Peak |
Direction |
Obs Time of |
| California: | ||||||
| Arcata | 35 |
220º |
07:53 HRS, 12th |
58 |
220º |
07:42 HRS, 12th |
| Oregon: | ||||||
| North Bend [1] | 69 |
180º |
11:49 HRS, 12th |
86 |
180º |
11:49 HRS, 12th |
| Astoria | 46 |
200º |
17:57 HRS, 12th |
62 |
190º |
17:56 HRS, 12th |
| Medford [2] | 31 |
150º |
MM |
45 |
140º |
MM |
| Eugene | 40 |
180º |
13:02 HRS, 12th |
49 |
180º |
13:01 HRS, 12th |
| Salem | 46 |
170º |
13:23 HRS, 12th |
59 |
180º |
13:23 HRS, 12th |
| Portland | 51 |
170º |
13:17 HRS, 12th |
62 |
170º |
14:20 HRS, 12th |
| Washington: | ||||||
| Quillayute [3] | 51 |
237º |
22:00 HRS, 12th |
61 |
237º |
22:00 HRS, 12th |
| Olympia | 45 |
160º |
14:41 HRS, 12th |
57 |
140º |
14:48 HRS, 12th |
| Sea-Tac [4] | 37 |
180º |
19:00 HRS, 12th |
60 |
180º |
MM |
| Bellingham | 37 |
190º |
23:58 HRS, 12th |
76 |
200º |
22:34 HRS, 12th |
| AVERAGE [5] | 44.4 |
185º |
61.4 |
183º |
Table 9, notes. [1] Due to equipment failure during the storm, possibly due to power failure, wind direction at North Bend was estimated at the time of peak winds. Its probable that the peak velocities were also estimates, but this isn't clear on the surface observation form. [2] Medford's unedited surface observation forms lost due to a corrupt data file at the NCDC. Wind data are from the Local Climatological Data monthly summary for December 1995. Time of peak wind and gust not noted in the publication. [3] Quillayute's unedited surface observation forms lost due to a corrupt data file at the NCDC. Quillayute's peak gust not noted on the December 1995 Local Climatological Data montly summary. Tatoosh Island C-MAN station TTIW used in place of Quillayute. Incidentially, this makes for more accurate comparisons between this storm and those before the 1964 opening year for the Quillayute station, which replaced the Tatoosh station for many decades. And it also probably gives a boost to the 11-station averages, for winds at Tatoosh tend to be higher than at Quillayute. [4] Sea-Tac's unedited surface observation forms lost due to a corrupt data file at the NCDC. Peak wind is from the 3-hourly observations noted in the Local Climatological Data monthly summary for Sea-Tac, December 1995, as is peak gust. [5] Assumes 5-second and instant gusts are the same. |
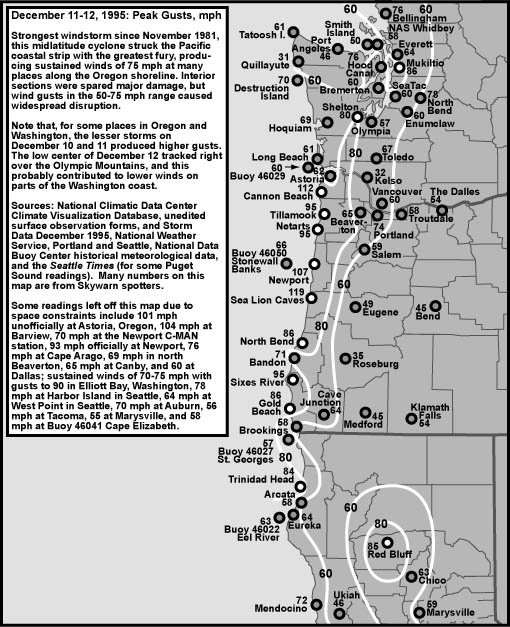
| Table 10, below, lists the peak gusts reported by NWS Seattle spotters (with a few from Oregon) during the December 12,1995 windstorm. These reports were posted during the storm by NWS Seattle, and I carefully collected them all as they became available. Taken at face value, some of these peaks approached Columbus Day Storm levels, and in the storm reports it is mentioned that 60 to 80 mph readings were also seen in the Willamette Valley of Oregon. However, it is interesting that the higher winds managed to miss many official stations in Dec 1995--though the difference in wind measure, 5-second peak next to peak instant gust, may account for some of the disparity. With few exceptions during the Columbus Day Storm, the official stations were slammed just as hard as the unofficial ones (indeed, a number of official sites had instrument failure due to power outages and/or structural damage!). The Sea-Tac Airport is the one big exception. Despite a 100 mph reading at the nearby Renton Airport, Sea-Tac only managed a peak of 58 mph in 1962 (note that the anemometer at Renton was at 64' above ground level, fully 44' above SeaTac's 20'). Sea-Tac's reading is so much lower than the typical 75-95 mph gusts in the region that it is unusual. It should be noted that some of the locations below are more wind prone than official sites. I've seen Auburn yield high readings in windstorms previous to December 1995, such as 70 mph during the January 16, 1986 storm, so a high reading at this location my not be that unusual for a storm of this type. Enumclaw typically gets strong east winds ahead of deep, NE-trending storms. Portland, OR, sees a similar effect as winds rush down the Columbia River Gorge. |
| Location | Peak Wind | Time |
| Enumclaw, WA | 60 mph (E) | 6:00 AM |
| Wickersham, WA | 50 mph | 8:00 AM |
| Alsea, OR (Near Corvallis) | 70 mph | 11:30 AM |
| Sea Lion Caves, OR | 118 mph | 12:00 PM |
| Chinook, WA | 78 mph | 1:30 PM |
| Puyallup, WA (Pierce 6) | 65 mph (SE) | 2:00 PM |
| Grayland Beach, WA (Grasy Harbor 2) | 50 mph | 2:20 PM |
| Ocean Shores, WA (Grays Harbor 5) | 54 mph | 2:30 PM |
| Seattle, WA (King 23) | 40 mph | 2:45 PM |
| Ocean Shores, WA (Grays Harbor 5) | 54 mph | 5:00 PM |
| Mukilteo, WA (Snohomish 30) | 58 mph | 6:00 PM |
| Tacoma, WA (Pierce 20) | 56 mph | 6:20 PM |
| Seattle, WA (King 23) | 51 mph | 6:20 PM |
| Marysville, WA | 46 mph | 6:20 PM |
| Auburn, WA | 70 mph | 6:30 PM |
| Olympia, WA (Thurston 1) | 65 mph | 6:30 PM |
| Long Beach, WA | 61 mph | 6:50 PM |
| Harbor Island, Seattle, WA | 78 mph | 7:40 PM |
| Aberdeen, WA (Grays Harbor 10H) | 55 mph | 7:47 PM |
| Lummi Island, WA | 50 mph | 7:50 PM |
| Edmonds, WA | 64 mph | 8:20 PM |
| Mukilteo, WA (Snohomish 30) | 86 mph | 8:20 PM |
| North Bend, WA | 78 mph | 8:20 PM |
| Bellingham, WA (Whatcom 8) | 54 mph (S) | 8:40 PM |
| Marysville, WA (Snohomish 35) | 55 mph (SE) | 8:40 PM |
| Table 11, below, lists some storm reports posted by the NWS at Monterey during the December 12, 1995 windstorm. Some of the rainfall readings are truly spectacular. For comparison to the Columbus Day Storm: San Francisco reported a 3-day rain total of 4.78" by 3 PM Saturday, October 13, 1962, which brought the season total (starting July 1st) to 5.09", which was the second highest in 113 years of record (1904 saw 7.12" by Oct 13th). The Oakland International Airport was soaked with 4.32" of rain in 24 hours. Woodside had 9.59" during the Columbus Day Storm, Skylonda 8.07" in 24 hours, and Belmont had 4.47" in 24 hours. Yreka saw 4.97" in six days. It seems that in the rain department, as with the peak gusts, December 1995 surpassed the Columbus Day Storm at some locations. |
| Location | Event | Time |
| Redway, CA (Humboldt Co.) | 1 fatality from tree falling on house. | NA |
| Redding, CA (Shasta Co.) | 1 fatality from tree falling on house. | NA |
| Sunnyvale, CA (Santa Clara Co.) | 45 mph gust. Several trees down and numerous arcing power lines. | 2:30 AM |
| Stanta Cruz Mts., CA (Santa Cruz Co.) | 70 mph wind gust. | 4:00 AM |
| Marin County, CA | 70 mph wind gust. | 4:36 AM |
| San Francisco, CA (San Francisco Co.) | 85 mph wind gust at San Francisco State University. | 6:30 AM |
| Oakland, CA (Alameda Co.) | 75 mph wind gust. | 7:15 AM |
| Los Gatos, CA (Santa Clara Co.) | 6.7" 24-hour rainfall. | 7:35 AM |
| Mount Umunhum, CA (Santa Clara Co.) | 97 mph wind gust. | 7:45 AM |
| San Francisco Bay Area, CA | California Highway Patrol reports 150 weather- related accidents between 6:30 AM and 7:45 AM. | 8:00 AM |
| Angel Island, CA (San Francisco Bay) | 103 mph wind gust. | 8:03 AM |
| Monterey, CA (Monterey Co.) | 1 fatality from tree falling on moving car. | 8:15 AM |
| Healdsburg, CA (Sonoma Co.) | 7.7" 24-hour rainfall. | 8:45 AM |
| San Bruno Mt., San Francisco, CA | 205 foot local radio station tower blown down in 90+ mph wind. | 9:00 AM |
| Monterey, CA (Monterey Co.) | 1 fatality from tree falling on moving car. | 9:15 AM |
| San Francisco, CA, Park Presidio | Road closed at tunnel due to flooding. | 9:46 AM |
| Oakland, CA (Alameda Co.) | 2.66" 45-minute rainfall. | 10:00 AM |
| Sebastopol, CA (Sonoma Co.) | 8.98" storm total rainfall. Many downed trees and widespread power outages. | 10:00 AM |
| Belmont, CA (San Mateo Co.) | 62 mph wind gust. 4.5" storm total rainfall. | 10:30 AM |
| San Francisco, CA (San Francisco Co.) | Large sinkhole affected 25 families. | 10:50 AM |
| Healdsburg, CA (Sonoma Co.) | 15.01" storm total rainfall at Russian River. Numerous power lines and trees down. | 1:00 PM |
| Cambria, CA (San Luis Obispo Co.) | 8.0" rainfall from 8:00 AM to 1:15 PM. | 1:25 PM |
| San Francisco, CA, Conservatory | 10 million dollars damage due to structural failure, broken windows and plants destroyed. | 4:00 PM |
This is what John Monteverdi, Meteorologist at San Francisco State University, wrote on December 15, 1995 as he introduced a new website dedicated to the December 12, 1995 windstorm: "In case some people had not heard, peak winds in the SF Bay Region included 103 mph on Angel Island (sea level), 85 mph at San Francisco State University (100 ft, 3/4 mile inland) and 139 mph in the Diablo Range east of San Francisco. Rainfall totals included 5.56 at SFSU, 7.54 at Santa Rosa and over 15 inches in Ross. Some evidence of possible wet microburst-related damage in southwestern SF. Most portions of southwestern SF look like a hurricane swept through (of course, you say, these were hurricane force winds)." [Italics mine.] |
California Rainfall Table 12, below, a version of which appeared in the Oakland Tribune, shows the storm total rainfall of the December 1995 winstorm compared to the season total for 1995-96 (which begins on June 1st in California) as of December 12, 1995. The percentages are high, reflecting a very dry autumn up to the time of the big storm. Had the tempest struck at a time of more normal precipitation, then the flood damage from the heavy rainfall totals of Dec 12 would probably have been worse. Original source of the data: AccuWeather. |
|
Last Modified: March 1, 2003 You can reach Wolf via e-mail by clicking here. | Back | |