The Strong Sou'wester of March 25-26, 1971 compiled by Wolf Read |
|
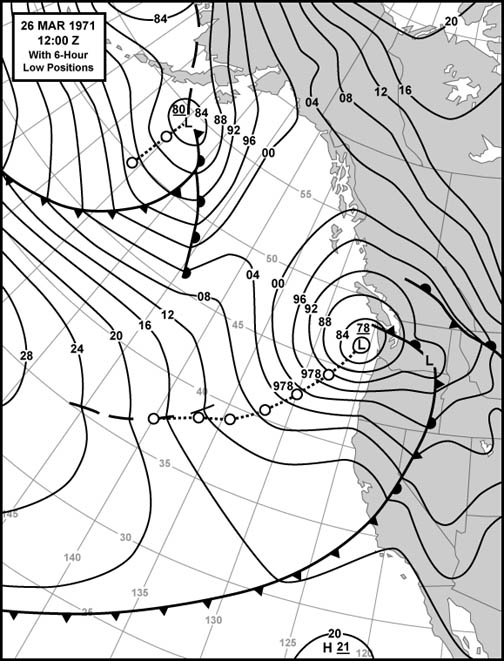
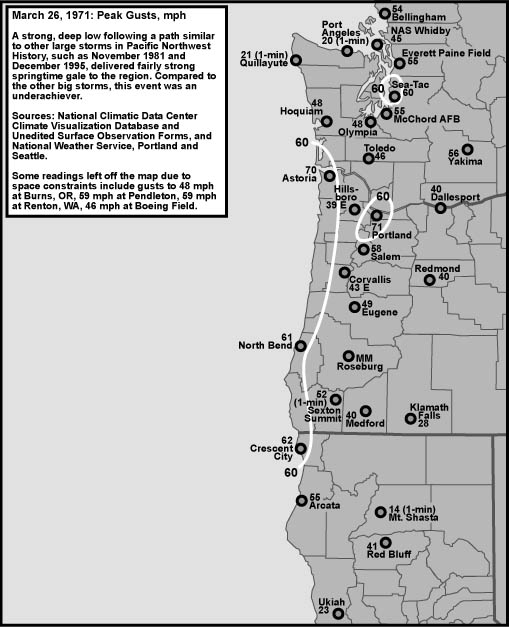
The big sou'wester of March 26, 1971 followed a path similar to the powerful storms of October 26, 1950, October 12, 1962, November 14, 1981 and December 12, 1995. The closest track match appears to be December 1995, yet the 1971 storm was a cut below the 1995 event in peak wind speeds, and singificantly short of the incredible pressure minimums achieved in December of 1995. For comparison of wind strength, if one averages the peak gusts at the 11 key stations listed in the pressure minimum table far below (Table 1), these figures are produced: 80.5 mph for the 1962 "Big Blow", 65.9 for the November 14, 1981 storm, 60.5 for December 12, 1995, 55.4 for October 26, 1950, and 53.9 for March 26, 1971. Of these five big storms, the 1971 event comes in last. But it isn't the weakest example of a windstorm following this path--events like April 14, 1957 have produced lower overall readings (48.8 average). Thus, the strength of this storm shouldn't be underestimated. Wind gusts still reached 71 mph at Portland, and 70 at Astoria, levels that can be quite damaging. With a central pressure of 978 mb as the storm moved northward along the Washington Coast, this event was not as deep as the other four mentioned above. The 1950 event had a minimum central pressure of 970 mb, the Columbus Day Storm of 1962 had a minimum of 960 mb, the November 14, 1981 cyclone reached 958 mb and the incredibly deep December 12, 1995 storm dropped to at least 954 mb. Through the period of record, the lower the intensity of the cyclone, the more commonly it tends to show up along the Pacific Coast. At least two major storms with a central pressure similar to the March 26, 1971 event have occurred in the 1950-to-present period: the October 2, 1967 windstorm that slammed into Western Oregon, and the Inauguration Day storm of 1993 that hammered Western Washington. The reader is encouraged to visit the web pages on these two storms to compare the results of events with similar intensities, but different tracks. Figure 1, below, shows the surface weather conditions over the Northeast Pacific at the time the March 26, 1971 cyclone was nearing landfall on Washington's Olympic Peninsula. This path spared the northwest tip of Washington the high winds dealt out elsewhere in the region. At the time of the surface map, 04:00 PST, tightly packed south-to-north stacked isobars were moving into Oregon, with corresponding elevation in wind speeds. The small secondary low in Eastern Washington is a fature that has shown up in other events, including the Columbus Day Storm. These secondary features typically develop at the point of occlusion along a cyclone's leading frontal boundary. Source: The original map was obtained from the Oregon Climate Service. |
|
General Storm Data Minimum Pressures and Peak Gradients Table 1, below, lists the lowet barometric pressures achieved during the March 26, 1971 storm for 11 Pacific Northwest locations. The readings tell the tale of a cyclone moving in out of the southwest and pouncing upon the region during the night and early morning hours. Some of these pressures are fairly low, with places like Olympia and Astoria showing the lowest readings for any of the March windstorms examined on this website. Source: all pressure data is from the National Climatic Data Center, Unedited Surface Observation Forms. |
|
Table 2, below, lists the maximum pressure gradients achieved during the March 26, 1971 storm for 10 Pacific Northwest measures. These gradients are fairly strong, but none are records. Source: all pressure gradient data is calculated from hourly readings obtained from the National Climatic Data Center, Unedited Surface Observation Forms. |
|
Pressure Tendencies Table 3, below, lists the maximum hourly pressure falls and rises achieved during the March 26, 1971 storm for 11 Pacific Northwest stations. Peak hourly falls of -2.4 to -3.3 mb (-0.07" to -0.10") and climbs of +1.8 to +4.5 mb (+0.05" to +0.13") are fairly standard for big storms in the Pacific Northwest. In fact, this storm's pressure trends were a bit tame compared to many windstorms in history. Source: all pressure gradient data is calculated from hourly readings obtained from the National Climatic Data Center, Unedited Surface Observation Forms. |
| ||||||||||||||||||||||||||||||||||||||||||||||||||||||||||||||||||||||||||||||||||||||||||
Table 3 Notes: [1] The -2.9 mb hourly fall is the last of two occurrences. [2] The -2.4 mb hourly fall is the last of two occurrences. |
Peak Wind and Gust Table 4, below, lists the peak wind and gust for eleven key stations in the Pacific Northwest, their direction, and their time of occurrence. "Peak Wind" is a 1-minute average, and "Peak Gust" is an instant (approximately 1-second) average. By my own personal methodology, a wind event rates the term "windstorm" when the average peak gust of these eleven stations reaches 39.0 mph (gale force) or higher. The March 26, 1971 storm ranked as a high-end moderate windstorm, and came very close to being a major event. Moderate windstorms have an average of 45.0 to 54.9, and major windstorms are those that reach or exceed 55.0. Only a handfull of storms have made the majors, including December 12, 1995, November 14, 1981 and October 12, 1962. This ranking favors those storms that follow a northward path close to the U.S. Pacific Coast, and for good reason--such storms affect the largest land area, and therefore are potentially the most destructive. The March 26, 1971 cyclone followed such a path, with damaging winds striking many points along the way. The March 26, 1971 windstorm struck the Portland area particularly hard, with sustained winds reaching above the peak gusts of lesser storms. The trend toward higher gusts northward in the Willamette Valley is a fairly typical one for the big sou'westers, and is a characteristics used in this study for singling out offshore-trending sou'westers from the Washington-landfall group of storms. Sources: National Climatic Data Center, undedited surface observation forms. |
| Location | Peak |
Direction |
Obs Time of |
Peak |
Direction |
Obs Time of |
| California: | ||||||
| Arcata | 23 |
190º |
00:56 HRS, 26th |
55 |
200º |
22:57 HRS, 25th |
| Oregon: | ||||||
| North Bend | 29 |
200º |
23:58 HRS, 25th |
61 |
190º |
01:03 HRS, 26th |
| Astoria | 39 |
170º |
05:58 HRS, 26th |
70 |
160º |
07:10 HRS, 26th |
| Medford | 29 |
160º |
20:58 HRS, 25th |
40 |
160º |
20:56 HRS, 25th |
| Eugene | 35 |
180º |
01:37 HRS, 26th |
49 |
190º |
01:56 HRS, 26th |
| Salem | 40 |
190º |
06:55 HRS, 26th |
58 |
190º |
03:15 HRS, 26th |
| Portland | 46 |
200º |
04:55 HRS, 26th |
71 |
200º |
04:17 HRS, 26th |
| Washington: | ||||||
| Quillayute [1] | 21 |
250º |
14:57 HRS, 26th |
27 |
250º |
14:57 HRS, 26th |
| Olympia | 35 |
200º |
11:05 HRS, 26th |
48 |
180º |
09:56 HRS, 26th |
| Sea-Tac | 37 |
200º |
11:55 HRS, 26th |
60 |
210º |
11:45 HRS, 26th |
| Bellingham | 29 |
160º |
12:54 HRS, 26th |
54 |
160º |
11:38 HRS, 26th |
| AVERAGE | 33.0 |
191º |
53.9 |
190º |
Table 4 Notes: [1] Wind speeds were too low for gusts to be noted at Quillayute, and a peak of 27 mph was estimated from the highest 1-minute reading using a standard 1.3 gust factor. |
Footnotes 1971 |
References 1971 |
Last Modified: March 2, 2003 You can reach Wolf via e-mail by clicking here. | Back | |