The Devastating Inaugural Day Storm of 1993 compiled by Wolf Read |
|
Introduction According to some accounts, the Inaugural Day storm of 1993 was the most destructive windstorm in Washington State since the great Columbus Day Storm of 1962. The January 20, 1993 storm certainly wreaked havoc. In Washington, many trees and power poles were toppled, forcing the widespread closure of roads. At least 79 homes were destroyed, 581 suffered major damage, and 1,702 experienced minor damage [1]. Power was terminated to about 750,000 customers in the Puget Sound Area. A state of emergency was declared in the cities of Auburn, Bellevue, Normandy Park, Renton and Seattle, and the counties King, Lewis, Snohomish, Thurston and Wahkiakum. Five people were killed in King County: three by falling trees, one by a falling power line, and another of a heart attack while cleaning up debris. The Evergreen Point Floating Bridge suffered $500,000 in damage, and both of the Lake Washington floating bridges were closed due to unusually high waves at the height of the storm. Total losses in Washington from the Inaugural Day storm were estimated at $130 million. This level of destruction certainly puts the storm among the most costly since the Columbus Day storm, which cost about $40 million in 1962 dollars in Washington State (adjusted to 2001, this would be about $400 million) [2, 3]. An argument could be made for the February 13, 1979 windstorm causing a greater economic loss than the 1993 event, mainly due to the catastrophic failure of a single significant structure: the Hood Canal Floating Bridge. The replacement cost for the bridge's missing west end was $143 million in ~1982 dollars [4]. To put the bridge's value in another perspective, the original construction cost of $26,630,000 in ~1961 dollars is equivalent to about 66.5% of the Columbus Day Storm's damage total. And, after the 1979 storm had violently converted the bridge into an expensive pier, the span wasn't reopened for 3.5 years, a major inconvienience for those travelling between the Olympic Peninsula and the Puget Lowlands. By strength of wind, the Inaugural Day storm was generally the most powerful gale to strike the Puget Sound Area since the sweeping tempest of November 14, 1981 and disruptive Thanksgiving Day storm of 1983 [4]. Gusts at Sea-Tac airport reached 67 mph in 1981, 62 mph in 1983 and 64 mph in 1993. At some locations, the 1993 storm produced the highest gusts since the Columbus Day Storm. In fact, in a ranking system that uses peak gusts from six Seattle area stations, the Inaugural Day storm was clearly the strongest since the Big Blow of 1962. And an argument could be made among a select few places for the strongest winds since the powerful October 21, 1934 windtorm--in other words, the highest gusts in nearly 60 years. One of the stations in the latter category was Boeing Field, which experienced a peak gust of 70 mph in the 1993 storm, somewhat higher than the 66 mph produced by the Columbus Day Storm, and not far off of the estimated 75 mph peak gust during the 1934 gale, which produced one of the highest sustained winds ever recorded at the old Seattle Airport--58 mph. The northwest tip of Oregon also suffered a severe strike from the Inaugural Day Storm. Wind gusts reached 98 mph near Tillamook, and may have been higher in the Coast Range, where at least $3 million in trees, mostly old growth, were toppled [6]. The Nehalem River Valley in the northern end of the mountains appears to have been among the places hardest hit, with many homes and vehicles destroyed by the collapsing timber. Power outages were widespread. One power company reported about $1 million in damages to its distribution system. With a central pressure of about 976 mb at landfall, the Inaugural Day storm shares a common intensity with the October 2, 1967 storm that crashed ashore in Western Oregon as a 977 mb system. The March 26, 1971 storm was a 978 mb cyclone as it raced northward off the Washington Coastline and landed on the tip of the Olympic Peninsula. The reader is enouraged to visit the web pages on these storms to compare the results from cyclones of similar intensity. |
General Storm Data Minimum Pressures and Peak Gradients Table 1, below, is a list of the lowest barometric pressures, and time of occurence, from the Inaugural Day windstorm. Though some of the readings for the northern stations are quite low, they aren't even monthly records. A windstorm on literallly the same day in January (the 19th) of 1964 produced barometric minimums that were 0.20" to 0.40" lower, including a reading of 28.56" (967.1 mb) at Tatoosh Island. For comparison, the minimum pressure at the Tatoosh Island C-MAN station was 29.00" (982.0 mb) during the Inaugural Day storm. Source: Microfilm copies of the unedited surface observation forms, obtained from the National Climatic Data Center. And the National Data Buoy Center, historical meteorological data. |
|
Table 2, below, is a list of the maximum pressure gradients, and time of occurrence, for the Inaugural Day storm of 1993. With a few exceptions, these gradients are strong, and some are extreme. In one case the January 20, 1993 storm produced the steepest gradient known--the +15.4 mb reading for the PDX-SEA measure. This reading shattered the long-standing record of +13.6 mb established by the intense November 3, 1958 storm. Conversely, moving one step southward, the peak January 20, 1993 gradient measure for EUG-PDX didn't even approach record levels. The 1993 storm appears to have been very compact, and the Willamette Valley did not fall under the area of steepest gradient--the extreme gradient resided just to the north. This spared the region a major hit. The Inaugural Day storm produced a typical, if but a little forceful, winter's gale for the valley. Considering the low's fairly southern landfall on the Washington coast--roughly over Hoquiam--the fact that the Willamette Valley wasn't exposed to steeper gradients is rather amazing. Storms with similar landfall locations have produced much steeper gradients across Northwest Oregon, such as November 3, 1958 with a EUG-PDX measure of +9.8 mb. The peak PDX-BLI measure for the Inaugeration Day storm was +21.5 mb at 11:00 on Janaury 20th. This amazing value challenged the record for the measure, but fell short of the +22.7 mb gradient produced by the October 21, 1934 windstorm, and would be exceeded within three years by the +22.0 mb reading during the December 12, 1995 event. Source: Microfilm copies of the unedited surface observation forms, obtained from the National Climatic Data Center. |
|
Pressure Tendencies The Inaugural Day storm brought with it a significant "pressure couplet", with very strong pressure surges at stations within about 75 miles of the storm's center. Table 3, below, shows the maximum hourly changes in pressure for a number of stations. The pressure declensions of -2.0 to -4.0 mb (-0.06" to -0.12") per hour are fairly standard for a big storm in the Pacific Northwest. It's the sudden and dramatic rises that are noteworthy. From Astoria northward on the coast, peak rates reached +6.3 to +8.3 mb (+0.19" to +0.25") per hour, and inland from Olympia to Bellingham maximums reached +5.3 to +7.0 mb (+0.16" to +0.21") per hour. Some of these rates are among the highest ever witnessed at their prospective stations. This includes Astoria's +8.0 mb (+0.24"), which was higher than the +7.7 mb (+0.23") achieved by the Columbus Day Storm, and the +6.8 mb (+0.20") by the fast-moving November 15, 1981 cyclone. Sea-Tac's +6.2 mb (+0.183") was also a record--it was slightly higher than the +6.1 mb (+0.180") recorded during the December 22, 1955 storm, and nearly a millibar above the +5.4 mb (+0.16") during the November 3, 1958 windstorm. The Columbus Day Storm's maximum hourly pressure rise was +3.9 mb (+0.12") at Sea-Tac. The +6.3 mb (+0.19") surge at Quillayute is probably the highest in the station's history, which began in 1964. However, examination of Tatoosh Island data for big storms that occurred before the Quillayute station began operation suggests that the Columbus Day Storm was a contender for top pressure surge with a peak hourly climb of +6.2 mb (+0.18"), and that the October 21, 1934 storm could have done better than the 1993 storm at Quillayute as hinted at by the +7.1 mb (+0.21") 1934 climb at Tatoosh. The incredible +7.0 mb (+0.21") hourly jump at Olympia during the Inaugural Day storm was not a record, having fallen short of the amazing +9.8 mb (+0.29") surge during the November 3, 1958 windstorm, but the +7.0 mb 1993 reading was a cut above the +5.4 mb (0.16") maximums for the December 22, 1955 and December 12, 1995 windstorms, as well as the +4.3 mb (+0.13") hourly climb during the Columbus Day Storm. Nor was Hoquiam's +7.1 mb (+0.21") surge a record, it being only about one-half the magnitude of the astounding +13.9 mb (+0.41") hourly surge during the November 3, 1958 storm. |
| ||||||||||||||||||||||||||||||||||||||||||||||||||||||||||||||||||||||||||||||||||||||||||||||||||||||||||||||
Table 3 Notes: [1] The -1.7 mb hourly fall is the last of several (four) occurrences. [2] The -3.0 mb hourly fall is the last of two occurrences. [3] Hourly observations not taken 23:00-05:00, the primary pressure fall phase for this storm. |
Record climbs are only part of the story about the Inaugural Day storm's pressure tendencies. It is also fairly evident that the strongest winds tended to happen in the regions affected by the fastest pressure surges. Exceptions to this were stations that ended up north of the low's center, but were still close enough for some mean pressure swings. Note the significantly lower +3.1 to +3.6 mb (+0.09" to +0.11") surges over the Willamette Valley, where winds were significantly less than places north. Also, all the Willamette Valley stations surged at around the same time, suggesting that peak gradients didn't last long in the region. The idea that wind and pressure-climb magnitudes might be directly related is called the isallobaric effect. The isallobaric effect has generally been discarded as being the primary driver of high winds, for correlations are fairly weak. Maximim pressure changes occurring with peak winds could be a coincidental effect brought about by the storm having to be in a specific (usually close) position to bring about the gale. However, big storms such as the Inaugural Day event suggest that there is probably some relation. According to a 1985 study by John D. Coparanis, the Columbus Day Storm had about twice the isallobaric effect of the November 14, 1981 windstorm [7]--interestingly the difference in peak wind force between the two storms was about the same magnitude (the Columbus Day Storm having gusts twice as strong as the November 14, 1981 event) at many stations. Source: Pressure tendency data was generated via the hourly readings from microfilm copies of the unedited surface observation forms obtained from the National Climatic Data Center. Also, some data are from the National Data Buoy Center, historical meteorological data. |
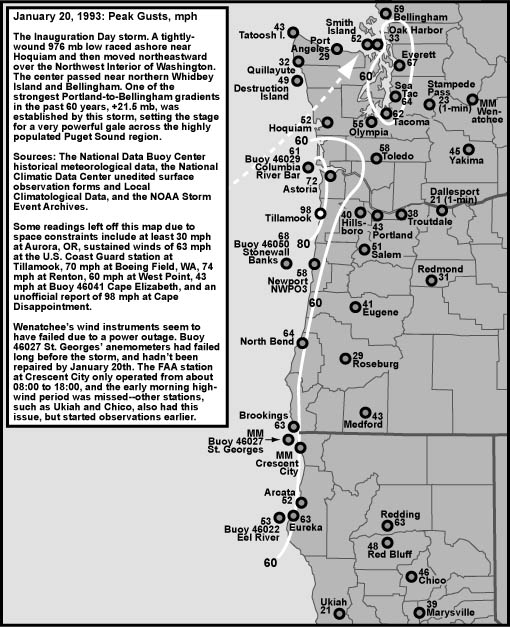
Peak Wind and Gust Table 4, below, lists the peak wind and gust for eleven key stations in the Pacific Northwest, their direction, and their time of occurrence. "Peak Wind" is a 1-minute average, and "Peak Gust" is an instant (approximately 1-second) average. By my own personal methodology, a wind event rates the term "windstorm" when the average peak gust of these eleven stations reaches 39.0 mph (gale force) or higher. The Inaugural Day storm ranked as a high-end moderate windstorm. Moderate windstorms have an average of 45.0 to 54.9, and major windstorms are those that reach or exceed 55.0. Only a handful of storms have made the majors, including December 12, 1995, November 14, 1981 and October 12, 1962. This ranking favors those storms that follow a northward path close to the U.S. Pacific Coast, and for good reason--such storms affect the largest land area, and therefore are potentially the most destructive. The fact that the Inaugural Day storm managed to rate in the 50s while following a non-optimal path for this particular ranking system reflects on the strength of this storm. Despite its compact nature, the 1993 storm was far-reaching down the coast, and scored above other storms that have followed a similar pattern (undercutting Quillayute), such as the December 22, 1955 windstorm with a ranking of 45.8, the December 15, 1977 storm with 46.2, November 15, 1981 with 46.7, the Thanksgiving Day storm of 1983 with 49.9, and the December 27, 2002 minor windstorm with 40.3. It appears that the Inaugural Day storm of 1993 was the most powerful event of its track-class in the 1950-to-present time period. Sources: National Climatic Data Center, undedited surface observation forms, and Local Climatological Data, monthly summary for Medford, January 1993. |
| Location | Peak |
Direction |
Obs Time of |
Peak |
Direction |
Obs Time of |
| California: | ||||||
| Arcata | 35 |
200º |
04:50 HRS, 20th |
52 |
200º |
04:50 HRS, 20th |
| Oregon: | ||||||
| North Bend | 39 |
180º |
04:48 HRS, 20th |
64 |
180º |
03:39 HRS, 20th |
| Astoria | 43 |
180º |
05:57 HRS, 20th |
72 |
200º |
05:54 HRS, 20th |
| Medford | 31 |
140º |
01:00 HRS, 20th |
43 |
140º |
-- |
| Eugene | 25 |
220º |
07:50 HRS, 20th |
41 |
210º |
06:35 HRS, 20th |
| Salem | 25 |
220º |
06:50 HRS, 20th |
51 |
220º |
06:50 HRS, 20th |
| Portland | 28 |
200º |
08:50 HRS, 20th |
43 |
220º |
11:26 HRS, 20th |
| Washington: | ||||||
| Quillayute | 17 |
300º |
09:51 HRS, 20th |
32 |
300º |
09:40 HRS, 20th |
| Olympia | 35 |
200º |
09:54 HRS, 20th |
55 |
210º |
09:43 HRS, 20th |
| Sea-Tac | 41 |
180º |
10:35 HRS, 20th |
64 |
180º |
10:28 HRS, 20th |
| Bellingham | 32 |
150º |
10:50 HRS, 20th |
59 |
180º |
11:22 HRS, 20th |
| AVERAGE | 31.9 |
197º |
52.4 |
204º |
Table 5, below, "zooms-in" on the Puget Sound and North Inland Waters region, and lists peak winds and gusts for stations not present in Table 3. This includes areas hardest hit by the storm. It appears that Oak Harbor was spared for reasons similar to Quillayute--the low's center passed south of the station, or very nearly overhead in the case of Oak Harbor. Smith Island was nailed by the pre-storm southeasterlies, though a decent west-southwest wind pulled in behind the low, gusting as high as 47 mph by 12:00 at the little island, after the passage of what appears to be a fairly vigorous bent-back occlusion. Sources: National Climatic Data Center, undedited surface observation forms. National Data Buoy Center, historical meteorological data. |
| Location | Peak |
Direction |
Obs Time of |
Peak |
Direction |
Obs Time of |
| Puget Sound: | ||||||
| Tacoma | 37 |
200º |
08:45 HRS, 20th |
62 |
190º |
10:45 HRS, 20th |
| Renton | 46 |
160º |
11:45 HRS, 20th |
74 |
180º |
10:40 HRS, 20th |
| Boeing Field | 44 |
170º |
08:45 HRS, 20th |
70 |
190º |
11:45 HRS, 20th |
| West Point | 50 |
195º |
11:00 HRS, 20th |
60 |
195º |
11:00 HRS, 20th |
| Everett | 40 |
190º |
10:45 HRS, 20th |
67 |
190º |
10:45 HRS, 20th |
| North Inland: | ||||||
| Oak Harbor | 17 |
230º |
12:48 HRS, 20th |
33 |
230º |
11:38 HRS, 20th |
| Smith Island | 44 |
141º |
09:00 HRS, 20th |
52 |
141º |
09:00 HRS, 20th |
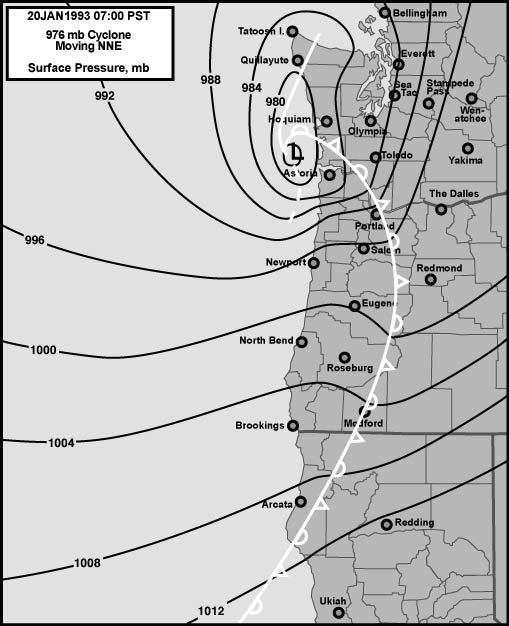
Storm Data Discussion Figure 1, below, is a map depicting the surface pressure conditions and frontal boundaries at 07:00 PST on January 20, 1993. The map is an adaptation from Steenburgh and Mass, 1996 [8]. Of interest is the area of tightest gradient at the base of the low pressure center. The steepest gradient of this storm just skirted the far northwest end of Oregon. Over the next few hours, the low would race northeastward, and the area of steepest gradients would lift along with the rest of the system. This appears to have spared much of Oregon, including the entire Willamette Valley, stronger winds that those evident in Table 4 above. Considering the near hurricane-force gusts that befell the Puget Sound region, this was fortunate for Oregonians. It is important to note that not every storm undertaking a track similar to the Inaugural Day storm spares much of Oregon in the manner shown below. Some storms following such paths have even affected the Willamette Valley more strongly than the Puget Lowlands. Oregon got lucky in 1993, a result that also lowered the Inaugural Day storm's ranking against other big wind events of history, putting the January 20th,1993 gale in 13th place for the time period 1950-2002. |
|
Boeing Field: Strongest Gale in Nearly 60 Years? As mentioned in the introduction, the peak winds at Boeing Field during the Inaugural Day storm appear to have been the strongest since the great October 21, 1934 windstorm, an almost forgotten event that killed at least 22 people, second only to the Columbus Day storm in lethality. Table 6, below, compares the maximum winds measured at Boeing Field (called the "Seattle Airport" in the early days) for some of the big storms in history, ranked by peak average wind--a 1-minute average up to about 1995-96, then a 2-minute average in the following era of ASOS. In the case of matching peak average wind speeds, the storm with the highest gust is ranked above. This comparison ignores any changes in anemometer location, type, and height that may have occurred over the decades. |
| ||||||||||||||||||||||||||||||||||||||||||||||||||||||||||||
In the above table, the peak gust for the October 21, 1934 windstorm was estimated using a standard 1.3 gust factor. No gusts were noted on the surface observation form. The Oregonian on October 22, 1934 reported a peak gust to 70 mph at Seattle, which would be a match for the 1993 storm, but the exact source for this gust in not mentioned. It could be from the downtown Seattle weather office. The sustained winds of 58 mph for the 1934 event haven't even been approached during the 1950-to-present timeframe, not even by the Columbus Day Storm. The Inaugural Day and Columbus Day storms, interestingly, were nearly equal in their impact on Boeing Field. Things were different elsewhere, of course. For example, Renton's peak gust of 74 mph during the Inaugural Day storm was a very high, quite unusual reading, but it fell far short of the 100 mph gust observed during the Columbus Day Storm. The table suggests that wind gusts of 70 mph or more are a very rare event for Boeing Field, with a rough interval of perhaps a half century between events. Evidence that, for the Seattle area, the Inaugural Day storm ranks among the top of the 20th century in strength. There were some earlier storms that may also have produced stronger winds at the Boeing Field site. In the Monthly Weather Review for January 1921, a peak sustained wind of 59 mph was reported for Seattle in the January 29, 1921 storm. This reading is probably from the downtown Seattle office. Sources: Wind data 1934-1995 is from the National Climatic Data Center, unedited surface observation forms, and the years 1999-2002 are from the University of Washington, archived surface observations. |
References [1] This information, and the following details in this introduction to the storm, was obtained online from the NOAA Storm Event Archives, Washington State, January 20, 1993. [2] Columbus Day Storm dollar damage for Washington is from "The Big Blow," Lucia, E., p 64. [3] The dollar adjustment is based on Brooks, H. E., and Doswell, C. A. III. "Normalized damage from major tornadoes in the United States: 1890-1999." May 12, 2000 and September 7, 2000. Weather and Forecasting, Vol 16, p 168. The method of using GNP and Consumer Price Index presented in this paper is employed here, and in other parts of this website. [4] Replacement cost, and other details, for the Hood Canal Floating Bridge was obtained from the Washington State Department of Transportation web page, "Hood Canal Bridge History." [5] Wind speeds for the various storms in this paragraph were obtained from the National Climatic Data Center, unedited surface observation forms. [6] This information, and the following details in this introduction to the storm, was obtained online from the NOAA Storm Event Archives, Oregon State, January 19-20, 1993. [7] Coparanis, D. John, "Cyclogenic bombs as they affect Oregon," National Weather Service, Portland, document, January 1985. [8] Steenburgh, W. James, and Mass, Clifford F., "Interaction of an intense Extratropical Cyclone with Coastal Orography," Monthly Weather Review, July 1996, Vol 124, pp 1329-1352. |
Last Modified: March 5, 2003 You can reach Wolf via e-mail by clicking here. | Back | |