Pressure Gradients, Storm Tracks
and by Wolf Read |
| There is a pressure gradient when two locations show a difference in barometric readings. The strength of the gradient is the difference in pressure between the two stations. Figure 1, below, shows some of the standard measures of pressure gradient in the Pacific Northwest. This is by no means all--a measure of gradient can be established between any two locations that have barometers. The gradient lines shown are strictly along a south-north axis, the critical direction when measuring the potential for high winds in most windstorms. West-east gradients can be important, too, especially measures from Portland to The Dalles, which can determine the strength of easterly and westerly winds through the Columbia River Gorge. |
|
Two graphs included in the figure show a light-wind and strong-wind scenario for the Pacific Coast. It is useful to imagine the line drawn between the pressure readings for each station as a track. Set a virtual ball at the high end of the track, and allow it to roll "downhill". The steeper the angle, the faster the ball accelerates, and the faster the ball will move against the forces of friction, which would act to stabilize the rate of travel at some point (terminal velocity), if the ramp were long enough. The units used to report gradient are millibars, abbreviated mb, which are close to being thousandth-units of one standard atmosphere. Sometimes, "atmosphere" is also referred to as a "bar." For converting to English measure, one millibar is about 0.02953 inches. Pressure readings from the south are typically subtracted from those to the north. This yields positive numbers ("positive gradient") when a gradient is produced by higher pressure over southern stations, and a lower pressure over the north lands, which creates southerly winds--the scenario that is typically found during Pacific Northwest windstorms. Negative numbers ("negative gradient") imply higher pressure over the northern stations, and, generally, north winds result. In terms of actual numbers, for the coast, a positive gradient between OTH and UIL of 9-12 mb can generate strong winds of 30-45 mph, provided other conditions are present, such as a fairly progressive storm, and/or strong winds are flowing in the middle-levels of the atmosphere, say at the 850 to 700 mb level (about 5,000-8,000 feet). The 9-12 range is, roughly, a minimum gradient for high winds along the beaches. Gradients of 18-24 mb are typically seen during moderate to strong windstorms with wind gusts up into to 50-70 mph range along headlands. And the major windstorms, such as the Columbus Day Storm which threw 120-140 mph winds ashore in Oregon, produce gradients as high as 25-30 mb, and even higher. Inland, for the EUG to PDX measure, a positive gradient of 1.0-3.0 mb is often seen during the average winter storm with blustery winds in the 15-30 mph range. Gradients of 3.1-6.0 mb can result in moderate to strong windstorms, with winds of 25-40 mph, sometimes 30-50 mph. Occasionally, quite damaging winds accompany storms at the low end of this gradient range, such as on February 24, 1961, when prefrontal southerly winds elevated to 54 mph gusting to 72 at Eugene, with a maximum gradient of a mere 3.3 mb. It seems that, in this case, there was a fast low-to-mid level jetstream supporting the front, and this mixed down to the surface in the Eugene area. The unusually strong winds were local: Salem and Portland had peak gusts to 31 and 36 respectively, much more typical of level of gradient on that day. The major windstorms, with winds of 40-60 mph and higher, such as Columbus Day 1962, tend to produce gradients of 8.0-11.0 mb between EUG and PDX. A max gradient of 9.0-10.0 mb is a fairly consistent occurrence during the big storms, turning up in almost every major event, and is here referred to as the "sweet spot." Because of similar distances between the stations, gradient categories for MDF-EUG, PDX-SEA and SEA-BLI have similar ranges, if but a millibar to two up or down, due to some variance in the straight-line distance between the different measures. As suggested by the February 24, 1961 whole gale at Eugene, steep gradient isn't the only feature that can contribute to high winds in synoptic-scale storms. Other factors, which are present to varying degrees in the big cyclones, also aid the development of high winds. Storms that move slowly don't tend to produce winds as strong as those that progress quickly. This has to do, in part, with the fact that the speed of the entire system adds to surface wind velocity, provided the storm is moving in the right direction (see below). Upper air conditions, as mentioned before, play a big part. Often, strong gusts at the surface are the result of turbulence mixing down winds from the lower to middle atmosphere. If airflow is not that strong upstairs, then there's little to give the surface flow an extra boost. Winds at the 850 mb level typically have to be at least 45-65 knots for damaging gusts to result at the surface. "Surface flow," by the way, is typically defined as the wind conditions below about 3,000 feet, but this can vary depending on the average height of local terrain features. The actual orientation of the gradient with respect to local geography is important. Just because the gradient measure is on a south-north axis doesn't mean that the pressure fields, as delineated by isobaric lines (more on isobars immediately below), are arranged perfectly perpendicular to that axis. When the axis of gradient isn't south to north in the Pacific Northwest, surface winds tend to be reduced. This has to do, in part, with the south-to-north trending mountain ranges. The coastal and inland mountains act as a sort of "mega-funnel" for air flowing along the south-to-north axis at the surface. Wind has a tendency to "follow the gradient" in a storm out to sea, where there aren't very large barriers to airflow. Following-the-gradient means that airflow generally moves along, or follows, areas of equal pressure. On weather maps, these areas of equal pressure are often drawn as roughly circular lines, called isobars, around the low pressure center, and are typically delineated in millibars. The airflow has a slight curvature toward the low pressure center, but this is minor. Airflow that follows the gradient is also called geostrophic wind. When a low nears shore, as in Figure 2, below, the isobars start to cut across mountain ranges, and the airflow following the isobars is impeded by the terrain. If a low moves ashore along the Olympic Peninsula of Washington, the isobars stack up nearly perpendicular to the axis of the mountain ranges south of the center. Surface wind, in response to the imbalance created by the lower pressure to the north, will flow northward though the valleys toward the low center. In essence, this airflow is moving about 90° from the typical path of wind in a storm out to sea. The air is flowing across the gradient lines. This is called "jumping the gradient," or ageostrophic wind. The scenario just presented is the perfect one. More typically, the isobars are not stacked exactly perpendicular along the mountain ranges, but have a tilt, usually southeast to northwest ahead of a system moving in from the southwest. This results in a southeast airflow at the surface that is impeded somewhat by terrain, and therefore the gradient does not achieve its highest potential wind velocity. Southwest winds are typically produced by tilts of a northwest to southeast direction found in the southwest quadrant of the low. With offshore lows, the isobars can parallel the mountain ranges--in this instance, airflow moves westward (an east wind), and tends to pour through mountain gaps like the Columbia River Gorge. Valley locations not downwind of these gaps usually experience light winds at these times, whereas places that are exposed, like Portland, tend to get strong east winds ahead of incoming cyclones. |
|
| During the landfall of a small, but intense, cyclone on February 7, 2002, a gradient of 10 mb between EUG and PDX resulted--this was a half millibar higher than the gradient produced by the Columbus Day Storm, which kicked up gusts as high as 116 mph in Portland. However, winds at Portland only reached 31 mph during the 2002 storm. What happened? The 2002 event demonstrates a resolution limitation with standard gradient measures. As shown in the hypothetical scenarios depicted in Figure 3, below, a low center can pass close to, but still south of, a northern station, and yield a strong positive gradient. The low's exact position is "hidden" by the rough resolution of official stations. The fact that the northern station is actually in the north sector of the low can be revealed by noting winds, which are typically light and northerly, which brings the discussion to storm tracks. |
|
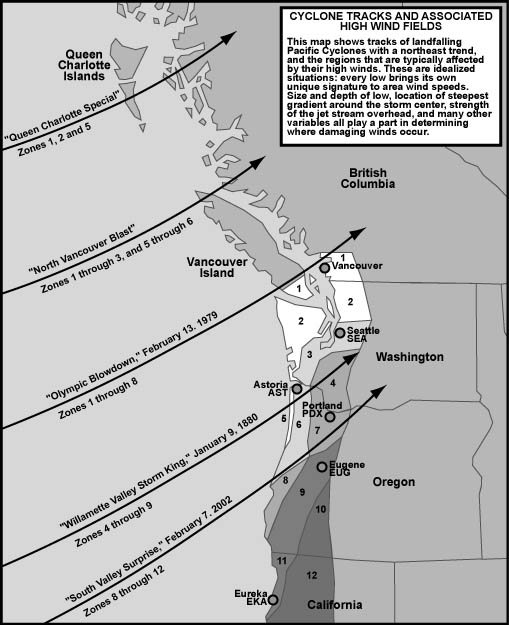
Storm Tracks The path that a cyclone follows strongly determines where the storm's damaging winds will occur. Indeed, a low's track can have a larger effect on wind velocity at a particular location than pressure gradient. Because of this fact, two broad categories of storms result from the paths that they follow: 1) land-falling systems, which tend to have their high winds confined to an area equivalent to part of a state, and 2) recurving systems that skirt the coast, which can strongly affect several states. Pacific cyclones have made direct landfalls on every part of the Pacific Northwest coast. With a land-falling low, the strongest winds are usually more localized, and are confined to the south side of the low's track. Figure 4, below, plots five idealized tracks that northeast-tracking cyclones can take. The Northwest is broken down into 12 wind zones. Zones typically affected by damaging winds when an intense cyclone follows a path similar to the ones illustrated are indicated under the track. When a representative storm from history roughly meets the characteristics of one of the paths, and is detailes on another webpage, then it is listed above the track. Storm names are either pulled from history, such as "Storm King" and "Olympic Blowdown," or from a hat. |
|
The highest winds tend to follow the south side of a landfalling low, and, as discussed above, are typically from a south direction, often from 170° to 210°, that carries the air approximately toward the low's center. The immediate south quadrants are usually the area of steepest gradient. For very intense systems, this often does not extend beyond 50 to 100 miles from the center. Outside that range, winds decrease markedly, though areas favored for high winds due to unique topography can still get a heavy blast. Gradients are often less steep north of the low, and generally do not produce a damaging north gale. This goes beyond a shallower gradient. There's typically a lack of upper-air jet support for north winds. Also, cyclones often have a north component to their motion, and this speed is subtracted from surface airflow. For example, if a low is tracking northeast at 40 mph, its northward vector is about 28 mph (with a west vector also of 28 mph). That 28 mph subtracts from the average windspeed in the north sector. If the gradient, and other conditions, are present for a sustained 40 mph gale, the 28 mph north vector reduces southward-trending airflow (north winds) to a mere 12 mph. However, on the south side of the low, the storm's northward vector of motion is added to the northward-moving airflow (south winds), making 40 mph potentially 68! Generally speaking, the further north the cyclone's path, the more often it is traveled. Landfalls from North Vancouver Island to the Queen Charlottes are winter's normal progeny, and happen every year, often many times. Though these two classes of storms can produce a good winter gale in Western Washington, and sometimes in Oregon, especially along the coastline, the winds don't often reach the extreme range of interest. For these reasons, no such storm is examined in this volume. The reader is encouraged to watch these cold high-latitude lows unfold during the Northwest's winter season. This will reveal plenty of information on these events. However, keep in mind that the south-of-the-track rule for high winds applies even to a "Queen Charlotte special"; for parts of the British Columbia Coast and Vancouver Island, these storms can and do produce very fast winds. Landfalls from central Vancouver Island southward tend to beget windstorms in the region examined on this webstie, and this is where webpages on specific storm types exist. Depending on just how the low tracks, various regions are affected severely, while others are spared. Storms landing in lower Vancouver Island tend to produce blustery winds in all regions, as the entire area falls south of the low's track, and damaging winds in the northern zones. As the track is moved ever further south, the area of damaging south winds goes with it, and the number of map zones that experience strong winds decreases. However, other events happen on the low's north side: often intense rain and/or snow, especially for regions to the northeast of the low, and blustery west to northwest winds, which can yield near-blizzard conditions. This combination of features, and the regions affected by them, can be used to define the specific classes of landfalling windstorms listed on the map: Olympic Blowdown, Storm King, South Valley Surprise. The recurving class of windstorm is not depicted on the map, for reasons of visual clarity. This does not mean they are of lesser importance. The opposite is probably true. When conditions are right, these storms tend to develop between 130-160° west longitude, and 35-40° north latitude. Cyclogenesis can be very rapid. Typically, the bombing disturbance moves east to east-northeast toward the western United States. Far ahead of these vast systems, air starts to jump the gradient among the mountainous terrain of western North America. Airflow down the valleys, which draws from higher pressure fields to the south, is itself a developing tongue of high pressure at the surface. This zone of high pressure often shoots northward at enough of a clip to act as a block to the storm, and force a northward curve to the low's path. To borrow a hurricane term, the cyclone is forced to "recurve." Most deep lows--even land-falling ones--have a tendency to undertake some level of curve northward as they near shore. A select few, however, bend their paths enough to move roughly parallel the coastline-here termed the recurving lows. When a "recurver" happens while the low center is east of about 130° west longitude, a severe blow can be carried across northern California, western Oregon and Washington (sometimes the whole states), and southern British Columbia. This is especially the case when a cyclone races just a short distance offshore, such as with the Columbus Day Storm of 1962. Because recurvers tend to affect a large region, they also tend to cause the most property damage. These major sou'westers have been given a number of names throughout history, including these book and news media titles: West Coast Disaster, Big Blow and Big Blast. The "Big Three" covered extensively on this website, October 1962, November 1981, and December 1995, are of the recurving type, though the latter one made landfall on Washington's Olympic Peninsula. To pin a specific, yet arbitrary, figure on this kind of windstorm, the track must be oriented between 0 and 35 degrees for at least three hours, and the low center must stay offshore at least to the latitude of Seattle, about 47.5° north, with a landfall on Vancouver Island preferred. By these terms, December 1995 is a marginal recurver, and almost classes as an Olympic Blowdown direct landfall-type system. The size of a cyclone also factors into how large an area it will affect. The Big Three were all titanic cyclones, with intense frontal systems that reached far from the parent low centers, and stretched deep into the western United States as the lows raced northward. More compact systems that follow similar tracks wouldn't yield the same kind of results. The Columbus Day "Big Blow", though it is grouped with these recurving events and is the most intense example, is too unique to be considered the archetype of this class. Arguments can be made (and have been) that place the 1962 tempest in a grouping all its own. The November 14, 1981 windstorm is probably a better "typical" example, if one is to be had. |
Cyclone Quadrants Because of the way air swings around a cyclone it can be useful to divide a cyclone into four quadrants: NW, NE, SE and SW, as depicted in Figure 5, below. This can help with the understanding of local wind conditions during a storm. The reported wind directions are for land-based locations. |
|
Northwest Quadrant NNW to WNW winds, cool to cold, sometimes with lowland snowfall, sleet, hail, especially along bent-back occlusion. How much frozen precipitation depends, in part, on the time of year the storm strikes. Northeast Quadrant NE to SE winds, usually light, but can be strong at mountain passes. Cool, sometimes cold around river drainages, which allow frigid, dry air from east of the Cascades to trickle westward. Increasing precipitation from "over-the-shoulder" moisture as low approaches, usually light rain, though can be snow in places, and can get heavy near along the frontal boundary. Southeast Quadrant SE to S winds, sometimes very strong and damaging, warm, as warmer air fields are advected northward in this sector of the storm. Precipitation, almost always rain up to fairly high elevations, can be heavy under ideal low-level jet conditions, especially on SW to S facing mountain slopes. Southwest Quadrant Usually W to SW winds, mild, often with gusty post-frontal showers which can be intense. Damaging S-SSW winds can occur immdiately south of the low center for land-based stations, when cyclone is strong. In the right gradient conditions, a W to SW-erly high wind event can also occur in this quadrant, a considerable time after the low has passed--this is not uncommon for the Puget Lowlands region. The "NW Jump" Signature on Meteograms Another way to look at conditions south and north of a low's track is depicted in Figure 6, below. The key signature for a station that ends up north of a low's track is the wind shift from NE to NW, which makes a sharp jump on the wind direction trace in the meteograms. For a station south of the low's center, a wind shift from SE to SW is typical, which makes a more gradual climb on a meteogram's wind direction trace. |
|
Last Modified: December 5, 2008 You can reach Wolf via e-mail by clicking here. | Back | |