|
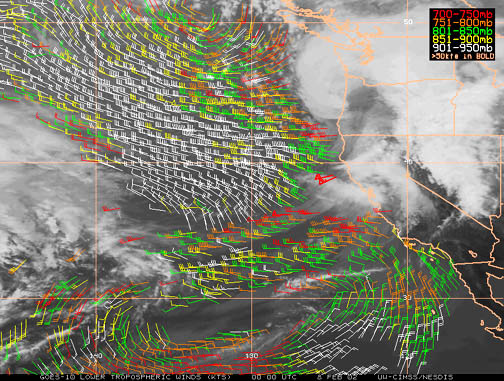
The February 7, 2002 compiled by Wolf Read The satellite photo below is courtesy of the PacJet progam of NOAA, and shows the center of the cyclone moving into the Willamette Valley at 00:00 UTC (16:00 PST). |
|
|
|
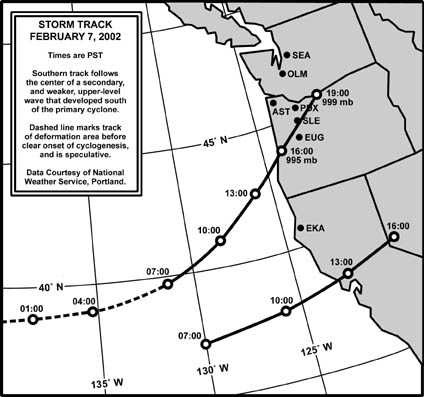
Profile of a Sudden Windstorm As the blue light of dawn spread over the Pacific Northwest on February 7, 2002, a weak low began to spin up off of northern California near the 40° north latitude line around 131° west. Moisture ahead of the system raced northeastward into Oregon and California, with light to moderate rain falling in the Willamette Valley. As the first synopsis of the day shows, the worst-case forecast was for a weak low to dive onto the central Oregon coast [1]:
With hindsight, it is interesting to note that there's no mention of the possibility of any strong winds on the Oregon coast, let alone the interior. No high wind watches had been posted anywhere in Oregon by 07:39 PST. By 12:15 PST, the low center had enhanced and moved northeast to about 42° north and 128° west; still over a hundred miles off of the Oregon-California line. The cyclone had a classic comma form, with high clouds sweeping in a beautiful arc across Washington, Oregon and northern California. Doppler radar showed rain intensifying in the Willamette Valley, especially in the south and moving north. Still no high wind watches on the coast or interior--only a heavy surf advisory had been posted for swells ranging from 20-25 feet. My gut feeling by this time was different from the forecast. I had seen that kind of classic comma-shaped cyclone in satellite photos many times before. In my journal, I noted:
As the journal entry indicates, I wasn't convinced at the time either, but was entertaining a high wind possibility. My concern wasn't about whether the low would be strong--it already seemed that to me, but how the cyclone would track. The center was already very close to the coast, and it seemed like it would more likely dive in to the south, as opposed to shoot straight north just offshore. However, the latter scenario had happened before, in a very sudden turn on March 16, 1984, so this storm chaser wasn't about to give up. By 13:00, the storm center, still offshore, had crossed inside the track followed by the great Columbus Day Storm of 1962. This put the center of the 2002 low closer to the coast than the greatest of 20th century windstorms. At 13:50 PST, I simply noted: "29.69 FR!!!" That barometric drop, about 0.08" in an hour, was one of the fastest I'd seen. The few storms where I had witnessed a similar rate of fall included the November 24, 1983 windstorm, which reached 0.10" an hour at times at my former Renton, Washington home. Pressure drops ahead of the Big Three (Columbus Day 1962, November 1981 and December 1995) were typically in the range of 0.10" to 0.15" an hour. The rapidly falling barometer on February 7th was nearly equivalent to the major southwesters of the past. The possibility of significant wind seemed increasingly likely. Unknown to me at the time, the National Weather Service, Medford, issued this high wind warning just 34 minutes before my journal entry:
This above forecast was the first significant indicator that the storm was growing into a beast much more potent than originally forecast. As it would turn out, even a 70 mph gust potential for the headlands would fall short. At 14:30 PST, the new forecast discussions were out:
About a month later, I had a conversation about this prognostication with Richard Halter, one of the founders of the Oregon Tornado Chasers Society, and a person who's knowledgeable about severe storms. He commented, "There's something funny about that forecast." When I asked, "What?" he replied to the effect of, "There's no indication that 80-mph-plus winds would slam into the Southwest Oregon coast and South Willamette Valley in the next two hours." Indeed. |
|
|
|
Perhaps the first clear sign of trouble occurred at the very exposed site of Cape Arago. The National Data Buoy Center operates a C-MAN station at the light house. At 14:00, 2-minute winds were a mere 9 mph with a 5-second gust to 20 at 13:41, these readings generally out of the SE. After some data interruptions for much of the next hour, a 2-minute average wind speed of 44 mph was reported at 14:50, no direction or gust indicated. Bursts were probably reaching 60 mph at this time. Over the next 20 minutes, the storm struck with full force. The 15:10 observation shows wind speeds appropriate for a Category-1 hurricane: 2-minute winds of 75 mph with a 5-second gust to 93 at 15:09, both observations showing a wind direction of 248º. One-minute wind speeds probably approached 80 mph at this time, with instant (1-sec) gusts around 110! Interpretation of satellite photos and surface observational data puts the center of the cyclone due north of Cape Arago, by approximately 30 to 40 miles, at the time of maximum winds. After the Aeolian barrage, winds diminished rapidly as the low moved ashore in the vicinity of Cape Perpetua, and by 16:00 two-minute speeds had lowered to 52 mph out of 254º, with 5-second gusts around 58. At this time, the barometer also indicated a very rapid rise, a pressure surge: The pressure leaped from 994.3 mb (29.36") at 15:00 to 1007.4 mb (29.75") by 16:00, an incredible change of 13.1 mb (0.38") in one hour. This extreme barometric dance would prove to be a key storm signature at many stations in western Oregon. At about 16:00 PST, the water vapor satellite photo showed the low center moving inland along the border of Lane and Lincoln Counties. At 15:54 PST, the ASOS at North Bend showed a wind gust to 53 mph out of 210°, and a barometer at 29.44"--this would be the last report from the station for many hours; apparently the winds knocked out power and terminated the ASOS reports. The high wind warning issued by Medford at 13:16 PST covered the North Bend area, so folks living in the region had a chance to respond before the storm struck. But the 70-mph-gust warning for the headlands was low: aside from the wrenching gusts at Cape Arago, winds reached 84 mph at Gold Beach, and 88 mph at Bandon, indications that this storm had become more than the most extreme case anticipated by forecasters. Also at 15:54, Eugene's Mahlon Sweet Airport reported the first indication that something unusual encroached inland: winds rushed at 17 mph and gusting to 35 out of 120°, with the barometer continuing to fall rapidly at 29.44". The wind speeds were not exactly powerful, except when the direction is taken into consideration. At Eugene, where the general north-south orientation of the surrounding ranges tend to limit winds from the east, ESE gusts into the mid-30s were quite unusual, and a clear indication of trouble: The compact storm had begun to overcome typical geographic barriers. And, just an hour before, the wind had been dead calm at Eugene. A very ominous sign. During this time period, I noted:
Roseburg Regional Airport, some 68 straight-line miles south of Eugene, reported a sharp increase in winds at 15:53 PST, with 14 mph gusting to 26 out of 220°. Before the next hour was up, the winds would peak at 39 mph, with local spotters ranging from 30 to 41 mph. The temperature had risen to 49° F by the reporting time. The lowest pressure reading out of Roseburg occurred the hour before at 14:53, with 1002.0 mb (29.59"), having dropped just a millibar in the past hour, a considerable reduction in declension rates of about 2.0 to 2.5 mb/hr during the previous four hours. Returning to the 15:53 observation, the pressure had jumped 4.3 mb to 1006.3 mb (29.72") over the past hour. Clearly, a strong frontal system had swept through the region. At the same time that the Roseburg station revealed a pressure surge, Eugene Mahlon Sweet Field reported its lowest sea-level pressure for the storm: 997.1 mb (29.44"). An incredible pressure gradient of +9.4 mb (+0.28") had developed between these two stations. The regular observation at 15:53 would be the last one to contain pressure readings at Roseburg--likely the storm had disrupted the barometer. The station would not resume reporting pressure until 08:53 on the 8th. This is a sad fact, for the lack of information prevents calculating the gradient between Roseburg and Eugene during some critical hours, especially 17:00 to 18:00. Like Roseburg, both Arcata (ACV) and North Bend (OTH) produced some interesting pressure reports during the 16:00 timeframe. The gradient had increased to +18.9 millibars between the two locations. With a separation of about 193 straight-line miles, this factors into a steep 0.1 millibar per mile, which agrees well with the Roseburg-Eugene pressure differential. Such a strong gradient is rare for that stretch of coast [footnote 1]: it was a clear warning that this low was something more than a typical winter's progeny. As it turned out, much closer to the low's center, the slope was even steeper, by at least a factor of two. The gradient north of Coos Bay remained negative, and not anywhere near as steep as regions south: -5.8 mb OTH to Astoria. This, in part, shielded Oregon's central and northern coast from strong winds. |
|
|
|
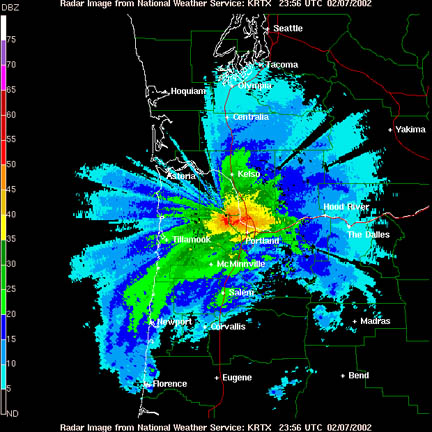
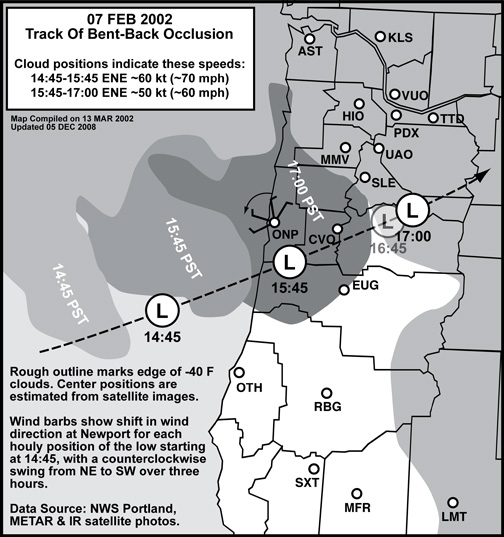
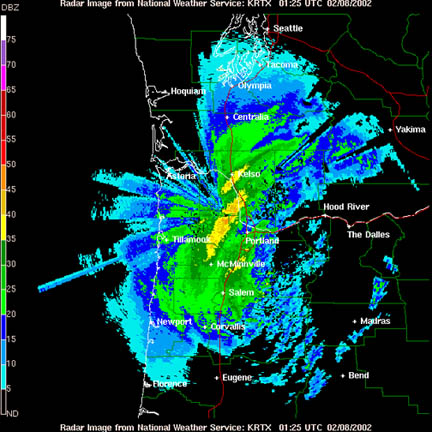
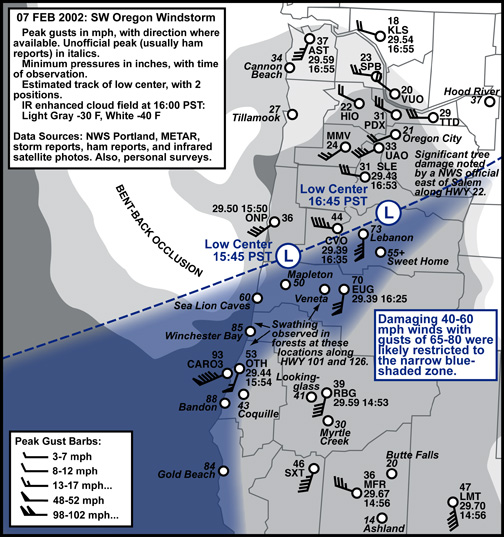
By 16:00 PST, radar imagery showed clearly that the northern section of the cyclone's occlusion had passed north of my home, and was dumping heavy rain across the immediate Portland area, and in Vancouver, causing mayhem for the evening commute (above image, radar at 15:56 PST). A strong, but small dry slot at the low's center--essentially the "eye" of the storm--showed up clearly on the water vapor image at this time, sitting right over the central Willamette Valley. At 16:05, ESE winds continued at Eugene Mahlon Sweet Field, with a relatively benign speed of 18 mph gusting 23. The temperature stood at 46ºF. By 16:10, winds at Eugene had shifted to 170º and increased to 29 mph gusting 40, the first direct indication that trouble had arrived. In just five minutes, by 16:15, winds continued out of 170º and had climbed to a potentially damaging 40 mph gusting 55. Branches and trees had likely begun to crash ground-ward by this time. The air had also warmed considerably, with the temperature up to 52ºF, a mark that the tempest's warm-sector had infiltrated Eugene. The heart of the storm had arrived. Around 16:14 PST, the northwest curve of the cyclone's bent-back occlusion just showed on the Doppler radar, arcing over the Coast Range. The low moved quite fast, around 70 mph over-sea and slowing somewhat to 60 mph upon landfall, based on measurement from satellite photos. The map below shows the hourly positions of the coldest cloud tops that marked the storm's bent-back occlusion, and estimates of the location of the surface low center. |
|
|
|
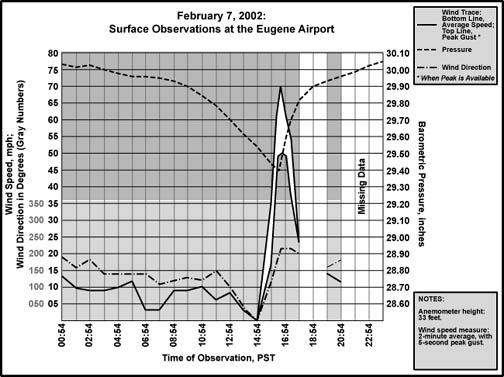
This brings the timeline to 16:25 PST. As the cyclone's center tracked across Benton County from SW to NE, winds at Mahlon Sweet Field now roared out of 180°, and had reached a punishing two-minute average velocity of 52 mph with a gust to 61. The temperature, 50°F, indicated a downward trend. And the atmospheric pressure had reached its low point with a reading of 29.39" (this is the altimeter setting: sea-level pressure is only reported each hour in the standard observations). Interpretation of satellite imagery and surface observational data puts the low center due north of Eugene and nearly on top of Corvallis in this timeframe. Eugene, now in ground zero of the cyclone's most powerful winds, still had no high wind warning. Around the time of that stunning weather observation from Eugene, but before I had seen the data, I noted: "Very light rain mist, 0.54" in gauge. Baro is at 29.50" and falling." The pressure was still dropping as fast as, if not faster than, than any plummet I had seen before. Precipitation had diminished as the dry slot slid into my location, and the wind remained light. Friend, and science fiction author Jerry Oltion, who lives in Eugene, wrote to me about the gale:
At 16:30 Eugene's forecast had been updated to include south winds of 25 to 35 mph with gusts to 50. This despite two-minute winds already in excess of 50 mph at the Eugene airport, with gusts above 60! Skywarn spotter Lane 1 in Junction City, about 8 miles north of the Eugene Airport, delivered this report at 16:31 PST: "10-inch diameter tree down due to strong winds." Four minutes later, this official message followed:
This warning was issued a full twenty minutes after two-minute winds had reached high-wind-warning criteria of 40 mph, and ten minutes after Eugene reported being pounded with gusts higher than those forecast in the warning. A 16:40 report from Eugene Mahlon Sweet Field indicated winds out of 190º with the two-minute average at an incredible 58 mph and 5-second gust up to a punishing 70. To put this gust in perspective: During the eleven years 1995-2006 that official automated stations were reporting 5-second averages for gusts, not a single Willamette Valley station reported a gust even close to this magnitude. Indeed, the next fastest gust of 62 mph occurred at Portland during the great December 12, 1995 windstorm. Also, a 5-second average tends to smooth out the short-period spikes often present in wind: 70 mph indicates that instantaneous wind speeds may have exceeded 80 mph at Eugene. During the infamous Columbus Day Storm of 1962, Eugene experienced peak 1-minute winds of 63 mph with a peak instant gust of 86. In essence, by 16:40 on February 7, 2002, winds in the south Valley approached the force of one of the most powerful windstorms in the history of the region. Soon, in areas further north, from Junction City, Halsey and Albany, and eastward to Brownsville, Lebanon and Sweet Home, unofficial gusts of equal and possibly even stronger magnitude would snap trees, yank roofs from farm structures, and topple lines of utility poles, devastating the region's power and telephone grid. But strong winds were not the only surprise for Oregon residents and weather forecasters alike. This storm had many tricks. And the pace of events accelerated as the cyclone raced across the valley. The Portland Metro area received this statement, complements of the heavy rains from the northward moving occlusion, at the same time that the south valley got the high wind warning:
A school teacher in Pleasant Hill reported trees down around Jefferson High School at 16:47. In Eugene, a report of a tree on a house was delivered by the public at 16:50. At 16:54 PST, Eugene reported two-minute winds of 46 mph with gusts to 58, now out of 220°, a significant wind shift. A report just two minutes later showed winds of 49 mph and gusting to 62. These speeds are potentially very damaging. As amazing as the winds were, an even more astonishing sight was the barometer at 16:56 PST: 29.59" and rising rapidly. The word "rapidly" does not quite cover the situation. Eugene experienced a pressure rise akin to that of a fast-moving hurricane. A rapid rise for northwest locations is typically 0.06-0.15" an hour, more rarely 0.18-0.30" an hour. The former category of rises are often seen in the big windstorms, like in November 1981 and December 1995, and the latter category was experienced in many places during the Columbus Day Storm. On February 7, 2002, Eugene received a jump of 0.19" in just 32 minutes! Eye-popping might be a more appropriate term for this barometric-pressure ascent! That rate would continue, along with the winds. |
|
|
|
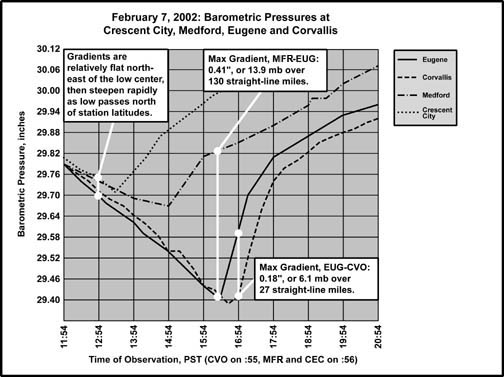
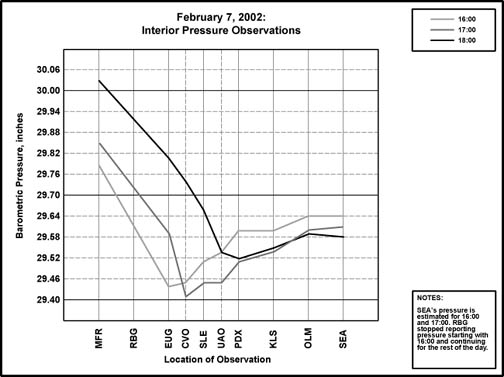
The rapid pressure rise at Eugene nevertheless fell short of what happened at North Bend in the 16:00 to 17:00 timeframe. As mentioned, transmissions from the ASOS station were knocked out, but fortunately, hourly records were still being kept by hand at the location, making a nice supplement to the automated reports. The pressure during the 15:54 observation read 29.44". At 16:52, the barometer indicated 29.86", a jump of 0.42" in an hour! This appears to be the 2nd fastest hourly pressure rise in the record for any station in the Pacific Northwest. The fastest is held by the intense November 9-10, 1975 cyclone, which produced a surge of 0.49" in one hour, also at North Bend. Some close events include 0.41" at Hoquiam, Washington, during the November 3, 1958 windstorm, and 0.34" at Portland, Oregon, during the great January 9, 1880 "Storm King." The figure below depicts three surface pressure cross-sections of the cyclone as it moved into the Willamette Valley. The stations are arranged south-to-north going left to right, and are separated on a scale relative to their approximate distances from each other. As the low moved northeast, strong high pressure pushed up from the south, making the extremely steep and tall slope over the middle of Oregon. The 16:00 and 17:00 slices show the steep gradients around the low center very nicely over the Willamette Valley. Even the north gradient was quite strong from CVO to PDX, but upper air flow was not conducive to strong north winds in this region. Stations north of PDX were in a generally flatter region of low pressure with a negative slope--in essence a trough that moved inland north of the storm--that resulted in very light north winds. |
|
|
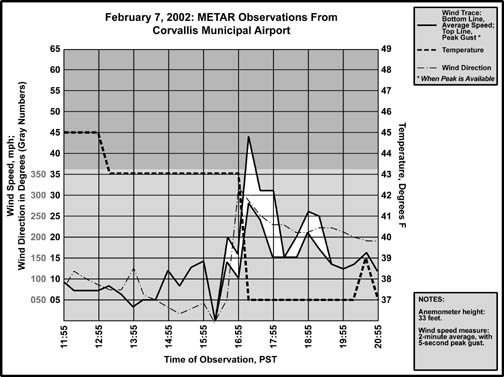
| At 16:55, the AWOS system at the Corvallis Airport, just 27 straight-line miles north of Eugene Mahlon Sweet Field, reported winds of 10 mph, gusting to 16, out of 320°. That's a difference of 22 times in peak wind force between Corvallis and Eugene! This marks an amazing contrast over such a small distance, the result of Corvallis being nearly under the low's center. This was not the only contrast, however. The barometer had just begun to rise from a low of 29.39" at 16:35 to 29.41". This made a difference of about 0.18" between Eugene and Corvallis, or 6 millibars over 27 miles. If this angle were stretched over the 330 mile distance between North Bend, Oregon, and Quillayute, Washington, a standard measure of gradient, it would have created a heretofore unprecedented 74 millibar difference! The Columbus Day storm produced a 27.3 mb gradient between North Bend, and the near-equivalent of Quillayute, Tatoosh Island. A strong windstorm might produce 18-25 mb. The magnitude and relatively narrow spatial extent of the of the gradient points to a very compact cyclone on February 7, 2002. Energy was concentrated tightly around the center. |
|
|
|
At the same moment, around 16:55, as Eugene reeled under 49 mph winds, and Corvallis felt a gentle breeze of 10, the high wind warning got mention in my journal when I noted that it extended into the Cascade foothills of Clackamas County, just a few miles east of my home! I also wrote:
This is about as close to the "eye of a hurricane" as a Northwestern region ever experiences. Despite the benign weather, I did not feel very calm. Eugene was getting hammered, and the bent-back occlusion, dumping heavy precipitation over the Coast Range to the west and northwest, looked pretty ominous on the Doppler. As the low swept northeastward, I knew that the massive radar echo would drag over my home. While I monitored the gentle conditions near the center of the storm, Jerry's drama down in Eugene continued to unfold:
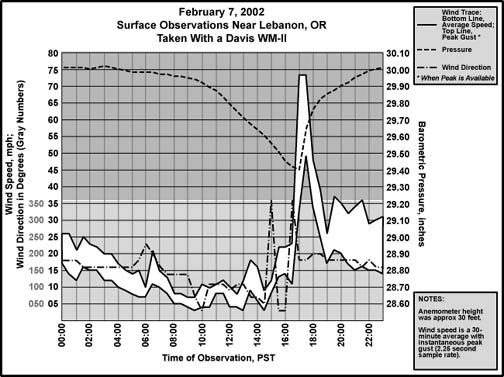
As the cyclone continued on its northeast track, the strong winds associated with the storm moved northeast-ward across the southern Willamette Valley. Between 16:30 and 17:00, the tongue of damaging winds reached the home of Darrel D. Glaser, who lived on a farm a few miles southwest of Lebanon. Fortunately at the time, he had a Davis weather station, and had it logging half-hourly readings on his home computer. Some months after the storm, I stopped by his place and he kindly supplied me with the detailed information recorded by the station. Some of this data is shown in the meteogram below, which can be compared to the official readings from the NWS station at Eugene. |
|
|
|
Examination of the two meteograms shows a striking agreement between Eugene and the Glaser Farm, and suggests a remarkable accuracy for the privately-owned Davis weather station. Peak winds at Glaser's farm were 49 mph gusting to 73, a close match to the Eugene data. Although, it should be noted that a Davis Weather Monitor II set to record data at 30-minute intervals is noting a 30-minute average wind! Eugene's ASOS was recording 2-minute average winds. At the Glaser farm, winds averaged 49 mph for the thirty minutes from 17:00 to 17:30, an incredible level, one on the verge of the 60 mph 10-minute average suggested by the Canadian Ministry of Forests as a minimum level necessary for causing wholesale windthrow in timber. In fact, a 49 mph 30-minute average could very well contain excursions to 60 mph at shorter intervals, such as in one or two minute runs (as recorded at Eugene). This would be devastating to trees. Indeed, a woodlot within a quarter mile of the Glaser home suffered heavy tree damage, around 20-30% blowdown (see photos far below). The two barometric traces between Eugene and Lebanon are also nearly identical. A peak 1-hour climb of 0.36" (12.2 mb), from 17:00 to 18:00, is indicated in the Glaser data. This is very close to the 0.35" (11.9 mb) jump in the 60 minutes ending at 17:25 at Eugene. Glaser's barometer indicated a pressure jump of 0.25" (8.5 mb) in the 30 minutes ending 17:30, and Eugene showed a surge of 0.21" (7.1 mb) in the 30 minutes ending 17:05. One of the more striking differences in the datasets is that the much less expensive Davis system ran uninterrupted during this intense storm, while the expensive NWS ASOS system experienced a number of data interruptions! From the above data, a measure of gradient between Eugene and Lebanon can be established for 17:00. Eugene reported a pressure of 29.63" at 17:00. The Glaser Farm barometer indicated a storm low pressure of 29.40" at the same time. That makes a difference of 0.23" between Eugene and Lebanon, or 7.8 mb! A huge gradient over such a small distance. Even as the gradient north of Eugene reached maximum, it was decreasing to the south. At about 17:00 PST, two-minute winds at Eugene dropped below 40 mph for the first time since 16:15 [2]. Essentially, Eugene experienced an unrelenting 40-60 mph gale, with higher gusts, that persisted for 45 minutes. However, damaging bursts would continue for thirty minutes after 17:00, accompanied by rapidly rising pressure. A public report from Springfield in this timeframe indicated limbs off trees and power out. And heavier gusts still lashed the Valley to the north and east. At 17:05 PST, Salem McNary Field, some 26 miles north of Corvallis, reported its lowest pressure at 29.43", with a temperature of 39° F, and winds of 7 mph out of 320°. At 17:07 PST, the bent-back occlusion on the Portland Doppler, which earlier was a west-to-east trending line, had now shifted to a southwest-to-northeast line, the mark of the northwest quadrant of the low nearing the metro area. At 17:12 PST, the winds at Eugene were 37 mph, gusting to 54, still out of 220°. The temperature had dropped to 39° F, and the barometer had rocketed up to 29.70". At the same time, Spotter Linn 3 reported roofs being blown off buildings in Sweet Home, which is about 34 miles northeast of the Eugene airport. Just three minutes later, the emergency manager for Linn County reported trees and power lines down, and that two semi-trucks had blown over on Highway 20, exact location unknown. The Corvallis station reported sustained winds of 28 mph with gusts to 44 out of 270° at 17:15 PST. This observation also indicated that the pressure jumped to 29.54", or 0.13", in just 20 minutes. The temperature dropped from 43° F to 37°, with a dew point of 34°. The bent-back occlusion had arrived with full fury, and the low was now to the northeast. Visibility dropped to 2.5 miles, suggesting heavy rain, or possibly, snow. Yes, snow. Surprise three. We'll get back to this momentarily. First, a brief excursion back in time to look at the Portland area forecast issued at 16:45 PST:
Note the absence of snow in this forecast (sorry, NWS forecasters!). Getting back to the original timeline, I recorded these conditions at 17:18 PST:
|
|
|
|
By 17:25 PST, the vivid yellow and orange echoes of the bent-back occlusion had quickly shifted to a nearly south-to-north trending line east of the coastal mountains, with a slug of moderate to heavy rain stretching from McMinnville to about Kelso (above image, radar at 17:25 PST). The Corvallis AWOS at 17:35 reported winds that had shifted to 250° and had lowered to 24 mph gusting to 31, with a barometer continuing a rapid rise at 29.66". At 17:48, spotter Lane 26, in Cottage Grove some 15 miles south of Eugene proper, reported, "Many trees uprooted, some blocking road," and 1.08" inches of rain had fallen in the last 24 hours. The winds had decreased to 23 mph gusting to 35 at Eugene by 17:54, out of 210°, with a barometer continuing a rapid ascent at 29.81". No temperature is given, and this starts a period of spotty reporting that lasts until 00:54 on the 8th. The winds had continued to shift and decrease at Corvallis, so that by 17:55 they were 230°, or southwest, at 15 mph and still gusty, with a barometer at 29.74" and rising rapidly, all indicators of a low shifting ever further northeast. Corvallis also reported 0.17" of rain in the past hour--a fairly heavy amount. At 17:59, I noted:
Salem, at 18:00, offered up a burst of wind at 18 mph gusting to 29, out of 260°, a significant shift from the 350° reported earlier. The barometer began a rapid rise at 29.64". The peak gust for this location, 31 mph, happened around this time. The low center was near its closest point to my location. I then wrote:
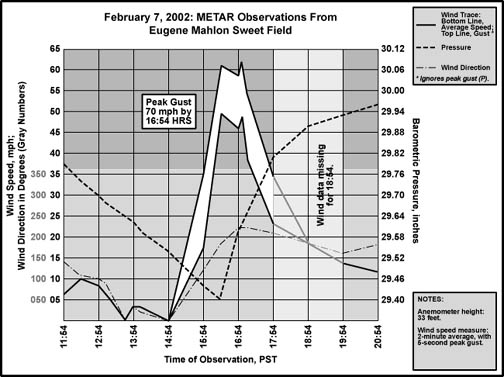
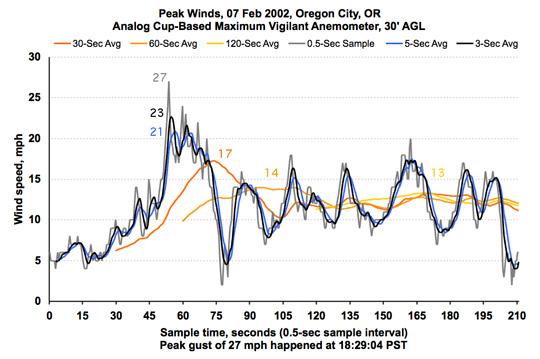
The graphic below shows the peak gust and four minutes of surrounding wind readings from my anemometer, and running wind speed averages of various durations. The sudden surge of wind from a fairly low speed period is the hallmark arrival of a strong bent-back occlusion. The 5-second average reading was the standard for the National Weather Service ASOS anemometers at the time of the storm. My peak of 21 mph is low even when compared to the 31 mph readings at Portland and Salem. The 70 mph gust at Eugene hit with eleven times the force compared to the gust that rattled the doors at my home. |
|
A radio station in Lane County, at 18:42, reported windfalls blocking a street in downtown Eugene, trees broken at U of O campus, and power outages. Winds at Salem were 210° at 18:53, averaging 18 mph and the barometer now indicated 29.77". A report a few minutes later showed that winds were also a southerly 210° at Corvallis, and had increased slightly to 21 mph gusting to 26. Then I noted:
By this time, local radio stations were being flooded with calls about heavy snow from Hillsboro to Lake Oswego, and even in downtown Portland. Snow reached the valley floor as far south as Corvallis. Roads were being covered in places, making travel hazardous. And, as pointed out, none of this made the earlier forecast. The storm had delivered its final surprise.
The low center had punched into the Columbia Basin east of the Cascades by the time I wrote that latter entry. Snow was very heavy in places, especially north of the low's track. A spotter in Buxton, Washington, reported 5 inches of snow on the ground by 17:15, and 10 inches at 08:30 on Feb 8th. I continued following the storm as it faded into history:
At 22:53, Salem reported south winds of 15 mph, light rain, 39° F, and a barometer at 29.96" and rising. The winds at Corvallis were 13 mph out of 190°, the temperature 39° F, and the barometer 30.00". Eugene, still reeling from the strongest winds since The Columbus Day Storm of 1962, could only manage a truncated report of light rain and 30.02". The cyclone had now moved far to the northeast, over Washington, kicking up gusts of 45-65 mph across the Columbia basin. For the Willamette Valley, the tempest was over. But the effects, especially for the south valley, were just beginning to be known. |
|
|
|
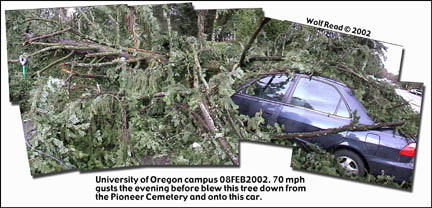
The Aftermath February 8, 2002 dawned mostly sunny, with little hint of the violence that had happened the evening before. I was in a kind of shock. This was the modern era of meteorology, with the most sophisticated forecasting models yet put in use, a variety of satellite tools, new and expensive automated reporting stations, and a fairly dense network of Skywarn spotters. Even PacJet, an experimental method for measuring low to mid-level winds in the atmosphere across a large chunk of the eastern Pacific, was operating at the time. And yet, the magnitude of the winds in the South Willamette valley was not recognized beforehand. The cyclone, it should be noted, wasn't a surprise. Its effects were. I left in the morning and headed to Eugene to see the damage for myself. This is what I noted in my journal:
|
|
|
|
Many Portland-area television news stations had concentrated on Lebanon, airing footage of tree-smashed and wind-thrown mobile homes for the north valley folks who were spared severe damage. A helicopter had circled several times as I filmed the bigleaf maple in the intersection--actually a road circle--south of U of O campus in Eugene. One thing I forgot to note in the above entry was the damage at the rest stop just north of town on I-5. It was closed due at least 15 large trees having been toppled, several of which had landed on one of the buildings. With Eugene, my damage tour had just begun:
|
|
|
|
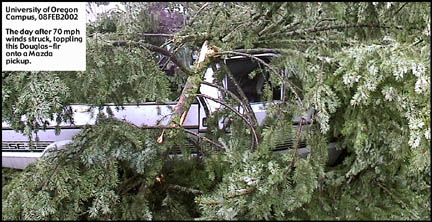
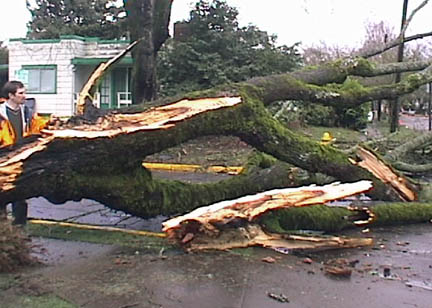
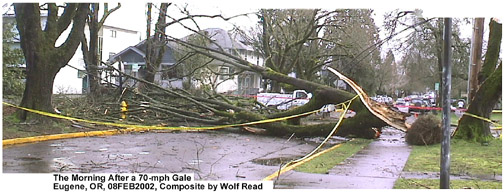
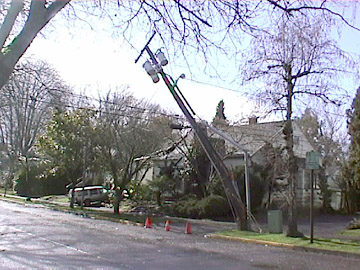
Photos above shows a maple that was thrown across a residential road near U of O Campus--the heavy tree took down a number of powerlines, and pulled over a line of poles in the process.
|
|
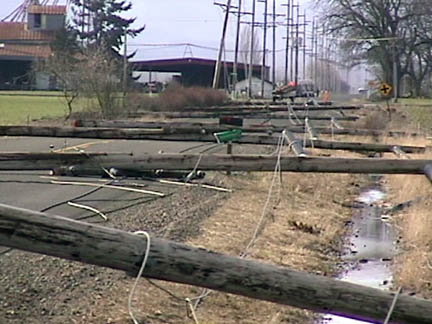
Pole line flattened across Colton Road. Note the standing poles downroad. This strongly demarked area of localized damage is typical of powerful straight-line winds. In forests, during swathing events, trees are often blown down in neat rows with the surrounding forest appearing quite unscathed. |
On May 19, 2002, I went on a family trip to California, and took the opportunity to survey areas missed on February 8th. We drove to Eugene, then headed west on 126, going through the heavily stricken Veneta area, then over the Coast Range to Highway 101. From that point, we headed south. Some patterns in the storm damage became apparent on this trip:
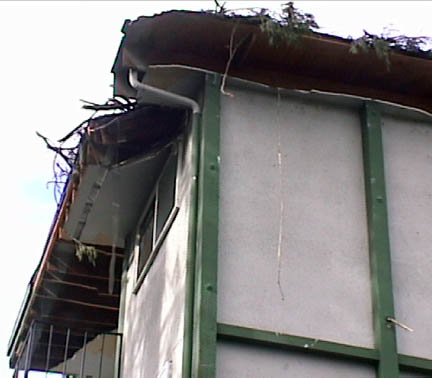
Of course, some of this breakage could be from other storms, especially on the coast, where high winds are more commonplace. Since the February 7, 2002 windstorm produced the strongest winds of the 2001-2002 storm season in the areas immediately south of its track, it's probably a good bet that most of the damage was from this one storm. The photo below shows heavy damage to the eave of a student housing building near U of O campus. The top of a tall western red cedar snapped in the gale and clobbered the building, plus took out a rod iron fence. |
|
|
|
A Quick Tree Damage Study: 07FEB2002 Compared to 09JAN1880 On August 3, 2002, I took the family back down to Veneta to do a tree count survey along the railroad tracks. During the May trip, I had realized that the east-west track orientation offered an excellent opportunity to generate modern data that was comparible to newspaper reports of the January 9, 1880 windstorm. I followed a 3/4-mile length of tracks starting from downtown Ventea, and then going east, noting every tree that was toppled by the windstorm. The six month delay didn't add to the difficulty. Conifer trees that had fallen over the winter before still retained their needles, though they had browned under the summer sun, and deciduous trees were fairly easy to distinguish from the freshness of the breaks, or chainsaw cuts made by crews clearing the timber from the tracks. Table 1, below, summarizes the total counts. |
|
Table 1: Total Treefall Counts by Species |
||||||
|
Ponderosa |
Douglas-fir |
Black |
Black |
Willow |
Total |
|
| Certain Across Tracks |
8 |
30 |
22 |
1 |
61 |
|
| Maybe Across Tracks |
1 |
10 |
11 |
|||
| Not Across Tracks [1] |
31 |
2 |
2 |
2 |
37 |
|
| Total Trees Down |
9 |
71 |
24 |
3 |
2 |
109 |
| Percent Total by Species |
8.3% |
65.1% |
22.0% |
2.8% |
1.8% |
|
| [1] Breaks visible to the south of the tracks, extending back about two tree lengths usually, say 100 yards. | [2] These appear to be a large number of human-planted non-native specimens, and were quite prone to breakage. |
| As shown in Table 1, the majority of fallen trees were Douglas-fir, which reflects the most common tree found in the count region. About 72 trees fell across the tracks in the 0.75 mile stretch. Most of these happened in small swaths, with long stretches of undamaged woods between. One area particularly hard hit was a narrow tongue of forest left standing after a clearcut had been created to the south. Blowdown was around 30 to 50% in the thin belt of trees. The trees didn't all fall in the same direction, but fanned outward in a distinctive pattern, as shown in the graphic below. This may reflect the shifting wind direction during the storm, from SE to SW over the course of about one hour. |
|
|
| Table 2, below, examines the number of trees by two categories of windfalls: broken trunks verses uprootings. Clearly uprootings dominate the counts with 74.4% of the total. This is an indicator that the heavy rains played a role in the tree damage caused by the storm. The saturated soil weakened the trees' root-hold on the ground, making them prone to falling under high winds. |
|
Table 2: Type of Treefall |
||||
|
Trees Across Tracks |
Maybe Across Tracks |
Not Across Tracks |
Total |
|
| Trunk Breaks | ||||
| Ponderosa |
8 |
1 |
9 |
|
| Douglas-fir |
7 |
2 |
3 |
12 |
| Black Cottonwood |
4 |
1 |
5 |
|
| Black Oak |
1 |
1 |
||
| Willow |
2 |
2 |
||
| Uprootings | ||||
| Ponderosa |
0 |
|||
| Douglas-fir |
23 |
8 |
28 |
59 |
| Black Cottonwood |
18 |
1 |
19 |
|
| Black Oak |
1 |
1 |
2 |
|
| Willow |
0 |
|||
| Totals |
61 |
11 |
37 |
109 |
| Table 3, below, looks at the distribution of trunk breaks among species. All ponderosa pines that fell in the count area had been broken by the wind, suggesting either weak trunks, or strong roots. Only 16.9% of Douglas-firs had trunk breaks, indicating that this species roots had been particularly compromised by the saturated ground, or that their shallow roots just aren't designed for high winds, epecially in areas bordering a clearcut. |
|
||||||||||||||||||
| Table 4, below, summarizes some of the treefall counts that appeared in the Daily Oregonian in the days after the January 9, 1880 windstorm. This is the kind of data I was attempting to replicate by doing a tree count along the Veneta tracks to start establishing estimates of peak wind speeds in areas that didn't have anemometers during the 1880 Storm King. |
|
Janaury 9, 1880 Treefall Tallies |
||||
| Location |
Length of Tree Count, Miles |
Length of Tree Count, Feet |
Number of Trees Across Track/Road |
Average Separation of Fallen Trees, feet |
| Canemah |
1.00 |
5,280 |
225 |
23.4 |
| Linn's Mill to Oregon Cty |
7.00 |
36,960 |
349 |
105.9 |
| J. W. Kern's Place, Ptlnd |
0.17 |
900 |
65 |
13.8 |
| Near J.W. Kern's |
0.25 |
1,320 |
200 |
6.6 |
| Road Ptlnd to Wash Cnty |
6.00 |
31,680 |
287 |
110.4 |
| Track Ptlnd to Bvrtn |
15.00 |
79,200 |
365 |
217.0 |
| Total / Average |
29.42 |
155,340 |
1,491 |
79.5 |
|
The totals in Table 4 show that the average separation between treefalls was 79.5 feet for the January 9, 1880 storm. By using the 61 trees that clearly went across the tracks at Veneta on February 7, 2002, and averaging that total over the 3,960 feet covered during the count, a separation of 64.9 feet between windfalls results. This is quite comparible to the figure for the 1880 storm, suggesting an equal intensity of wind. Unfortunately there seems to be no wind record at Veneta for the 2002 event. Using the peak velocity of 49 mph gusting to 70 measured at Eugene's Mahlon Sweet Field, the closely matched treefall figures suggest maximum winds in the same range for the 1880 storm for many of the locations affected by the winds. At Portland during the 1880 gale, peak wind speeds were measured at 53 mph gusting to 73, according to an article by Decker, Fred W., Cramer, Owen P. and Harper, Byron P. from the December 1962 issue of Weatherwise, "The Columbus Day 'Big Blow' in Oregon," pages 238 to 245 (see especially page 244). This measurment is in nice agreement with those recorded at Eugene in 2002, though the figures in 1880 are from a 4-cup anemometer and are probably high. Heavy rains also saturated the Willamette Valley ahead of the 1880 winds, making soil conditions similar between the two storms, adding support to this brief study. In summary, the 2002 treefall count indicates peak winds of 50G70 mph over most of the Northern Willamette Valley during the Great Gale of 1880. Or, in other words, the February 7, 2002 South Valley Surprise locally packed as much punch as one of the biggest windstorms in Oregon's history. |
|
Photos above show one of the power poles that were yanked to the point of breaking by a maple that was thrown across a residential road near U of O Campus (photo of the broken maple appeard earlier in this section). |
|
The Media Perspective All material in this section reprinted with permission. Copyright 2002. The Register-Guard. "Winds land sneak punch," says the headline on the February 8, 2002 issue of Eugene's Register-Guard, right above a large photograph of a Chevy pickup that had been smashed by a 50-foot spruce [3]. Three men were in the quad-cab, hauling a snowmobile. As they drove on East 13th avenue in the right-hand turn lane, with the gale roaring through the neighborhood and peeling off metal roofing, the windfall struck, crushed the cab's roof level with the window bottoms, and trapped the men inside. The tree had a long reach, and also pounced on a Toyota pickup truck in the far left lane, trapping another person. Power lines were yanked down under the heavy trunk, and rested on the Chevy. The pickups were so thoroughly buried under heavily foliated limbs, that witnesses at first didn't realize there were vehicles under the prostrated giant. People from nearby businesses and homes tried to help the men in both stricken vehicles, but the limbs were so dense that the large chain saws of rescue crews were required to accomplish anything. It took nearly two hours of careful tree cutting for rescue crews to saw enough of the tree away to free the men. They had to avoid the power line, which was live for a time, and there was fear of the tree's weighty bole shifting as its titanic limbs were removed. The Eugene Fire District Chief described the situation as "the most hazardous rescue I've seen in 34 years." The Toyota driver was freed first. Two men were escaped the Chevy about an hour apart, both relatively unharmed. The final rescue required a backhoe. A chain was looped around the tree and attached to the powerful machine, which then lifted the tree away from the pickup. Once cleared, the Chevy's smashed roof had to be cut away. The final victim was sent to Sacred Heart Medical Center, treated and later released. At Lane Community College, a woman walking across campus was struck by a heavy branch. Her injuries were serious, and she was taken to a hospital. The expected comparisons between the impact of the 2002 gale and the Columbus Day Storm appeared several times. This warrants a digression from the newspaper reports for a brief examination of the reported wind speeds at Eugene Mahlon Sweet Field: a peak 2-minute wind of 49 mph, with a peak 5-second gust of 70, which appears lower than the 63 mph gusting to 86 reported during the Columbus Day Storm. The format for wind values was different in the era before ASOS. In 1962, a 1-minute average with peak instantaneous gust was recorded at Eugene. The earlier wind readings, which are values taken over shorter time periods, would tend to be higher than the modern values. Following a 1.2X conversion established in 2001 by examination of the behavior of a Maximum Vigilant anemomter with a video camera, Eugene's peak 5-second velocity yields a potential instantaneous gust of 84 mph, which is nearly equal to the great Columbus Day Storm! Further complicating the matter is the ever-familiar problem of sensor height change, which, at Eugene, was 20 feet in 1962, and 33 feet in 2002. With the application of the long-established standard power law formula for estimating wind speeds at different elevations [4], the 2002 winds are reduced to 46 mph gusting to 65--or 78 with the instant gust adjustment. It should be noted that converting gusts with the power-law formula, which is intended for average wind speeds, is dubious. It appears, however, that the 2002 windstorm was certainly a contender for top gale in the Eugene area, but it seems that the Columbus Day Storm still had the edge! As with the great storm of 39 years past, on February 7, 2002, hundreds, if not thousands of trees were blown down across Lane County, along with an untold number of limbs [5]. In two-and-a-half hours, no less than 500 calls about downed trees and branches were received by a battalion of 28 City of Eugene dispatchers. About two dozen trees fell on the University of Oregon campus alone. At the west end of town, one property owner also lost a couple dozen. Hendricks Park looked like a bomb zone with 28 trees toppled among a morass of twigs and branches. Ten city crews were sent out to remove trees that weren't wrapped in power lines. Windfalls tangled in lines were generally handled by the power companies. Also responding to the crisis were 50 members of the police force, including detectives and command staff. Tree-cutting businesses, and people interested in firewood or simply cleaning up the city, brought their chainsaws and helped out. Due to liability reasons, however, freelance cutting was discouraged in public areas--a strikingly different stance from the "open firewood market" after the Columbus Day Storm some four decades before. Tree cutting permits were required. Most roads in Eugene were reopened by Saturday night, but debris still littered the ground throughout the city. It was estimated that two weeks would be required to clean trees, branches and other debris from streets and sidewalks. Jerry Oltion's story continued in this vein:
Back to the news accounts, outside of Eugene, at the rest stop 10 miles south of the city, trees blockaded I-5 in both directions. Highway 126 was closed by busted timber east of Springfield, and again at Mapelton. On the coast, 101 was blocked at Reedsport, and Highway 38 between Reedsport and Scottsburg had no less than three locations covered by forest giants. At least 50 county road maintenance crews were dispatched to clean up the mess. Dexter, Fall Creek and Cottage Grove were described as having moderate to heavy damage by the road maintenance manager. Veneta was "a war zone." Due to its surprise intensity, the windstorm created a unique road emergency. With the more typical snowstorms and floods, there was usually ample warning to ready crews, and the situations unfolded at a fairly slow pace. With the South Valley Surprise, preparation time was zero, and the damage happened in a few hours. Recent heavy rains, which saturated the ground and weakened the trees' footholds, probably played a role in the heavy loss of timber. My own suspicion is that the great drought of 2000-2001 also had a hand in this. The sharp dry, which affected much of the Pacific Northwest, was the most pronounced in southwest Oregon, with Eugene about 2.5 feet below the four-foot normal rainfall for the water year. This clearly stressed forests throughout the region. Recently killed trees dotted the countryside by midsummer 2001. And many that were still living probably had a large proportion of their roots die off, weakening their hold on the ground. These and other factors contributing to windfalls are examined more closely on the pages for the January 1986 storm train, and the Wind and Trees pilot study. With so many trees breaking, cars suffered, sometimes disastrously. Between 12th and 13th Avenues on Mill Street, an oak snapped under the force of the angry gale, and landed on three parked vehicles. One, a 1999 Subaru Outback that was nearly crushed from end-to-end, had been a college gift from father to son just a month before. The owner of the neighboring Nissan Sentra consoled himself with the knowledge that the damage to his car was only to property, not people. In Elmira, an old pickup had its nose smashed by an uprooted Douglas-fir. The Midway Statuary and Oriental Gift Shop suffered the impact of two wind-ravaged trees, one of which was a 100-foot-tall western red cedar that had endured many past storms. The giant landed in the outdoor display area, and smashed many sculptures and fountains. The living area seemed to have suffered an earthquake, with a shattered roof, broken windows, and dishes that had tumbled to the floor. One of the owners had been present during the sudden windfalls-fortunately she was not hurt. Dinner by candlelight was planned, as the power was out. Two neighboring homes were struck by two neighboring trees on Fourth Avenue near Monroe Street. Police checked out both structures and determined that they were empty, then cordoned off the area with crime scene tape. With widespread destruction throughout the city, the yellow ribbons were a common sight by the following day. In fact, as I strolled the streets of Eugene looking for the storm's effects, the tape, visible at long distance, led me to the damaged areas. Eight trees fell on the grounds around the Eugene Friends Church. A giant fir went right through the fellowship hall, destroyed that part of the church, and put a damper on a planned 50th anniversary celebration. A remodeling had been discussed before the storm, and now it included the hall. The Eugene Bible College offered a temporary place for the congregation to meet. |
|
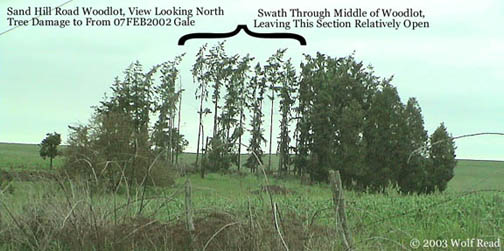
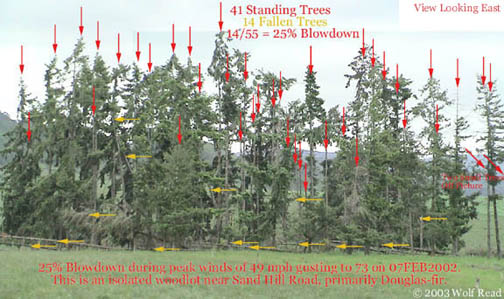
Winds of 49 mph gusting to 73 were clocked by D. Glaser, who's anemometer was located near the woodlot in the two photos above (images taken 1.25 years after the event). A moderate swath occurred through the middle of this woodlot, quite visible from the north view. No less than 14 trees were felled, of which 13 were large specimens, amounting to about 25% of the entire stand. The exposed trees still standing in the swathed region of the woodlot are notably thinned of branches. |
|
Twenty people were at Echo Hollow swimming pool when powerful gusts began rattling the building's large door-and-window entrance. Suddenly the door cracked, then the entire assembly disintegrated and showered the water with glass. Everyone was safely evacuated. Cleanup was easy because the tinted window showed up well under the water, but demand for glass was so high after the storm that a repair date for the entrance was unknown. The tempest lifted most of the roof from the Eugene Swim and Tennis Club's teaching area. The Greenhill Humane Society suffered the storm's capriciousness, with damage to a kennel, some storage sheds, and the cattery. Two trees landed direct hits on the Spanish-tiled roof of a home on Carthage Avenue--one wing of the house was completely devastated. Another dwelling on Carthage had a Douglas-fir reduce its garage to splinters. A tree tore open the corner bedroom of a house on River Road. The house of a local chellist was severely damaged by a tree. The cleanup ate away rehearsal time for the musician, forcing the cancellation of a concert scheduled for the following Friday. Around 6:00 PM, a blackout killed the traffic lights on Franklin Boulevard in Eugene. Traffic piled up, and progress was virtually a crawl. |
|
|
|
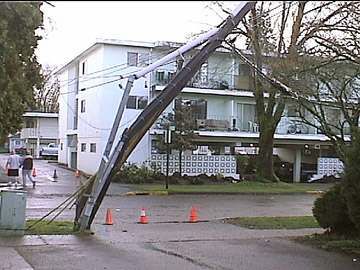
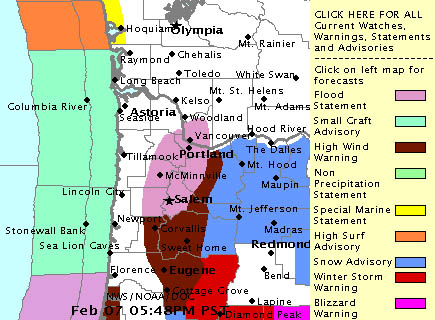
The darkened stoplights were a tiny part of the biggest long-term drama wrought by the storm. South Valley utilities suffered a wholesale destruction the likes of which hadn't been since the Columbus Day Storm of 1962 [6]. Nearly 18,000 customers of the Eugene Water & Electric Board (EWEB) had lost power during the storm, over 20% of the utility's load. No less than seven high-voltage transmission lines were yanked downed by wind-thrown trees, as were 29 feeders. About 60 of the utility's power poles had been thrown down by the gale. Along the McKenzie River, poles were destroyed with such abandon that quick restoration of power was impossible. Customers living among Eugene's south hills shared water loss with the darkened lights, as the roots of collapsing timber ripped up mains, and pump stations lost power. By 7:00 PM on Thursday, only about a third of the EWEB customers had their electricity restored. The damage was so extensive that 11 Pacific Gas and Electric (PGE) crews, which typically serve the Portland area, were requested to help repair the system. Also hard hit was the Springfield Utility Board (SUB), with 10 to 12,000 customers suffering blackout during the storm. Restoraton of power was expected for most by midnight, though at least 500 were anticipated to have at least a 36-hour wait. To speed up repairs, employees other than line workers, such as meter readers, were being utilized to follow the wires and report on any damage. The Emerald Peoples Utility Board (EPUD) system was clobbered. For the first time in history, all 17,000 customers lost power in a single sweep. Even the utility's office was in the dark, and the wind had carried away the roof over the front walkway. Some crews from Bonneville Power were helping the utility restore service. Blachly-Lane Electric Co-op had most of its 3,500 customers lose power, save for a tiny area along Indian Creek. The task of repair was so great that two contract crews from Goldendale, WA, were hired to relieve the co-op's two regular crews. Lane Electric Co-op also suffered outages. Due to extensive destruction of power poles, repair took longer than anticipated. A large tree that fell in Eugene's South Hills typified the problem. The windfall caught EWEB power lines on the way down and took eight transmission poles with it. A crane was required to help with the repair job, and a plenty of time. Replacing eight poles typically required about a week under normal conditions-the situation after the South Valley Surprise far from normal. By Friday evening, 15,000 customers for EWEB, EPUD, SUB, Blakely-Lane and Lane Electric, were still without electricity, and restoration to some of the more remote homes wasn't expected until Tuesday or Wednesday. And many employees had been working intensely on power restoration for nearly 40 hours straight. State rules required that they take a break. Some of these workers had suffered losses during the storm, and they took the opportunity to finally see the damage to their own homes and yards. Most showered and grabbed as much sleep as they could, for extensive repair remained to be done. During the weekend, sunny weather with light winds aided the crews as they cut away damaged trees, re-strung lines, and replaced busted poles. By sunset on Saturday, 3,000 customers of the five main power suppliers were still without power. This included areas around the University of Oregon--the blackout interfered with some students' study for midterm exams. Sections of Whiteaker and west Eugene continued to be severed from the grid. In Springfield, only 200 customers remained in the dark, many in the Hayden Bridge Way region, and near Sony Corporation. By Sunday evening, the number of powerless EWEB customers had only fallen to 2,200. This despite the fact that crews were working 18-hour shifts, and retirees had been rehired to help out with the massive repair job. Major transmission lines had been fixed by this time, and concentration had shifted to the small pockets severed from the system, which is typically the more time consuming part of power restoration. A single line connecting a home can take as long to fix as a large feeder to several hundred. Many more lesser lines were broken Thursday evening than in the more typical windstorms of the past, further exasperating the repair effort. About 60 SUB customers were still without electricity, and for EPUD, which served a rural 550-square-mile region, about 800 continued to be severed from the system. Having endured 72 hours without power, some blackout victims had become indignant, with the most vociferous right in the middle of Eugene. The latter had a hard time reconciling the reality that the outages were taking as long to restore in some urban locations as they were out in the country, where lengthy power interruptions are expected. Other people took the outage in stride. One Eugene tavern, Sam Bond's Garage, served beer chilled on ice, all to the fine tune of acoustic music, and the romance of candlelight. On Monday morning, some Whiteaker neighborhood EWEB customers stopped a utility truck and confronted the crew about the seemingly slow repairs. There was some suspicion among the residents that the power company had deliberately ignored the Whiteaker neighborhood in reprisal for protests against trimming trees away from lines. However, the residents went after the wrong people. Repair crews don't make the decisions about where to go, and the overworked technicians were already dealing with enough problems wrought by Mother Nature. "Mother Nature" is key here, as it was a storm that downed all the timber, not EWEB. In essence, Whiteaker residents paid the price of keeping many big, showy trees along the streets. They had been warned, but Eugeners do love their trees. The crew endured the confrontation, and power was restored to Whiteaker later in the morning--probably rendering a few confrontational customers red-faced. Many rural communities had been put back on line by Monday, including most of Coburg, reducing the number of EPUD users without power to about 500. Blackely-Lane had all customers back in service, and had sent its crews to help other utilities. Lane Electric was down to about 200 in the dark. In sharp contrast to the urban reaction to the long-term blackout, rural patrons were supportive of the repair effort. Coffee and donuts were being left for the line crews, sometimes en masse. Though, to be fair, not all Eugene residents were nasty to the power companies, as a couple of glowing letters in the editorials on page 8A of the February 12, 2002, Eugene Register-Guard can attest to (along with a nice note on the difference between a tornado and a Pacific cyclone). By Tuesday, EWEB had all but 300 customers restored. With the restoration down to small pockets, some of the six EWEB and eleven PGE crews, which are typically four-person, were split into two-person teams to cover about 30 problem areas. The utility estimated that the total cost due to the storm was at $1.3 million, with about $850,000 of that from overtime, materials and service loss. Lane Electric still had 200 patrons without electricity-progress was going slow in Veneta and Lowell due to the intense nature of the damage at those locations. EPUD was down to 100. The system suffered a loss of about $415,000, with 30 poles replaced, about 25 that had a list and probably needed replacing, 75 cross-arms replaced, 20 transformers, and 12,500' of conductor. EPUD and EWEB requested that Governor John Kitzhaber declare the region a disaster area to qualify them for relief through the Federal Emergency Management Agency. Lane County, its utilities, and cities suffered a loss of $4.5 to $6.0 million, with EWEB accounting for about $1.5 million of that estimate [7]. Linn County suffered at least $4.5 million in structural losses, with at least 91 homes and businesses having suffered greatly to the winds. Of that figure, at least 15 buildings were destroyed, and 31 had major damage. Many of the losses were insured. With entire lines of poles bowled over, Consumers Power accounted for an additional $1.2 million in losses. Linn County Parks suffered a further $100,000 in damage. Roaring River Park, for example, was such a tangle of windthrows that no official count of tree loss had been possible, even two weeks after the storm! To sum up, between the two south Willamette Valley counties, total damage ranged from $10.3 to $11.8 million. Coos, Curry and Douglas Counties, which were also bruised by the maelstrom, added to that total. In considering the length of the power outage in some places, a few words on emergency preparedness seem appropriate here. Depending on location, the Columbus Day Storm produced sustained winds of 58 to 98 mph across the Willamette Valley, with gusts of 86 to 125. Some of these readings are significantly higher than the 50 mph gusting to 70 reported at Eugene in 2002. And had the February 7, 2002 cyclone tracked slightly more northward than eastward, closely following the track of the 1880 Storm King, it could easily have encompassed the much more populated Portland-Salem region. Considering the extensive damage to the power grid from the sneaker gale of the 7th, and the very real possibility that a windstorm can be significantly stronger and affect a much broader region, it seems prudent that residents living in the Pacific Northwest be prepared for at least a 5-day long outage. Basic preparation should include a good supply of water, food, batteries, candles, warm clothing and blankets. On Friday, schools from Junction City to McKenzie were closed due to wind damage and power outages [8]. On the coast, at Lakeside, about 60 North Bend School District children were unable to get home due to roads closed by windfalls. The region had been struck severely, with houses pummeled by trees, some missing roofs, and the local hardware had its front panes shattered. A church, the Lakeside Assembly of God, provided a temporary shelter for the stranded students. As the storm slowly began to fade from memory, a gigantic butternut tree, about 19' in circumference with a crown that reached 104' high, that adorned the neighborhood centered on 465 E. 11th Avenue, brought the storm back to the present [9]. Fourteen years before the windstorm of '02, the tree was listed as the largest known butternut in the United States by the American Forestry Association. The giant, which was loved by many in the area, weathered the windstorm's vicious gale, but not without a fatal wound. About five days after the big wind, a large crack was noticed between the tree's two main trunks. While an arborist and a tree cutter looked on, discussing the damage, the crack noticeably widened. Police were immediately called to close off the street, chains put around the damaged trunk to hold the tree together, and a crew brought in to take the leviathan down. The tree would be missed by many. The image below shows the complex assemblage of weather warnings that had accrued by 17:48 PST on 07FEB2002, and is courtesy of the National Weather Service, Portland. |
|
|
|
The Early Forecasts Computer models as early as the morning of February 4th showed that a low would bomb in the very location that the February 7th low was located, and possibly track northward to give the entire Pacific Northwest a strong wind event [10]:
But the very same models backed off on the forecast by nightfall, with some showing a track further south, and a few just giving up on the low altogether:
Even so, there was still recognition that lows could develop, and that the situation required wataching. The cybernetic version of the cyclone returned on the morning of the 5th:
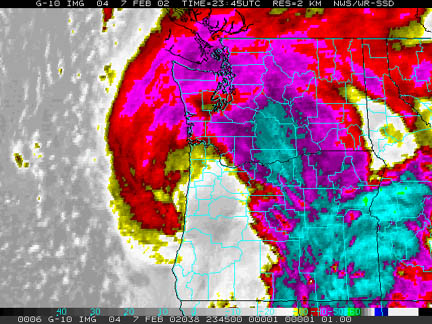
The contrast between the uncertainty in the above forcasts and the near certainty many days before the December 1995 windstorm, as indicated from the glowing newspaper reports about the great success in forecasting that six-years-past storm, is striking. What was the difference? Dave Willson, lead forecaster at the National Weather Service, Portland, and recipient of an award for the December 1995 forecast, took the time to write me some comments on the difference in the forecasting situation between the 1995 and 2002 storms. I also discussed this with George Taylor, Oregon's state climatologist, in April of 2002. Willson said that the December 1995 storm "followed a weather pattern with jetstream dynamics and upper level features that was related to BOMB cylogenesis similar to the Columbus day storm and the November 1981 storms. The computer models were not perfect but handled it fairly well. Still it was far from an easy forecast with huge ramifactions. Scientific papers By John Coparanis, Robert Lynott, John Jannuzzi and Jay Wollander helped me in forecasting the Dec 12 1995 storm. This was a classical atmospheric bomb and John Coparanis's paper of January 1985 was of particular help to me in making this forecast." The December 1995 scenario followed fairly closely the two other big events in the last 40 years of the 20th century, October 1962 and November 1981, and this past experience was put to good use in delivering a solid forecast. Taylor pointed out another significant detail: strong storms tended to precede the big events. As discussed in the Columbus Day Storm page, a fairly powerful low struck the northwest just one day ahead of the Big Blow. This also happened over the weekend ahead of the December 12, 1995 bomb, with at least two lows driving up the coast on the 9th and 10th. To some extent, the weaker storms paved the way for the cyclogenic bombs by maintaining a trough of low pressure for the larger, deeper cyclones to follow. The smaller storms were also a clear indication that conditions over the Pacific were ripe for the formation of intense cyclones. To create a superstorm, it was just a matter of the atmospheric environment, especially in the upper-levels, falling into solid alignment. In February 2002, the situation was somewhat different. Willson noted: "I indicated on my weather discussion of Feb 4th that there was model variance but a potential for developing a strong low [the first synopsis included above]. I did not work forecast shifts on the days closer to the storm as it developed, but models continued to vary and were less accurate as the model runs got closer to the storm. The low intensified close to land, intensified as it came inland and had a more easterly track, so it was a difficult forecast for those that were on duty." In other words, the February 2002 storm began a bomb session so close to land that there was little time to adjust the forecasts. More importantly, this sudden deepening as the cyclone made landfall was unlike the scenarios for the Big Three. The major lows of the past developed far out to sea, providing plenty of warning about their approach as various observations were received by forecasters. Finally, as airflow over the Pacific gets more zonal (more-or-less following the latitude lines-a "west flow"), forecasting gets more difficult, especially in the timing of events. The stronger easterly track to the 2002 cyclone put the storm in a fuzzier forecast situation, indicated by the flip-flop predictions offered by the computer models. All these events tied together resulted in a rare surprise for modern-era weather forecasters. There's another twist to the forecast story: the "Mid-Pacific Data Hole." I attended the Pacific Northwest Weather Workshop in 2003, and heard many talks on future improvements for Northwest weather forecasts. One brief discussion got started with a comment about certain computer models predicting weather conditions more accurately 4 to 5 days out, when compared to closer time intervals such as 1-3 days. This was roughly true for the windstorm of February 7th, as indicated in the Forecast of February 4th above. How's this possible? Apparently the models are utilizing good upper air data from Asia, conditions that generally takes 4 to 5 days to reach the Western United States (this could be faster with a very progressive pattern). As the chunk of atmosphere migrates over the Pacific, it crosses a broad region where upper air data is scanty or nonexistent. The models, in essence, loose the information that had been available for 5-days-out for closer time periods, and the forecast degrades as the day, in our case February 7th, draws closer. There are a variety of plans for filling in the Mid-Pacific Data Void, including offshore buoys that could fire rockets to take upper-air data, and sending unmanned air vehicles (UAV) into incoming storms. If all goes according to plan, by 2010, the kind of forecast flip-flops witnessed before the February 7, 2002 windstorm may generally be a thing of history. Satellite photo below is a 2-km resolution infrared image of the storm taken at 15:45 PST. |
|
|
|
General Storm Data Minimum Pressures and Peak Gradients Table 1, below, lists the lowet barometric pressures achieved during the February 7, 2002 storm for 11 Pacific Northwest locations. The readings tell the tale of a cyclone rapidly moving in out of the southwest and pouncing upon Western Oregon. Arcata's barometer was hardly depressed by this storm, yet just the north, North Bend had one of the lowest readings, the mark of a very compact system. The lowest official reading at an offical station in Oregon was 29.39" (995.3 mb) at Corvallis. Source: all pressure data is from the National Weather Service, Eureka, Portland and Seattle offices, METAR reports, save Bellingham and North Bend, which is from the National Climatic Data Center, unedited surface observation forms. |
|
|
Table 1 Notes: [1] The 29.66" minimum pressure at Quillayute was the first of two hours with such a reading (1004.3 mb). [2] The 29.65" minimum pressure at Bellingham was the first of two hours with such a reading (1003.9 mb). |
|
Table 2, below, lists the maximum pressure gradients achieved during the February 7, 2002 storm for 10 Pacific Northwest measures. Some of these gradients are fairly strong, especially ACV-OTH, MFR-EUG and EUG-PDX, but none are records. The southern track is quite clear on this list, with very weak gradients for the northern stations contrasting against powerful gradients among the southern stations. The +6.4 mb (+0.19") maximum gradient for AST-DLS is one of the few cases where the pre-low-passage negative gradient was exceeded by the post-low positive one during a significant Pacific Northwest windstorm. Another case of this happened on November 3, 1958. The PDX-DLS gradient maxxed out at +7.5 mb (+0.22") at 22:00. Source: all pressure data is from the National Weather Service, Eureka, Portland and Seattle offices, METAR reports, save Bellingham and North Bend, which is from the National Climatic Data Center, unedited surface observation forms. Some BLI data is from the University of Washington archived surface observations. |
|
|
Table 2 Notes: [1] The maximum negative gradient for OTH-AST was -7.1 mb at 15:00 PST. For a negative value, this is quite strong. At the same time, ACV-OTH was +16.5 mb, demonstrating a compact, steep-gradient system. [2] The maximum negative gradient for AST-UIL was -2.2 mb at 17:00 PST. [3] The +10.7 mb maximum gradient for OTH-UIL is the last of two occurrences, the other having happened at 19:00 PST. The maximum negative gradient for OTH-UIL was -8.3 mb at 15:00 PST. [4] The maximum negative gradient for EUG-PDX was -5.4 mb at 16:00 PST. [5] The maximum negative gradient for PDX-SEA was -2.6 mb at 17:00 and 18:00 PST. [6] The maximum negative gradient for SEA-BLI was -3.9 mb at 16:00 PST. [7] The maximum negative gradient for AST-DLS was -3.5 mb at 14:00 PST. |
|
Pressure Tendencies Table 3, below, lists the maximum hourly pressure falls and rises achieved during the February 7, 2002 storm for 11 Pacific Northwest stations. A very strong pressure couplet occurred over Western Oregon, with peak rates of climb for some approaching, and reaching record levels. These surges, which matched, and exceeded the Columbus Day Storm of 1962, were associated with the passage of a strong bent-back occlusion, a feature where steep pressure gradients are known to develop. The +14.2 mb (+0.42") surge at North Bend is the second highest 1-hour pressure climb ever reported at any of the 11 stations 1950-2007. The highest, +16.6 mb (+0.49"), occurred at North Bend during the November 10, 1975 windstorm. The +11.9 mb hourly climb at Eugene during the 2002 storm is the highest ever recorded for any of the interior stations in the table, 1950-2007. A close contender--and quite similar storm in many respects--was the November 3, 1958 windstorm with +9.8 mb (+0.29") at Olympia. Source: all pressure data is from the National Weather Service, Eureka, Portland and Seattle offices, METAR reports, save Bellingham and North Bend, which is from the National Climatic Data Center, unedited surface observation forms. Some BLI data is from the University of Washington archived surface observations. |
|
||||||||||||||||||||||||||||||||||||||||||||||||||||||||||||||||||||||||||||||||||||||||||
|
Table 3 Notes: [1] North Bend's 3-hour tendency was +18.2 mb from 16:00 to 19:00 PST. [2] The sea-level pressure (SLP) readings that typically accompany the regular hourly reports were disrupted fairly early in the storm. However, altimeter readings continued to be reported during much of the high wind period. The maximum hourly pressure rise in the table is based on altimeter readings of 29.39" at 16:25 (the lowest pressure during the storm) and 29.74" at 17:25. Closer to the regularly hourly record, a 29.55" altimeter at 16:50 had climbed to approximately 29.80" by 17:50, marking a +8.5 mb hourly change. Eugene's 3-hour tendency was +15.6 mb from 16:00 to 19:00 PST, and +17.6 mb from 16:25 to 19:25 PST. [3] Salem's 3-hour tendency was +13.5 mb from 17:00 to 20:00 PST. [4] The -3.0 mb maximum hourly pressure declension for Portland is the last of two occurrences, the other having happened at 13:00 PST. Portland's 3-hour tendency was +11.2 mb from 18:00 to 21:00 PST. |
|
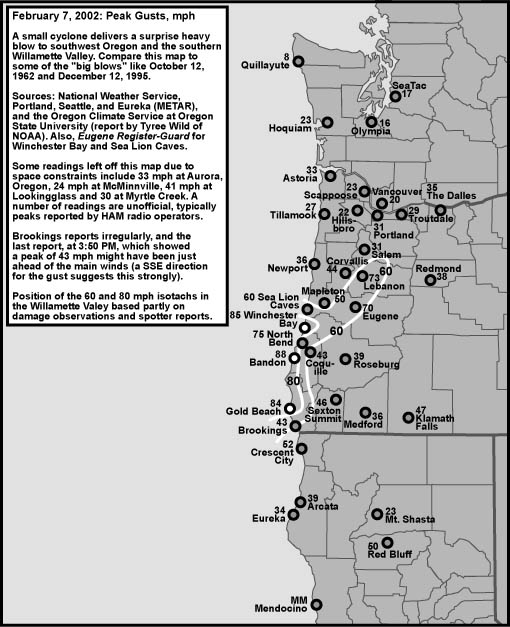
Peak Wind and Gust Table 4, below, lists the peak wind and gust for eleven key stations in the Pacific Northwest, their direction, and their time of occurrence. "Peak Wind" is a 2-minute average, and "Peak Gust" is a 5-second average. By my own personal methodology, a wind event rates the term "windstorm" when the average peak gust of these eleven stations reaches 39.0 mph (gale force) or higher. The February 7, 2002 storm didn't make the cutoff, and is a clear demonstration that mesoscale wind events can sometimes strike with enough force to be noteworthy. The ranking system favors those storms that follow a northward path close to the U.S. Pacific Coast, and for good reason--such storms affect the largest land area, and therefore are potentially the most destructive. The February 7, 2002 cyclone didn't follow such a path, and damaging winds were limited to a relatively small region. Even so, property damage exceeded $10 million, with scores of structures severely damaged or destroyed. The 2-minute wind of 60 mph measured at Eugene is extraordinary. Two-minute averages tend to yield somewhat lower numbers than 1-minute averages taken on the same wind run, perhaps by a factor of about 5 percent. A 60 mph 2-minute wind is perhaps equivalent to the maximum 1-minute wind of 63 mph recorded at Eugene during the great Columbus Day Storm of 1962. However, the comparison is complicated by a 20-foot anemometer height in 1962 compared to a 33-foot height in 2002. The peak 5-second gust of 70 mph, when adjusted via a 1.19 factor, points to a peak instant-gust of 83 mph. This is very close to the peak instant-gust of 86 mph measured during the Columbus Day Storm. These data indicate that, for the Eugene area, the February 7, 2002 windstorm very closely approached the magnitude of the Columbus Day Storm. Source: Wind data is from the National Weather Service, Eureka, Portland and Seattle offices, METAR reports, save Bellingham and North Bend, which is from the National Climatic Data Center (NCDC), unedited surface observation forms. Peak 2-minute wind for Eugene is taken from the February 2002, Local Climatological Data publication of the NCDC. |
| Location |
Peak |
Direction |
Obs Time of |
Peak |
Direction |
Obs Time of |
| California: | ||||||
| Arcata |
29 |
240º |
12:53 PST, 7th |
39 |
150º |
12:53 PST, 7th |
| Oregon: | ||||||
| North Bend [1] |
43 |
210º |
15:54 PST, 7th |
53 |
210º |
15:54 PST, 7th |
| Astoria |
17 |
250º |
03:55 PST, 8th |
33 |
260º |
22:12 PST, 7th |
| Medford |
23 |
260º |
18:56 PST, 7th |
36 |
250º |
19:04 PST, 7th |
| Eugene [2] |
60 |
190º |
16:40 PST, 7th |
70 |
190º |
16:40 PST, 7th |
| Salem [3] |
25 |
200º |
19:17 PST, 7th |
31 |
280º |
18:00 PST, 7th |
| Portland [4] |
25 |
300º |
18:32 PST, 7th |
31 |
300º |
18:32 PST, 7th |
| Washington: | ||||||
| Quillayute [5] |
8 |
150º |
12:24 PST, 7th |
10 |
150º |
12:24 PST, 7th |
| Olympia [6] |
13 |
200º |
23:20 PST, 7th |
16 |
200º |
23:20 PST, 7th |
| Sea-Tac |
16 |
230º |
12:56 PST, 8th |
21 |
230º |
12:56 PST, 8th |
| Bellingham |
16 |
140º |
12:53 PST, 7th |
21 |
140º |
12:53 PST, 7th |
| AVERAGE |
25.0 |
190º |
32.8 |
215º |
|
Table 4 Notes: [1] Peak 2-minute wind at Cape Arago (CAR03) C-MAN station was 75 mph at 15:10. Peak gust was 93 mph at 15:09. Both observations were out of 248º. Given these extreme speeds at Cape Arago, the very high speeds at the inland station of Eugene, and the fact that data interruptions occurred at North Bend, quite likely the reported maximums for the North Bend airport are low. [2] Peak 2-minute wind of 60 mph is indicated in the February 2002 issue of Local Climatological Data (LCD), by the National Climatic Data Center. As time of occurrence is not included in the LCD data, the time indicated for peak wind is for the maxmum wind in the 5-minute data available for the storm, which was 58 mph out of 190º at 16:40. [3] Peak wind of 18 mph at Salem is the last of three occurrences, the first having been at 18:00 and out of 260º. Note that in the daily climate summary for Salem, peak wind is noted as 25 mph out of 270º and peak gust 31 mph out of 280º, time of occurrence is not mentioned (time of 18:00 PST estimated from METAR reports). [4] Peak wind for Portland noted in the daily climate summary was 25 mph out of 300º, time of occurrence not mentioned and estimated from METAR reports. [5] Peak wind of 8 mph for Quillayute is the last of three occurrences, the first having been at 10:35 PST. [6] Readings for Olympia are from the dialy climate summary, and times are a best guess from the METAR reports. |
|
February 7, 2002: A Climatology The February 7, 2002 windstorm was not unique in its selective punishment of the Southern Willamette Valley. There's historical precedent for this kind of storm, which will be termed the "South Valley Surprise", or SVS. For similar events that weren't surprises, South Valley Storm will suffice. From a logical standpoint, it makes sense that a cyclone can crash ashore along the central Oregon coast and trigger a high-wind event in the southern valley, while sparing northern areas. And it, indeed, has happened before, fairly recently. November 15, 1994 had just such an event, though there were some marked differences, and the January 9, 1880 Storm King was a close "northern" cousin to the SVS. The powerful March 27, 1963 windstorm is another event that followed a track about 75 miles north. The 1963 storm developed in a synoptic situation quite similar to the February 7, 2002 event: secondary spinup along the base of a stacked low in the Gulf of Alaska. More recently, on December 16, 2002, a developing secondary cyclone followed a similar path to the February 7, 2002 event. This one, however, didn't generate damaging winds in the South Valley. Comparisons between the two storms of 2002 offers some insight into what went right during the February storm for high winds, and what wasn't in place for the December event. Not all episodes of sharp wind contrasts between the two ends of the valley are considered "classic" SVS events. On March 1, 1982, Eugene reported a much higher peak gust compared to Salem and Portland (48 mph peak at EUG, with gusts in the mid-20s at the northern stations), but it was the result of a different mechanism--a microburst from a post-frontal shower. Another episode of high South Valley winds happened on February 24, 1961, with wind speeds quite comparible to the 2002 event, are from yet another cause--an unsusual case of punishing prefrontal southerly winds afflicting southwest Oregon ahead of a trailing cold front. |
|
Other Articles on the February 7, 2002 Storm (1) A summary by Tyree Wilde of the National Weather Service, Portland. (2) A summary by George H. Taylor of the Oregon Climate Service, Oregon State University. (3) Personal account from Tim Blood, with many photos of windthrow from around his home. |
|
Footnotes 1. On October 12, 1962, the Columbus Day Storm produced an extreme gradient of +24.0 mb between Arcata and North Bend. The November 13-14, 1981 windstorm achieved a maximum ACV-OTH gradient to +19.3 mb. The March 27, 1963 and October 2, 1967 windstorms both pushed the ACV-OTH gradient to +17.3 mb. Though the +19.5 mb "slope" on February 7, 2002 was very steep, it wasn't record-breaking, and a number of storms, including those above, have created gradients of similar strength. 2. The strong focus on the cyclone's surprise winds and widespread devastation at that time was probably due to the mind grasping at a situation that was a fitting natural metaphor for the September 11, 2001 terrorist attacks. |
|
References [1] Meteorological data for this entire section was provided online by the National Weather Service, Eureka, Portland and Seattle offices, and the Oregon Climate Service located at Oregon State University, and collected during and immediately after the storm, unless stated otherwise. [2] Oregon Daily Emerald, University of Oregon, February 8, 2002, in "Wind storm leaves campus in shambles." Information is from an interview with a National Weather Service meteorologist. Later corroborated by review of the 5-minute observations from Eugene Mahlon Sweet Field, supplied by the NCDC. [3] Eugene Register-Guard, February 8, 2002, in "Three men freed after tree flattens their pickup tuck," pages 1A and 8A. And February 9, 2002, in "Crews work to restore power," pages 1A and 7A. [4] The standard power law formula is Vh = Vr (h/hr)^1/7, where Vh is the average wind velocity at height h above the ground, Vr is the average wind at reference height h, and the power of 1/7 is the accepted standard for open country (which is typically found at airports). The version of the equation I'm using is from, W. A. Dalgliesh, and D. W. Boyd. "Wind on Buildings." Canadian Building Digest, CBD-28. Found online in 2002, originally published in April of 1962. [5] Information on destruction to trees and structures is from the Eugene Register-Guard, February 8, 2002, in "Surprise storm packing 70 mph gusts downs trees, damages property," pages 1A and 8A. February 9, 2002, in "Crews work to restore power," pages 1A and 7A. February 10, 2002, in "Thousands still without power," pages 1D and 7D. February 12, 2002, in "Pace of repairs draws fire," pages 1A and 5A. February 13, 2002, in "Storm forces concert cancellation," page 3C. [6] Information on the state of the power distribution system is from the Eugene Register-Guard, February 8, 2002, in "Surprise storm packing 70 mph gusts downs trees, damages property," pages 1A and 8A. February 9, 2002, in "Crews work to restore power," pages 1A and 7A. February 10, 2002, in "Thousands still without power," pages 1D and 7D. February 11, 2002, in "Continuing outages outrage customers," pages 1D and 6D. February 12, 2002, in "Pace of repairs draws fire," pages 1A and 5A. February 13, 2002, in "Hundreds wait to power back up," pages 1C and 6C. [7] Information on Damage to Lane and Linn Counties is from the Eugene Register-Guard, February 21, 2002, in "Windstorm toll high for Linn County buildings," page 2D. February 23, 2002, in "Counties may seek federal aid for damage," City/Region front page. [8] Information on schools is from the Eugene Register-Guard, February 8, 2002, in "Surprise storm packing 70 mph gusts downs trees, damages property," pages 1A and 8A. And February 10, 2002, in "Thousands still without power," pages 1D and 7D. [9] Article on the butternut tree appeared in the Eugene Register-Guard, February 19, 2002, in "Storm claims massive tree," pages 1A and 5A. [10] Meteorological data for the "The Early Forecasts" section was provided online by the National Weather Service, Portland, and collected during and immediately after the storm, unless stated otherwise. |
|
Page Last Modified: December 5, 2008 | Back | |