The Intense November
9-10, 1975 compiled by Wolf Read |
|
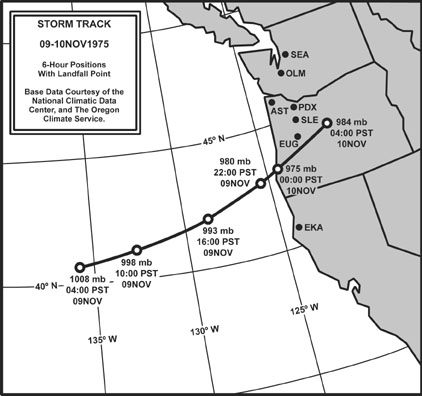
Introduction In early Noember 1975, a very intense 975 mb low raced ashore over North Bend, Oregon. This low likely generated the steepest gradients ever to besiege the Pacific Northwest in the 1948-2003 timeframe. Pressure tendencies matched the gradients, with the most intense short-period barometric changes anywhere in the Pacific Northwest for the same time period. As a result, very intense winds were carried far inland as the low moved eastward. Peak gusts reached the 100s on the Southwest Oregon coast, and hurricane force at Roseburg, one of the most wind-sheltered communities in the region. According to the Storm Data, November 1975, total damages reached $10 million (1975 dollars), which is considerable considering the localized nature of the strongest winds. Lows of similar intensity to the November 9-10, 1975 storm have followed different paths through the Northwest, resulting in damaging strikes in different regions. It is interesting to compare these events. For the landfalling cyclones, there's a fairly consistent max gust range at interior locations, with velocities at official stations peaking between 70 and 80 mph. Click on the links below to see other scenarios with 975-979 mb lows affecting the Northwest: Landfall near Newport: 977 mb October 2, 1967 Figure 1, below, details the November 9-10, 1975 storm's track, with central pressures and times noted. |
|
General Storm Data Minimum Pressures and Peak Gradients Table 1, below, is a list of the lowest barometric pressures, and time of occurence, for the November 9-10, 1975 windstorm. The storm's compactness is reflected in the single 28" reading--at North Bend--which is 0.30" lower than the next lowest value, 29.10" at Eugene. Also, 28.80" is one of the lowest barometric pressures ever recorded at North Bend, though several storms have pushed the barometer into the 28.70"-28.79" range, including the Columbus Day Storm and the December 12, 1995 superstorm. Source: Microfilm copies of the unedited surface observation forms, obtained from the National Climatic Data Center. |
|
Notes Table 1: [1] Also 29.50" at 20:00 HRS. [2] Also 29.39" at 21:00-22:00 HRS. [3] Also 29.23" at 02:00 HRS. [4] Also 29.42" at 03:00 HRS. [5] Also 29.45" at 03:00-04:00 HRS. [6] Also 29.56" at 04:00 HRS. |
Table 2, below, is a list of the maximum pressure gradients, and time of occurrence, for the November 9-10, 1975 windstorm. The +30.5 mb (+0.91") gradient between Arcata and North Bend is nothing short of phenomenal. It "blows away" the +24.0 mb (+0.71") maximum ACV-OTH gradient during the Columbus Day Storm (an offshore low), and the +18.9 mb (+0.56") reading from the February 7, 2002 cyclone, which also tracked inland near North Bend. This gradient, over such a short distance, is singularly unique. The narrower distance between Crescent City and North Bend showed +25.8 mb (+76.2") at 01:00, one hour after pressure minimum had been achieved at OTH (pressure was not recorded at CEC at 00:00). Simultaneous with the +30.5 mb gradient for ACV-OTH, there's a -20.7 mb (-0.61") gradient from OTH to AST. The Columbus Day Storm produced a maximum negative gradient of -10.7 mb (-0.32") at noon on the 12th, not even close. The positive gradient for this northward-trending storm reached +23.9 mb (+0.71") at 18:00. This is one of the strongest OTH-AST gradients on record. This demonstrates the magnitude of the negative gradient for the November 9-10, 1975 windstorm. It's unsual for a low to have such a steep north side, becuase the cyclones tend to develop in the base of northward-extending troughs. The 1975 low essentially made a sharp "V" in coastal pressure traces, a perfection usually reserved for hurricanes. Source: Microfilm copies of the unedited surface observation forms, obtained from the National Climatic Data Center. |
|
Pressure Tendencies The November 9-10, 1975 windstorm brought with it a major "pressure couplet" over much of Western Oregon, with strong pressure surges (+3.0 mb and higher) at stations that fell within about 150 miles of the storm's center. Table 3, below, shows the maximum hourly changes in pressure for eleven key stations in the Pacific Northwest. Though the tendencies in the Willamette Valley were fairly significant, really only one station stands out: North Bend. The hourly tendencies for North Bend look like the three hourly tendencies for a typical strong storm. For the time period 1950-2002, both the hourly -7.7 mb (-0.23") fall and the +16.6 mb (+0.49") hourly jump are unmatched by any other storm for any station in the Pacific Northwest (1950-2002). Hurricanes don't always produce pressure swings with this intensity! For presure fall, the November 3, 1958 windstorm holds the number two position, with a drop of -7.1 mb (-0.21") at Hoquiam, and for pressure surge, the February 7, 2002 tempest holds 2nd place with a +14.2 mb (+0.42") jump at North Bend. Third place candidates are -6.7 mb (-0.20") at Quillayute during the March 3, 1999 windstorm, and +13.9 mb (+0.41") at Hoquiam during the November 3, 1958 cyclone. There's generally a good correlation between maximum winds and maximum pressure tendencies with this storm, save maybe Eugene, which had an active barometer without signficant winds because the low center passed south of the station. The compactness of the low center is indicated by the limited nature of the extreme pressure changes--only North Bend shows particularly large magnitude swings. Source: Microfilm copies of the unedited surface observation forms, obtained from the National Climatic Data Center. |
| ||||||||||||||||||||||||||||||||||||||||||||||||||||||||||||||||||||||||||||||||||||||||||
Table 3 Notes: [1] The -2.6 mb hourly fall at Portland is the last of two occurrences, the other instance having occurred at 20:00. [2] The +1.6 mb hourly rise at Quillayute is the last of two occurrences, the other instance having occurred at 06:00. |
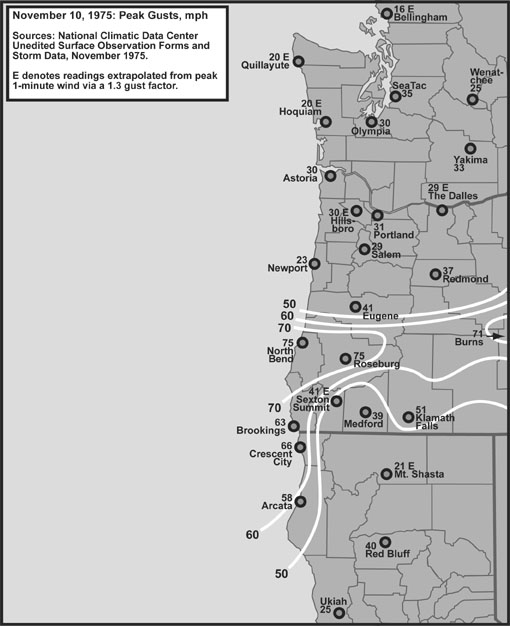
Peak Wind and Gust Table 4, below, lists the peak wind and gust for eleven key stations in the Pacific Northwest, their direction, and their time of occurrence. "Peak Wind" is a 1-minute average, and "Peak Gust" is an instant (approximately 1-second) average. The November 9-10, 1975 cyclone's eastward path across Southwest Oregon spared much of the Pacific Northwest a severe blow. For select regions, such as Oregon's South Coast, and California's North Coast, the storm struck particularly hard, and was an event to remember. Of particular note, Roseburg (not shown in table), typically a wind-sheltered location, likely recieved the strongest gale of the 1950-2002 time period during the November 1975 windstorm. The peak gust of 75 mph exceeded the gust of 69 mph from the March 27, 1963 event, and the 62 mph blast from the Columbus Day Storm. See the page on the March 27, 1963 event for more discussion on Roseburg gales. Source: National Climatic Data Center, undedited surface observation forms. |
| Location | Peak |
Direction |
Obs Time of |
Peak |
Direction |
Obs Time of |
| California: | ||||||
| Arcata | 25 |
280° |
02:58 HRS, 10th |
58 |
150° |
19:30 HRS, 9th |
| Oregon: | ||||||
| North Bend | 58 |
310° |
01:50 HRS, 10th |
75 |
310° |
01:05 HRS, 10th |
| Astoria [1] | 20 |
010° |
01:57 HRS, 10th |
30 |
020° |
00:33 HRS, 10th |
| Medford | 28 |
150° |
20:58 HRS, 9th |
39 |
150° |
22:33 HRS, 9th |
| Eugene | 29 |
360° |
01:55 HRS, 10th |
41 |
360° |
01:36 HRS, 10th |
| Salem | 17 |
320° |
03:55 HRS, 10th |
29 |
320° |
03:07 HRS, 10th |
| Portland | 22 |
340° |
03:55 HRS, 10th |
31 |
340° |
04:07 HRS, 10th |
| Washington: | ||||||
| Quillayute [2] | 15 |
290° |
11:55 HRS, 10th |
20 |
290° |
11:55 HRS, 10th |
| Olympia [3] | 17 |
230° |
10:55 HRS, 10th |
30 |
270° |
13:50 HRS, 10th |
| Sea-Tac | 20 |
340° |
05:55 HRS, 10th |
35 |
340° |
05:13 HRS, 10th |
| Bellingham [4] | 13 |
360° |
02:53 HRS, 10th |
17 |
360° |
02:53 HRS, 10th |
| AVERAGE | 24.0 |
272° |
36.8 |
265° |
Table 4 Notes: [1] Peak wind at Astoria last of two occurrences, the other having happened at 17:55 on the 9th, out of 070°. [2] Peak gust at Quillayute is estimated from a peak wind using a standard 1.3 gust factor. [3] Peak wind at Olympia last of two occurrences, the other having happened at 04:42 on the 10th, out of 020°. [4] Peak gust at Bellingham is estimated from a peak wind using a standard 1.3 gust factor. |
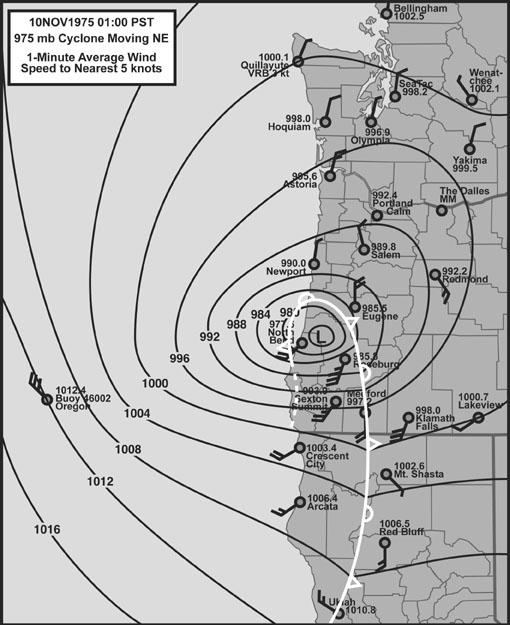
November 9-10, 1975 Windstorm Discussion Figure 2, below, is a surface map depicting conditions at 01:00 PST, November 10, 1975, the time when the low center had just passed through the Coos Bay area. One significant feature of this storm is its extreme compactness. Keep in mind that the isobars have been drawn in 4-mb increments. The lines are so tightly packed around the center that they look like the 1-mb intervals of a more typical storm. More commonly the kind of gradients represented here are reserved for hurricanes. The November 9-10, 1975 windstorm is yet another example of an extreme storm in the Pacific Northwest. Compare this map to the windstorm of November 3, 1958, another very intense event. Data from the map is from the NCDC, unedited surface observation forms, and the Oregon Climate Service, available surface maps. |
|
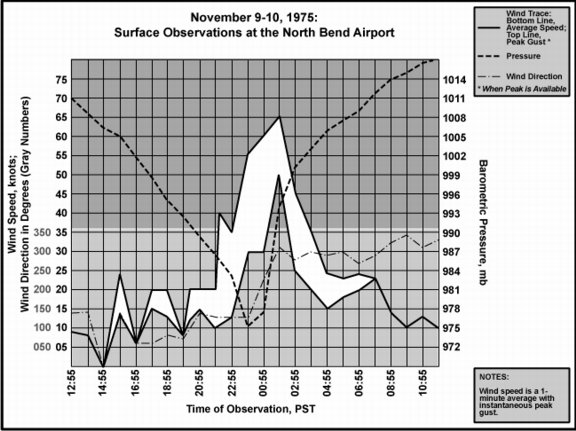
Figure 3, below, charts wind and pressure conditions at North Bend, centered on the arrival of the storm. The extreme barometric V-trace and associated wind stands out sharply. Compare this to Astoria during the Columbus Day storm. For North Bend, the November 9-10, 1975 windstorm approached the magnitude of the great gale of 1962. Sorry about the knots and millibars in this meteogram. I try to be consistent. This figure was used in a professional presentation, requiring the more "official" notation. Data from the map is from the NCDC, unedited surface observation forms, and the Oregon Climate Service, available surface maps. |
|
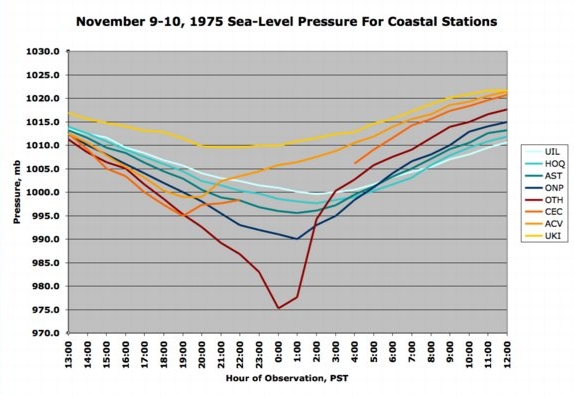
Figure 4, below, charts sea-level pressure for coastal stations from Ukiah to Quillayute. The compact nature of the low is evident with the trace for North Bend, which jumps out strongly compared to the other stations, even those nearby, such as Newport, Crescent City (which has missing data) and Arcata. Data from the map is from the NCDC, unedited surface observation forms, and the Oregon Climate Service, available surface maps. |
|
Last Modified: March 25, 2004 You can reach Wolf via e-mail by clicking here. | Back | |