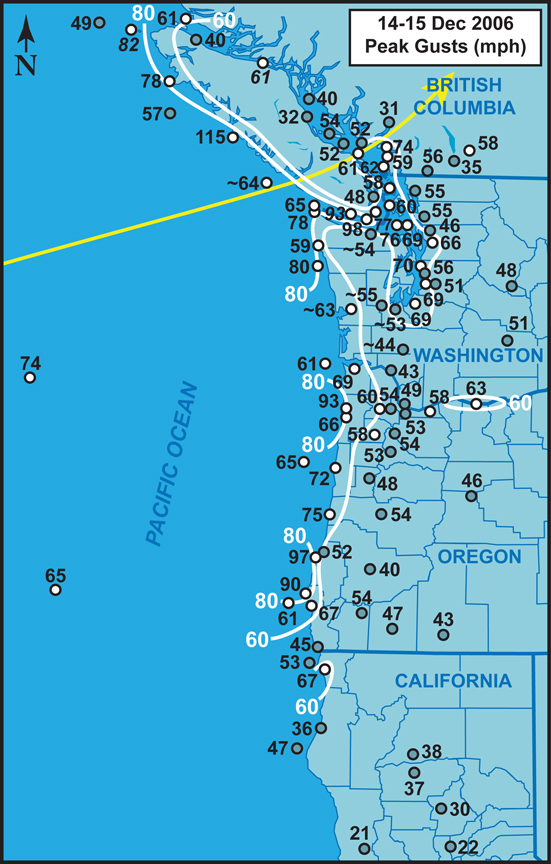
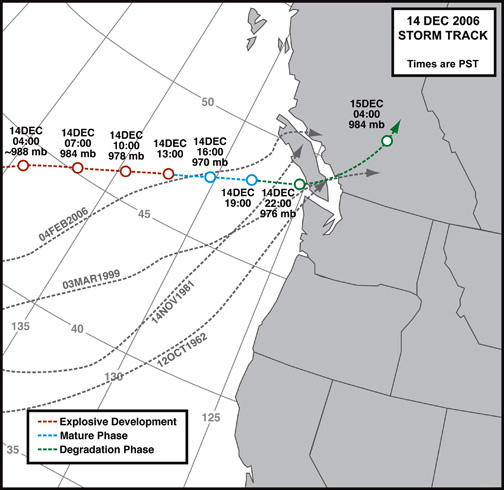
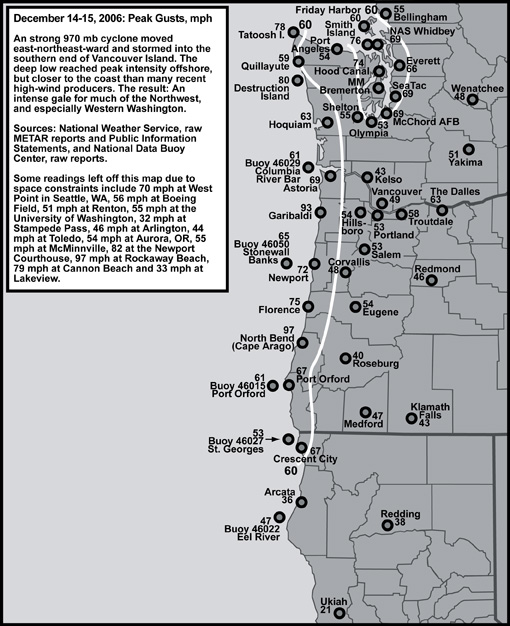
On December 13, 2006, in the heels of an intense 957 mb (28.26") low that moved into the Queen Charlotte Islands, an extratropical cyclone developed in the North Pacific far off the shore of southern Oregon, out beyond 140ºW. Over the course of December 14th, this low traveled ENE at a fairly rapid pace and deepened to about 970 mb (28.64") as it neared the north tip of the Olympic Peninsula. By this time, around 16:00 PST, the low had become very large, with a steep pressure gradient reaching all the way down to the Mendocino Coast of California. Damaging, and in some cases extreme, winds raked the Pacific Coast from CA to Vancouver Island, and surged inland, slamming the Willamette Valley with 48 to 58 mph peak-gusts officially, and the Puget Lowlands with gusts up to 69 mph at Sea-Tac. For Oregon, the highest winds occurred in two phases, with some peak gusts occurring around 16:00 in the warm air advection field post-warm front as the low neared, and some peaks happening around 20:00 with the arrival of the storm's strong cold front. For Washington, many places experienced peak gusts around 01:00 on the 15th, in what some people have begun to call "The Surge," as the cyclone's intense bent-back occlusion swept inland.
Wind-wise, this was the most powerful storm for the Seattle Area since the January 20, 1993 Inaugural Day Storm. For the south Willamette Valley this was the most powerful event since the February 7, 2002 gale, and for the greater Portland Metro area, including Aurora, Hillsboro and Troutdale, the December 2006 storm was likely the strongest since January 16, 2000.
This powerful storm challenged the old notion that Pacific Northwest windstorms tend to be dry. Intense rainfall accompanied this cyclone as the leading warm front, fed with copious tropical moisture, swept into the Pacific Northwest. Another burst of heavy rain accompanied the cold front in some areas. Areas of Seattle experienced some of the heaviest short-period rainfall on record, with hourly rates reaching around an inch. Flash floods inundated some low-lying areas. All this precipitation fell on top of soil that had been saturated by earlier December storm systems, and one of the wettest Novembers on record for many areas (a weather event worthy of it's own web-page).
Saturated soil loses it cohesion, and doesn't hang on to trees' roots very well. Many shallow-rooted Northwest trees, such as the Douglas-fir, simply uprooted in the pummeling wind. The huge trees acted as hammers, smashing through surrounding vegetation, powerlines, homes and other structures--forced amplifiers. The long duration of high winds in many areas probably also exasperated the situation. The effect: For the Willamette Valley, many places experienced tree damage worthy of a windstorm with 65 to 70 mph gusts. For many areas of Washington, trees toppled with disturbing regularity--uprootings, shattered tops, broken trunks. The saturated soil is perhaps an equally significant factor to wind in the damage brought by this storm.
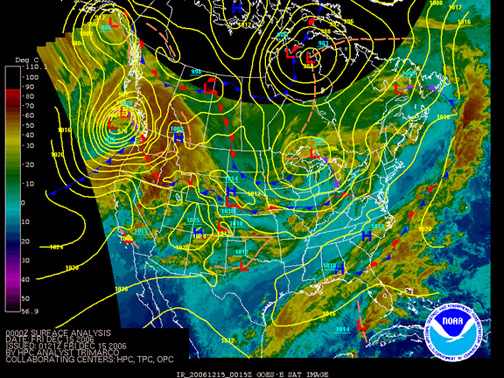
Figure 1, below, is courtesy of the Hydrometeorological Prediction Center, and shows the cyclone just off the Washington coast at 16:00 PST on December 14, 2006. In the tight gradient south of the low's center, winds had reached damaging levels in Oregon and parts of Southwest Washington by this time.
Here are my journal notes: |
December 14, 2006: Thursday
07:48 PST: (Beaverton, OR) Looks like we may have the real deal moving in this evening: The forecast is for a major windstorm. A very strong jet stream, about 190 knots, is supporting the development of an intense low to our west. In the 03:37 area forecast discussion from NWS Seattle, the low’s center was placed at 44ºN and 140ºW and around 988 mb. The models track this intensifying storm across southern Vancouver Island tonight, with a minimum central pressure of at least 972 mb. Could be more intense. A very sharp pressure gradient will move inland south of this cyclone’s center. High wind warnings are up for all of NW Oregon and western Washington west of the Cascades. The forecast for the Hillsboro area mentions winds escalating to 10 to 25 mph today, then 20 to 30 mph with gusts to 50 by evening, picking up to 30 to 40 mph with gusts to 65 tonight. This is a serious event. Wind gusts are expected to exceed 100 mph on the Oregon coast. In the westerly surge behind the low, locations along the Strait of Juan de Fuca could experience gusts in excess of 90 mph. Damaging winds are expected to begin later this morning on the coast.
Here’s the latest water vapor image: |
|
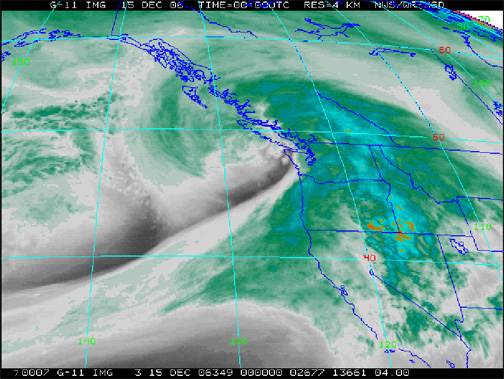
| Figure 2: Water vapor satellite image showing the December 14-15, 2006 cyclone. The center has reached about 142ºW along about 45ºN, and was around 984 mb. Time is 07:30 PST on December 14, 2006. |
|
Currently we’re getting moderate rain with periods of heavy at times. In the hour ending 06:50 at Hillsboro, 0.27” of precipitation accumulated. At 07:50, the temperature was 44ºF with a dew point also of 44ºF. The warm front is still far offshore, with buoy 46005 (46ºN 131ºW) showing a wind shift from ESE to SSW in the past two hours and a temperature climb from 49ºF to 56ºF between 03:00 and 06:00. The barometer there, at 06:00, showed 989.0 mb and falling, with winds of 27 mph gusting 31. At Hillsboro, the hourly sea-level pressure has been:
| Time |
SLP (mb) |
Wind Dir |
Wind Speed (mph) |
| 01:00 |
1018.0 |
SSE |
7 |
| 02:00 |
1016.4 |
ESE |
6 |
| 03:00 |
1015.1 |
SE |
5 |
| 04:00 |
1013.8 |
ESE |
5 |
| 05:00 |
1012.2 |
E |
3 |
| 06:00 |
1011.0 |
SE |
3 |
| 07:00 |
1008.0 |
SSE |
10 |
| 08:00 |
1007.4 |
Calm |
Calm |
As is evident from the table, pressures have already fallen at rates approaching 3.0 mb / hr here, an ominous sign. Note: the times in the table have been rounded from the usual 50-minute past the hour record for HIO, so that 08:00 is actually 07:50. At Astoria, the pressure at 07:50 was 1003.4 mb (29.63” alt) and falling at 2.2 mb / hr, also with heavy rain and E winds at 12 mph. Temperature 46ºF with a 45ºF dew point. 08:37 PST.
11:07 PST: The warm front has moved through Astoria, with the temperature up to 55ºF as of the 10:55 observation, and winds up to SSW 25 mph gusting 49 with heavy rain and the barometer down to 999.3 mb (29.51” alt). Newport’s 10:50 report showed 54ºF and SSW 43 mph gusting 53. This event is certainly showing potential on the coast.
Inland, the warm front pushed through Eugene around 06:20, with the temp up from 48ºF at 05:50 to 52ºF, and a wind shift from SSE to S. As of 10:50, the temp is now 57ºF, with S winds at 18 mph. Gusts to 25 mph occurred at 08:15 with 20 mph 2-minute winds. The barometer at Eugene is 1008.2 mb (29.77” alt) and slowly falling. The warm front kicked through Salem just after 08:50, and S winds were 23 mph gusting 29 as of the 10:55 obs, with 57ºF. Barometer 1004.7 mb (29.67” alt). Here, the temp is just starting to rise, at 47.3ºF on the Davis, and it is calm. At Hillsboro, the 10:50 obs showed 45ºF, calm, 1004.1 mb (29.65” alt) and light rain. The front is slow-moving, and it usually takes extra time for the cold air around the mouth of the Columbia Gorge to erode out, as, I suspect, the cold pool is usually deeper here. Yeah, PDX shows ESE 16 mph and 47ºF, with 1004.2 mb (29.66” alt) at 10:55. A soaking 0.62” of rain has fallen there in the 6 hours ending 09:55.
The barometer continues to show a declining trend at Buoy 46005, with 984.8 mb at 09:00. Winds still are not particularly exceptional, with SW 27 mph gusting 34. Now, at Buoy 46002, 42.6ºN and 130.3ºW, the winds have been picking up as of late, with SW 45 mph gusting 56 at 09:00, and a barometer at 997.8 mb. Note that there’s a 13.0 mb gradient between the two buoys. That’s pretty steep, but gradients have been much steeper in the past. At Tatoosh Island, pressure falls have picked up considerably, with a drop from 1000.8 mb at 09:00 to 996.6 mb at 10:00. East winds are roaring at 47 mph gusting 54. Yep, the low center seems to be driving right toward the tip of the Olympic Peninsula.
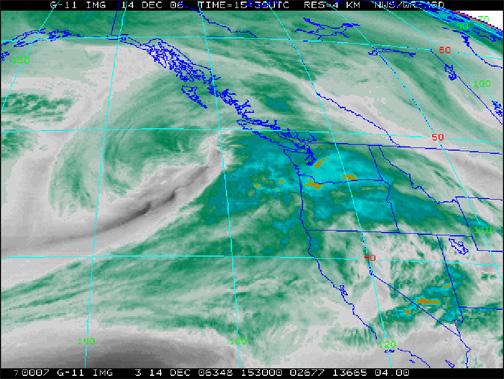
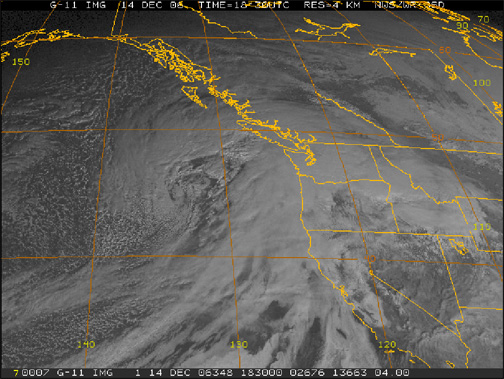
Here’s the 10:30 PST visible satellite image, showing a nicely developing storm: |
|
|
| Figure 3: Satellite image of the deepening cyclone taken at 10:30 PST on December 14, 2006. The bent-back occlusion exhibits a sharp curl, the mark of an already deep cyclone. Central pressure had fallen to about 978 mb by this time. With an average central pressure drop of about 2.0 mb/hr for the past three hours, this storm had clearly undergone explosive cyclogenisis. |
|
The center looks to be around 45.0ºN and 133.0ºW. 11:29 PST.
12:15 PST: The warm front has surfaced here now. It’s a toasty 54.2ºF on the Davis and still climbing. A steady, soaking rain continues (my rain gauge appears to be plugged at the moment), and south winds have begun with 10-minute averages up to 5 mph. The barometer is 29.57” and starting to fall fast. 12:18 PST.
13:08 PST: The wind has really picked up now, with a gust to 21 mph on the Davis [Note: This anemometer is at 2 meters above ground level, next to a two-story building and surrounded by trees--wind challenged to the extreme]. I can hear the roar through tree limbs and around eaves. Barometer now down to 29.53”, and the temperature is 56.3ºF with a dew point of 54ºF. Rain continues, with the steady thump of drops off of the building and other structures.
In the Valley, winds have picked up considerably in areas. At 12:50, Salem showed S 26 mph gusting 32, with a peak of 39 mph at 11:59. Aurora was S 24 mph gusting 35 with a peak gust of 39 at 12:04. McMinnville showed S 28 mph gusting 39, and with a temp of 59ºF. Portland showed S 21 mph gusting 31, with the recent windshift from ESE to S around 12:10.
The coast is really beginning to feel this storm. At 12:50, Newport reported SSW 44 mph gusting 66. Astoria, at 12:55, had winds of S 31 mph gusting 51 with a peak gust of 55 mph at 11:57. The pressure was 995.0 mb (29.38”) at Astoria with that last obs, down 2.2 mb from the hour before. The south winds and rising temperatures hit Hoquiam around 12:30, and by 12:50 had accelerated to 30 mph gusting 45. Quillayute had S 15 mph gusting 30 by 12:50, with the barometer down to 989.4 mb (29.22” alt). At Tatoosh, around 13:00, east winds had begun to slack, down to 38 mph gusting 48, after a maximum of 55 mph gusting 64 at 11:00. The barometer showed 988.5 mb and had only dropped 0.6 mb from the hour before.
Buoy 46005, at 11:00, the most recent observation, showed 981.6 mb (28.99”) with SW winds of 29 mph gusting 36. The pressure at 46002 at 11:00 was 997.5 mb, indicating a +15.9 mb gradient (climbing!), and SW winds had escalated to 49 mph gusting 65 by 12:00 (pressure 996.7 mb).
Looking at more exposed locations: Over the past few hours, gusts have reached 85 mph at Cape Blanco, and 70 mph at Garibaldi. All these readings seem to be following the forecast well. Indeed, the storm may be moving a bit faster than expected. 13:38 PST.
14:16 PST: Just went outside to get the mail. Heavy wind gusts buffeted me in the warm, 56.7ºF air. The wind roared. Pine trees creaked. Small twigs broke from the sycamores. Trees and leaf-bear branches gyrated. The wind is easily gusting 35 to 40 mph right now. On the Davis, the average has bumped up to 12 mph at times, with gusts to 24. HIO shows a gust to 33 mph recently. The barometer continues to fall quickly, at 29.45” now.
Wow, the power just flickered. A blackout would mean being cut off from my internet weather data. Hmmm. 14:20 PST.
14:23 PST: Just had a long, drawn-out gust to 27 mph on the Davis. Sustained at 24 to 25 mph for four to five obs cycles (say 10 seconds or so). Loud. 14:24 PST.
14:27 PST: We had another long gust, this one to 28 mph. Ten-minute average to 13 mph now. 14:27 PST.
14:32 PST: At 14:15, Astoria reported S winds of 37 mph with a gust to an astounding 69 (dir 190 time 14:15)! Now, it looks like their anemometer is off-line. No wind report at 14:20, but we have the $ notation which means there’s a problem.
Cold front appears to have passed Buoy 46002. Winds are west now, at 49 mph gusting 63, and the barometer is up at 998.5 mb. This is at 13:00. At Buoy 46005, at the same time, winds were WSW 27 mph gusting 36 and the pressure was down to 977.5 mb (28.87”). The gradient is now 21.0 mb. Wild. The temperature is going down at 46005, so it seems that the low center is passing near there right now. 14:42 PST.
15:02 PST: Just had a long and thunderous gust to 31 mph on the Davis. The trees really were swaying! I suspect wind gusts are reaching 40 to 45 mph at official height right now. This is getting pretty intense. It’s 57.6ºF, with a dew point of 53ºF, cloudy, stratus, light rain. 15:05 PST.
15:05 PST: Salem’s 14:55 report shows S 26 mph gusting 41, Aurora at 14:50 showed S 23 mph gusting 43, McMinnville stopped reporting wind after 13:50, when winds were S 28 mph gusting 38. PDX winds were S 25 mph gusting 38 at 14:55, with a peak gust of 40 mph at 14:43, and HIO at 14:50 showed S 22 mph gusting 32, with a peak gust of 39 mph at 14:28 PST. Troutdale had a peak gust of 36 mph at 14:33 and Vancouver leads the pack with 44 mph at 14:35.
Astoria is reporting again, with S 36 mph gusting 67 at 14:55, and a barometer at 991.3 mb (29.28” alt), down 1.5 mb in the last hour. Newport continues to get pummeled with SSW 45 mph gusting 60 at 14:50 and an altimeter of 29.51”, making for a OTH-AST gradient of about 7.8 mb.
I hear the wind roaring again… Watching the Davis… 21 mph. The barometer is now 29.41”. It’s been through a period of relative steady-ness, now falling again it seems. 15:16 PST.
15:21 PST: The 15:10 observation from Newport: SSW 45 mph gusting 72!
We recently had another 28 mph gust on the Davis. The lights flicker from time-to-time. 15:22 PST.
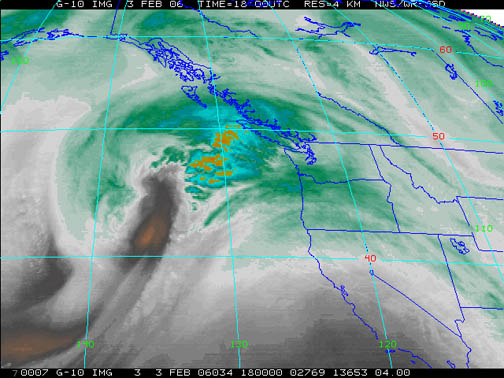
16:31 PST: Took stuff to the trash in a wind-swept moderate rain. Got soaked. Lots of fresh twigs on the ground now. Currently, the wind seems to have backed off a tad. Barometer is 29.36” and appears to be unsteady. Here’s the 16:00 PST water vapor image, a view of a classic, organized Pacific storm: |
|
| Figure 4: The storm's center had reached about 128ºW and 48ºN by 16:00 PST, broadened and deepened to around 970 mb. Compare this to the size, form, and position of the February 3-4, 2006 windstorm at 10:00 PST on that day, included below this image. The December storm had approached close to the coast while still in the explosive development stage--this likely explains the strong 50-mph+ gusts in the Willamette Valley, which usually only receives 40 to 45 mph gusts from cyclones tracking so far north. By the time the February cyclone had crossed the 128ºW, it had reached a much more mature stage, and had weakened, sparing the region even stronger winds. |
|
The cold front appears to be nearing the Washington coast in the image, at least in the upper levels. At 15:50, south winds continued at Quillayute at 17 mph gusting 33, and the barometer was a low 984.6 mb (29.08” alt). No frontal passage yet. At Tatoosh Island, east winds at 15:00 gave way to southerly by 16:00, and are going at 41 mph gusting 48. The barometer was 981.9 mb (29.00”).
At 16:00, HIO reported S 29 mph gusting 46! The gusts appear to be climbing ever higher into the damaging range around the Metro Area. At 15:50, Aurora reported 33 mph gusting 48. Looks like we are indeed nearing the 50 mph mark in gusts. Indeed, McMinnville has exceeded that threshold: S 36 mph gusting 51 at 16:35!
16:47 PST: Correction, MMV’s peak gust was 190º and 55 mph at 16:16 PST! Very near the high-wind criteria mark. 16:48 PST.
16:50 PST: All right, it looks like the front, and perhaps even the low center, has passed buoy 46005 now. At 15:00 winds were tearing at NW 51 mph gusting 67, and the barometer had jumped to 981.5 mb from a low of 977.4 mb at 14:00, a 4.1 mb surge. 16:52 PST.
16:53 PST: Note: It seems the buoy observation times are AKS instead of PST. This accounts for the seeming “delay” in the reports. 16:53 PST.
17:02 PST: At 16:50, Aurora reported SSW 29 mph gusting 52, McMinnville S 31 mph gusting 45, and Hillsboro S 24 mph gusting 40. At 16:55, Portland reported S 25 mph gusting 38 with a peak gust of 40 at 15:17, and Salem showed S 29 mph gusting 39, with a peak gust of 46 at 16:32.
For the ~17:00 obs, the SLP at EUG was 998.7 mb (S 25 mph gusting 37), and the SLP at PDX was 994.2 mb, making for a gradient of +4.5 mb up-and-down the Valley right now. Most major events produce +8.0 to +10.0 mb, so we’ve got a ways to go yet. 17:09 PST.
17:10 PST: The lights have been flickering considerably for the past hour or so. Already prepared candles. 17:11 PST.
17:19 PST: A slamming, light-dimming gust of 33 mph just whipped past the Davis. This was a long burst: 29, 33 then 30 before dropping off. 17:19 PST.
18:20 PST: There’s a definitely lull in the wind here right now, with the 10-minute average down to 9 mph on the Davis. It had been ranging from 12 to 14 mph earlier.
It appears that Newport has been lost now. The last wind report was SSW 54 mph gusting 70 at 16:30. Astoria is out again, too, with the last wind report SSW 36 mph gusting 69 at 15:35. 18:22 PST.
18:30 PST: My significant other's on her way home. She’s using the Intel shuttle, then Max. With the lull in the wind, it seems like a good time for her to come home.
The barometer is now 29.33” and falling again. The storm’s cold front approaches, and apparently the strongest winds will be associated with this feature.
Pressures on the Washington coast are getting downright low. At 18:25 PST, the altimeter at Hoquiam read 29.11”, and the SLP at 17:50 was 987.4 mb (29.15” alt). Winds at 18:25 were S 36 mph gusting 52. Quillayute at 17:50 had a SLP of 982.2 mb (29.00” alt). And at 18:00, Tatoosh Island had 978.8 mb (28.90”) with south winds of 44 mph gusting 52. 18:36 PST.
18:37 PST: Wow, the 16:00 AKS obs from buoy 46005 is impressive: NW 56 mph gusting 72, with the SLP at 987.2 mb, marking a +5.7 mb surge in the last hour. Looks like some places will have impressive pres jumps when the cold frontal boundary passes. 18:40 PST.
19:29 PST: The Davis barometer is showing 29.36” and rising now. The 10-min average wind is down to 5 mph, but a big gust just slammed through! Up to 22 mph on the Davis. I wonder if the next phase of the storm is beginning--the arrival of the cold front. 19:30 PST.
19:38 PST: Gust 31 mph on the Davis, a real slammer, and quite drawn out. Here comes another… Didn’t hit so directly, just 18 mph. Yes, the wind seems to be on the upswing again, with the 10-minute average at 9 mph now. Temp 53.6ºF, dew point 44ºF and RH 71%. 19:39 PST.
19:41 PST: The lights have been flickering again, sometimes going completely dark for a brief moment. I’m sensing greater... (I was going to write “instability”) Oops, they just went out! Blackout! 19:41 PST.
19:42 PST: No more internet connection. Yerg! Lights still out. However, they’re still running just to the south, across the street. Whole complex out. 19:45 PST.
21:09 PST: The power is still out. Good thing my laptop battery was fully charged. Still have 90% charge to go. I’ve got a candle by the Davis. The pressure is now up to 29.46”, and the wind periodically roars through the trees and buffets the building, but it just doesn’t seem as intense as before. We have an 8 to 9 mph 10-minute average. Of course, some of the lower wind readings on the Davis could be due to a wind direction change, perhaps more to the SSW. The temp is 49.9ºF and falling. It seems that the cold front may have already passed through the region. Given the tight gradients behind the front, it’ll probably be blustery all night.
I’m worn out from an exciting weather day. I think I’ll go to sleep soon. 21:17 PST.
December 15, 2006: Friday
02:02 PST: (Beaverton, OR) The power came back on at 01:56, so it was down for a little over six hours.
According to the surface observations, strong winds did continue in the Valley up until about midnight. Some preliminary peak gusts include 53 mph at Portland, 48 at Corvallis, and 54 mph at Eugene. I’ll get more data later today or tomorrow.
Looks like the low tracked across the tip of the Olympic Peninsula as a 976 mb system. Some impressive pressure jumps in that region. 02:25 PST.
December 16, 2006: Saturday
09:29 PST: (Beaverton, OR) I’m in the process of collecting the METAR data for the last seven days to cover the period of the windstorm. This was a major event in Washington--looks to be the biggest since 20 Jan 1993. SeaTac had a peak gust of 69 mph! Many places in the Sound area had gusts between 60 and 70 mph.
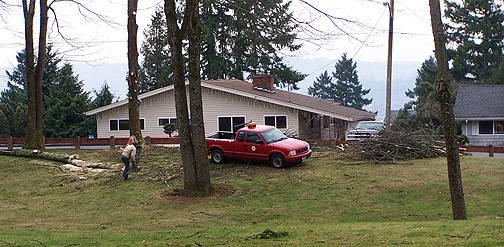
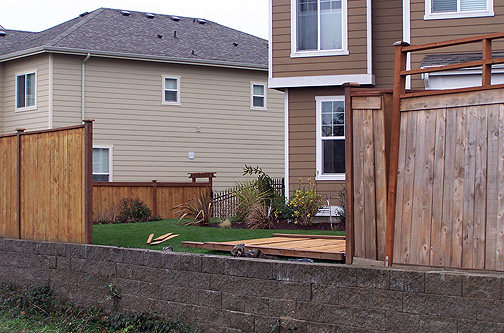
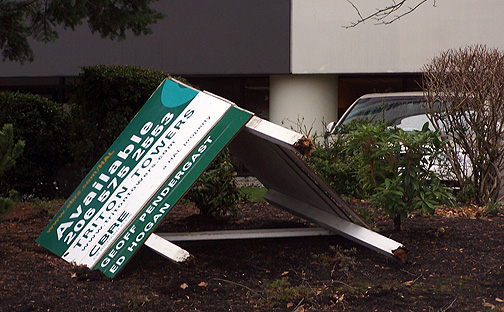
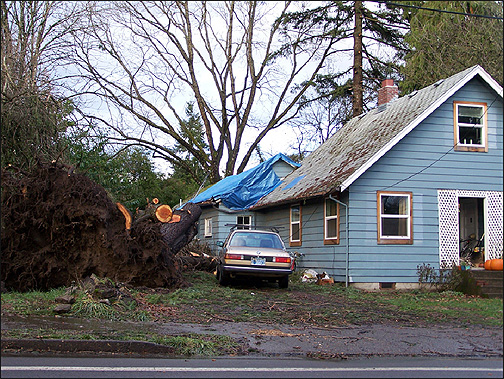
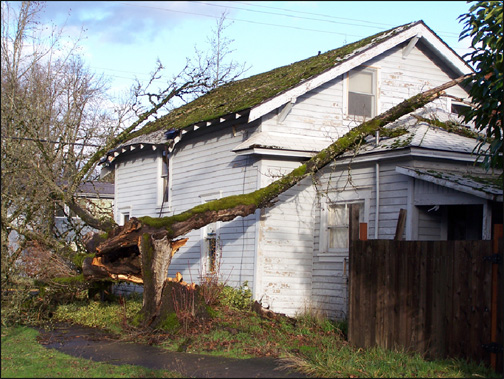
Based on the SkyWarn spotter reports, the north [Oregon] Coast Range got slammed pretty hard. A house was reported destroyed by falling trees there, and areas of swathing were also noted. So, yesterday, between 10:00 and 14:00, I drove out there to take a close look. I brought my camera, and got some photos, but I haven’t downloaded them yet. Indeed, there was considerable damage in places out there. Significant tree-falls began to show themselves from about Forest Grove westward. Though I saw one sizeable Douglas-fir down on the shoulder of Hwy 26 east of Forest Grove, and a small blue spruce was also uprooted in Hillsboro. Indeed, in the Hillsboro area, many large wooden signs, the kind done in a open triangle with two boards and three heavy posts, had been upended. One smashed a chain-link fence. Some of these had their posts clearly sunk in the ground by 18 inches or more before the storm. A wooden fence in my neighborhood, along Center Street, was also broken.
Getting back near Forest Grove, a small lot of trees on the north side of someone’s house suffered multiple uprootings. Indeed, many of the wind-falls that I saw on the trip were due to root failure, a clear sign that the saturated ground contributed to the problem. Swollen streams, and deep, muddy puddles abound in the region, indications of very saturated conditions.
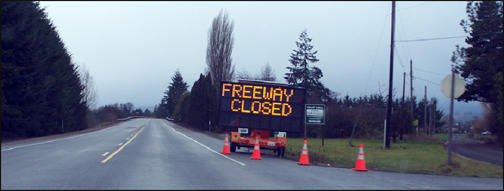
Hwy 26 was closed due to wind-thrown trees. Indeed, I heard a report on NPR that mentioned at least 300 trees down across Hwy 26. Hwy 6 was also closed. Fortunately Hwy 47 to Vernonia was open. Just barely--there were many locations where trees had fallen across the road, some large Douglas-firs, but they had been cleared away quickly. Broken power lines were evident along parts of the highway. Branches and twigs covered the road in places. Along a riparian area right next to the road, I saw one swath of trees down, mostly Douglas-fir and red alder, say maybe encompassing a quarter acre. Lots of single trees down in areas, sometimes striking and breaking others. Around a sharp bend, one Douglas-fir stem was suspended between the trunks of two other trees.
Periodic showers of heavy rain, snow and sleet accompanied me on part of this trip. It was cold!
I saw some small trees down in Vernonia, but did not see the smashed house. Indeed, aside from lots of twiggy debris down, Vernonia seemed to be operating fairly normally, though I expect that their power was out at the time.
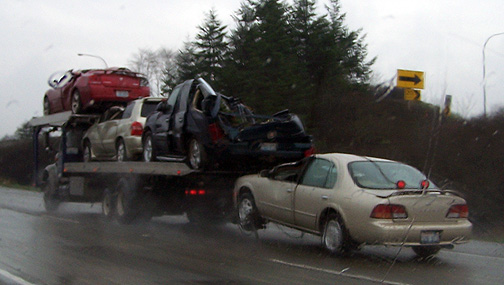
I also heard on the radio that at least 350,000 customers in Oregon lost power during the storm, and somewhere around 1,000,000 in Washington. Four people died in Washington, one from a tree that smashed her truck (also involved a serious injury to another), one from colliding with a fallen tree, and a woman got trapped in her basement and drowned. I don’t know the details about the fourth [this would be updated to about 14 deaths in ensuing days, many due to carbon monoxide poisoning from running generators and gas grilles indoors, or in garages]. Both the Evergreen Point and Hood Canal floating bridges were closed at the height of this storm, one of the hallmarks of a significant event. Wind gusts reached at least 72 mph at the Hood Canal. I’m half tempted to drive to Renton to see what happened in the Powerlines. Maybe tomorrow, or Monday.
I better get back to data collection. I’m currently at the Willamette Valley, so here are the official Peak gusts:
Willamette Valley Peak Gusts, 14 Dec 2006, in mph:
| Location |
Direction |
Speed |
Time |
| Eugene |
250 |
54 |
19:30 |
| Corvallis |
180 |
48 |
16:15 |
| Salem |
220 |
53 |
19:37 |
| McMinnville |
190 |
55 |
16:16 |
| Aurora |
220 |
54 |
20:45 |
| Hillsboro |
220 |
46 |
15:58 |
| Portland |
220 |
53 |
19:51 |
| Troutdale |
230 |
58 |
20:07 |
| Vancouver |
220 |
49 |
20:19 |
| Scappoose |
160 |
36 |
15:55 |
The peak gusts in the Valley tended to cluster around two time periods, the first one around 16:00 in the middle of the warm air advection post-warm-front, and the second around 20:00, the time of cold frontal passage. The warm advection gale tended to be from the south, whereas the post-cold front attack was from the southwest. Note that Scappoose’s last report was at 18:53 on the 14th, and there has been no data since. The highest gust may be lost, as the cold front may not have pushed completely through the region by this time. Also, McMinnville has an interesting peak wind report from the 23:53 PST observation: PK WND 220104/0729, which if it were to be believed suggests that a gust of 120 mph occurred at 23:29 PST, out of the SW. This notation did occur during a 3.1 mb/hr pressure jump at a time of elevated SW to WSW winds, 23 mph gusting 48 in the regular report, but it is so far out of line with other readings in the Valley, I have chosen to disregard this unusually high value.
Now we’ll take a look a peak gusts from the Puget Lowlands, after I copy across the coastal station data:
Puget Lowland Peak Gusts, 14-15 Dec 2006, in mph:
| Location |
Direction |
Speed |
Time |
| Olympia |
190 |
53 |
23:44 |
| Shelton |
210 |
55 |
15:54 |
| Tacoma |
210 |
68 |
23:33 |
| SeaTac |
220 |
69 |
00:44 |
| Renton |
180 |
51 |
00:40 |
| Boeing Fld |
190 |
56 |
01:24 |
| Everett |
180 |
66 |
22:46 |
| Arlington |
190 |
45 |
22:55 |
| Navy Whidbey |
250 |
69 |
02:17 |
| Friday Harbor |
220 |
60 |
02:24 |
| Bellingham |
160 |
55 |
23:49 |
Note that some of these stations experienced significant reporting outages, and likely the true highest gust during the windstorm was missed: OLM, SHN, PWT (this last station stopped reporting on the 13th!). SeaTac’s powerful peak gust of 69 mph was noted with lightning to the distant south, so it may have been convectively induced, and was probably associated with the bent-back occlusion. A gust of 68 mph out of 220º followed shortly after, at 00:59. Winds gradually tapered off after that. [Ed. note: Tacoma's peak gust was actually 69 mph--the data in the above tables is preliminary.]
The Dalles received a peak gust of SSW 63 mph at 00:09, so not even the Gorge escaped this wild weather event. 17:11 PST.
December 17, 2006: Sunday
09:23 PST: (Beaverton, OR) I mentioned the showers of rain, snow and sleet that followed the big windstorm on Friday. These were the product of extreme instability in the atmosphere that day as very cold air aloft moved in behind the cyclone. By the time I got home, around 14:00, one of those showers rolled right over my home. The sky darkened fast, and a mixture of snow, sleet and rain began to fall. Two loud peals of thunder rolled over my neighborhood, and the air became turbulent and gusty, with the trees gyrating strongly. Shortly after, the precipitation shifted completely over to rain, the sky lightened, and the shower passed to the southeast. Sunshine glistened on the freshly dampened ground.
This morning, it got very cold. A hard freeze. On the Davis, the low reached 25.6ºF, which is the coldest low we’ve had this winter season. At Hillsboro, the temp dropped to at least 22ºF, but an overnight reporting outage makes the value a little uncertain.
Indeed, our power went out again, starting at about 20:00 last night. This outage seems to have affected the HIO ASOS, as that’s about when the reports stopped. Just like last time, the outage did not affect my significant other's home, nor the four-plex on the other side of the fence, nor the business district across Center Street. It seems that, for us, the power didn’t come back on until after midnight. We had a fire in the fireplace and watched a movie on a laptop, for a cozy evening.
In any event, it's apparent that the grid hadn’t been completely repaired as of early this morning. It’ still unstable. I went to Washington Square yesterday. On the way back, I noticed a pine tree suspended on a line right next to Highway 217. I suspect that there’s probably a lot of this kind of thing that still has to be dealt with. Indeed, weakened trees may still be toppling--that’s the nature of having the soil so saturated. Yesterday morning, there was a lot of work being done at Cedar Hills Park. It seems some trees were being removed. I don’t recall seeing any down when I drove by there on Friday, but I didn’t give the park a thorough look. Nevertheless, it seems like the crews may have been removing trees that had been weakened by the storm and were now considered hazards. I hope to get by there at some point. 09:40 PST.
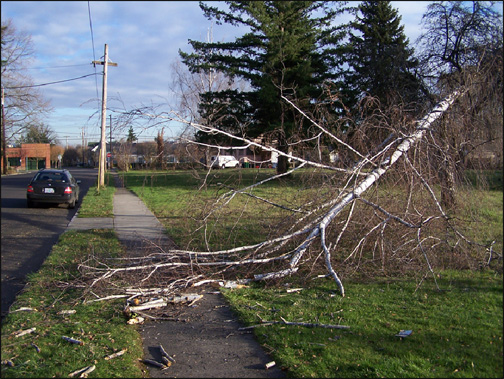
16:28 PST: Returned about an hour ago from a birthday party. On the way back from the party, we encountered more windstorm damage due to running a few errands along surface streets, instead of heading back on Hwy 217. I found a broken birch tree a few blocks north of the Beaverton Library: |
|
| Figure 5: Snapped birch tree left debris across a sidewalk in Beaverton, OR. December 17, 2006. |
|
The top shattered right on the sidewalk. Good thing no one was strolling there at the time!
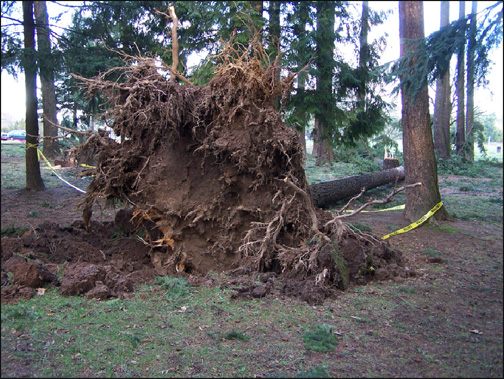
We also drove into Cedar Hills park, where, indeed, some trees did topple. Two largish Douglas-firs uprooted in the dense stand at the park. One collided with another Doug, and damaged it so severely that crews cut it down. A broadleaf tree out in the open section of the park split at its base. Here’s a photo of the largest Douglas-fir that fell: |
|
| Figure 6: This Douglas-fir uprooted at Cedar Hills Park in Beaverton. This kind of tree failure was a fairly common sight throughout much of the storm-afflicted region. December 17, 2006. |
|
Saturated soil almost undoubtedly contributed to these tree failures. However, given the dense carpet of branches and twigs that were shed at this park, and elsewhere, it is certain the wind also had a fairly strong punch.
Other incidents of damage in our greater neighborhood include a large oak branch cracking in the older subdivision to our west, and a large western redcedar branch breaking in a yard not too distant from the library. Saw more big three-poster wooden signs down in Tigard as well.
Now for some photos from my 15 Dec damage tour to Vernonia. Here was a common sight on various routes out of Portland, often due to windthrow: |
|
| Figure 7: Highway 6 near Forest Grove, OR, December 15, 2006. This was a common sight the day after the storm. |
|
According to a radio report, apparently for a time during the event, probably overnight on the 14th to 15th, much of the Willamette Valley had been “shut in” by the windstorm, due to tree-failure-induced road closures as well as blizzard conditions in the Oregon Cascades. I saw one Skywarn spotter report of I-5 southbound being shut down to our north due to trees in the road. Don’t know about the northbound lanes.
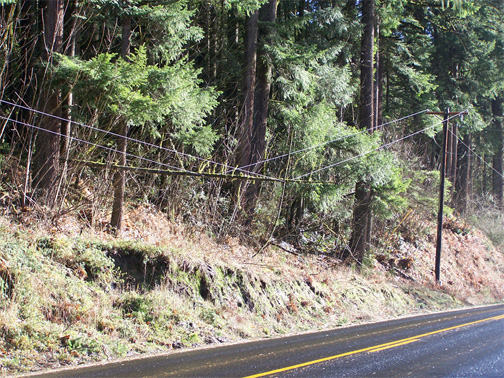
Areas of Highway 47 had many trees down, and often the broken boles crashed into power lines. This shot is perhaps a mile north of the Hwy 26 junction: |
|
| Figure 8: Powerlines sag under the weight of a toppled snag along Highway 47 south of Vernonia, OR. Further down the road, larger trees teetered and broke the lines. December 15, 2006. |
|
In the above case, the tree wasn’t heavy enough to break the lines. However, just south of this point, around a small bend, a much bigger Douglas-fir broke through the lines, leaving them loose and dangling over many pole-sections. I couldn’t get a good shot of this due to lighting, and very limited space in which to pull over.
December 21, 2006: Thursday
09:21 PST: (Beaverton, OR) On Tuesday, I awoke fairly early, say just before 06:00 and began reading e-mail. I got a message from a person on Renton Hill that the tree damage was considerable around there, and that he saw many transformers blow, lighting up the night. This was enough to convince me to head straight for the greater Seattle area and take a look at the windstorm’s effects for myself. I was on the road before 08:00.
From the Portland area up to about mile post 65, which is south of Chehalis, light damage, usually consisting of broken tree branches, was the rule. However, there were pockets of more intense damage, including a woodlot that lost several large trees just north of Vancouver. Also north of Vancouver, an Oregon white oak had one of its large branches snapped clean. In Portland, an Atlas cedar snapped along I-405. Most tree-falls in this region, however, were uprootings, with stem breaks often of secondary nature, being the result of an uprooted tree colliding with its neighbors on the way down.
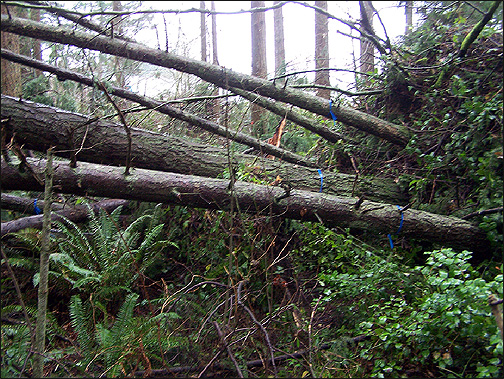
This also was the typical story in the heavier damage zone north of MP 65. Clearly, the heavy rainfall in November, and the intense rain burst that preceeded the winds Thursday evening last week, significantly weakened the soil and made many trees vulnerable to toppling. In the region between MP 65 and Olympia, there were many large hinge-falls, comprised of tree clusters who’s shallow roots had interlocked. |
|
| Figure 9: At an I-5 rest stop south of Olympia, many large Doulgas-firs were prostrated. Trees with interlocked roots sometimes fell as one, as this photo demonstrates. The shallow-rooted trees lifted a thin, flat plate of soil and duff in what is known as a hinge fall. December 20, 2006. |
|
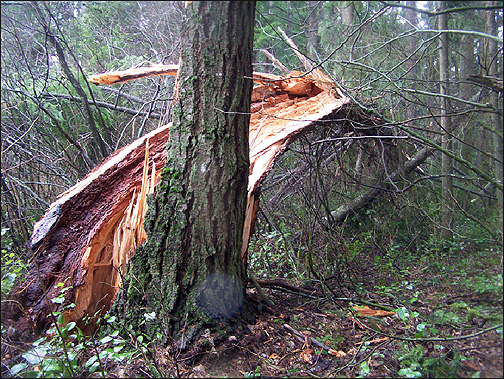
The above photo is an example from the south-bound I-5 rest stop just south of Olympia. I took this photo yesterday afternoon, on my way back home. Looks like the whole forest floor was pulled up--that’s a very shallow layer of soil, a big flat plate. Many trees toppled in the woods that surrounded this rest stop, easily more than a dozen. Some were quite sizeable Douglas-firs, like this one: |
|
| Figure 10: At the same rest-stop as the hing-fall in Figure 9, a large Douglas-fir snapped at its base. This tree clearly had a pathological condition that weakened the stem, evidenced by the dark, rotten wood in the lower left of the photo. December 20, 2006. |
|
The strength of the above Douglas-fir was clearly compromised by some kind of injury that let dry rot, and wood-boring insects invade the trunk. Often, it is the sick and weakened trees that topple in a typical, or endemic, Northwest windstorm. It usually takes unusually strong, or catastrophic, winds to snap healthy trees. Such winds are rare and tend to occur with multi-decade intervals in the interior sections of the Northwest.
Of the many things I saw on the drive to Renton, quite a number of trees fell onto I-5, especially the south-bound lanes. Near MP 86, a giant cottonwood tree crashed across the interstate, and its crown reached deep into the median. More typically, Douglas-firs and western redcedars were shoved down by the gusts, their roots pulled from the soil, and typically only reached into the shoulder area of I-5, or had their tips reaching into the outside lane. Many, many highway signs--I lost count past ten--were shoved over by the wind. Most of the time, the wooden 8x8 posts were just pulled out of the ground. Sometimes the posts snapped. The signs with concrete foundations and steel poles did well--I didn’t see a single one down. A tree-farm’s narrow green-belt, which screened I-5 post-recent-clearcut, lost many of its large evergreen trees, and some of these crashed onto the highway. Douglas-firs with their tops snapped clean off stood out starkly around Olympia. Uprooted conifers adorned the Fort Lewis grounds. And many, many broken hardwoods, such as alders and cottonwoods, livened the landscape with their bright, raw breaks. The giant digital billboard near Tacoma was running with full power, but clearly the computer operating it had an interruption—the sign just displayed the boot-up screen for a WinTel system.
Indeed, the power interruption caused by the gale was among the most talked about on the radio. On Tuesday, there were still at least a quarter million customers without power in Washington! As of yesterday afternoon, about 100,000 customers remained without power, and the reports indicated that some wouldn’t be restored into early next week. At the height of the power interruption, no less than 1.1 million customers lost electricity in WA. In OR, an additional 350,000 lost electricity. This was largely due to significant loss of the high-voltage main-feeder lines that come in over the Cascades. Apparently, according to a radio interview, there were at least 84 trunk-lines lost during the storm. A friend sent me an e-mail on Monday that his power was still out in Olympia, and people that work with my mom are still without power. Indeed, one of her colleagues had both his cars smashed by a tree.
At Renton, I first toured the Rolling Hills Condominiums, and noted little wind damage there--of course, most of the big trees were gone anyway, due to past property management. I then went to Phillip Arnold Park. Tree damage there was considerable--the most that I had seen since the great 14 Nov 1981 gale. Several bigleaf maples were snapped on the west side. And a large cherry tree up on the hill suffered a sharp stem break, as this photo depicts: |
|
| Figure 11: At Phillip Arnold Park in Renton, WA, a sizeable cherry tree cracked under the storm's powerful blasts. This was one of at least three trees that broke at this location. The woodlot in the background, the "Northern Woodlot" also suffered many tree losses to the gale. December 19, 2006. |
|
Considerable tree damage occurred in the Northern Woodlot, which can be seen behind the cherry tree in the photo, with several maples and birches breaking. A Pacific madrone lost its top. Wooden fences that lined the new subdivision, which lies to the left (east) of this photo, were broken by the gusts. Some homes had rod-iron fences--these did well.
Tree damage, often snapped hardwoods, abounded throughout the Powerlines area, in the Southern Woodlot, and in the apartment complex that’s built right in the center of the high-voltage corridor. The two downed trees in the photo below were at the latter location: |
|
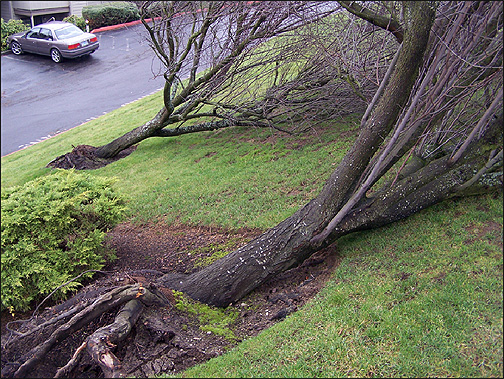
| Figure 12: Two trees uprooted at this Renton apartment complex, among others. December 19, 2006. |
|
The drone of chainsaws sounded in the distance, as crews worked to clear the woodsy debris from Phillip Arnold Park.
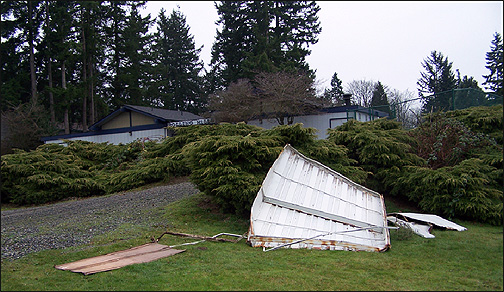
Heavy gusts yanked a metal storage shed from a yard and left it flattened and strewn around the park to the east of the Southern Woodlot: |
|
| Figure 13: A metal storage shed disintegrated under the force of the storm's fierce blasts. Renton, WA. December 19, 2006. |
|
Another such metal shed nearly rolled onto Petrovisky Road. Shingles were peeled from some house roofs in the region. Some rain gutters were stripped from eaves.
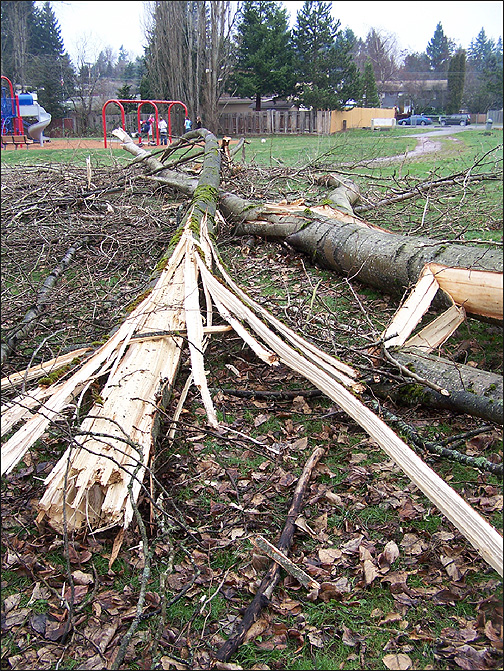
At Cascade Park, many large trees broke. Tall, thick, cottonwoods grow in beautiful groves around this park. Several of these trees were simply shattered by the wind, and their impact with the ground. Some landed near the play structure, but there was enough open area to prevent a direct impact: |
|
| Figure 14: Two cottonwoods snapped at Cascade Park, in Renton, among a number of other trees. The park workers getting ready to clean up this mess informed me that a Pacific madrone several feet in diameter toppled at a different park--they had worked on that mass of wood a few days before. December 19, 2006. |
|
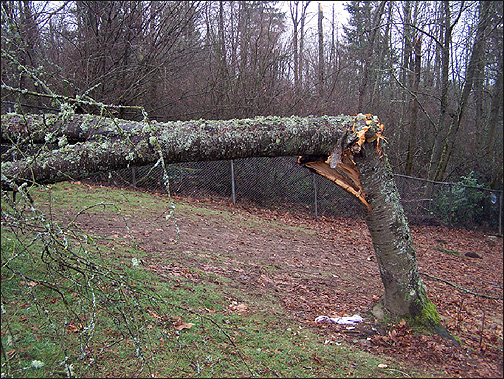
Nearby, to the right and just out of the photo, a Douglas-fir in a yard uprooted, fell into the park, crashed through another tree, stripped off its branches, and then smashed a chain-link fence.
As mentioned before, the amount of tree (and other) damage was very reminiscent of the 14 Nov 1981 gale. The available evidence suggests that the same level of wind that afflicted SeaTac, gusts in the 60 to 70 mph range, struck the Renton Hill area. Clearly, the level of damage is in excess of all other windstorms between 14 Nov 1981 and 14 Dec 2006, save perhaps the Inaugural Day storm of 1993. 10:47 PST.
December 22, 2006: Friday
12:55 PST: (Beaverton, OR) I’m back for a continued examination of our big windstorm. Incidentally, last night, a heavy rain shower cascaded through, making a watery roar reminiscent of distant ocean surf, and achieving no less than 1.43”/hr short-period rates on the Davis. This was part of a weak impulse that rolled in behind a modest cold front that pushed through Wed to Thu morning, making for a damp drive home.
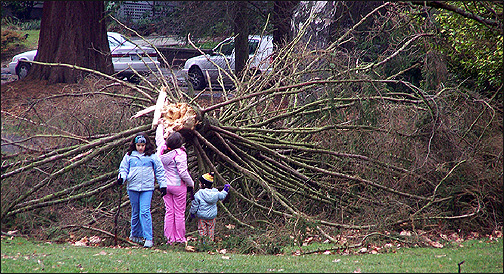
After I had done my Renton survey, I decided to head into Seattle to talk to Mom and Dad. As I drove in, Dad toured the Capitol Hill area, including Volunteer Park, and got a number of photos. He noted that the damage at Volunteer Park was the most he had ever seen. Here three children examine the broken crown of a Sitka spruce the park: |
|
| Figure 15: A broken Sitka spruce gets the attention of curious children at Volunteer Park in Seattle. December 19, 2006. |
|
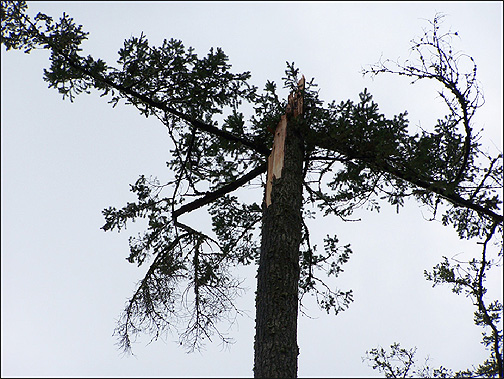
A pine tree also lost its top, and its broken trunk stood next to another pine that had been broken in a storm long ago, perhaps 20 Jan 1993, and had developed a new, full crown. A western redcedar toppled, and a Pacific madrone lost is top, among damage to a number of other trees, including the loss of very large branches from some.
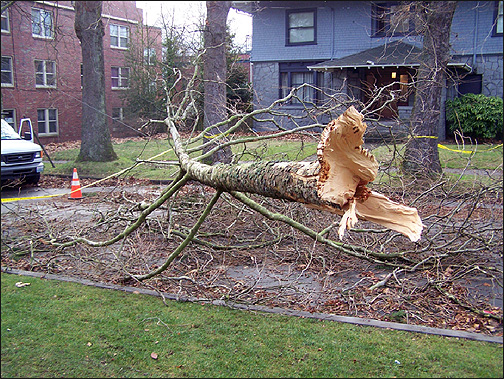
Big trees and branches also fell on city streets outside of the park, including an elm that uprooted, pulled up the sidewalk and then shut down an intersection with its massive bole. An old sycamore dropped one of its massive branches. The limb somersaulted downward and crashed right into the middle of the street, as this picture below shows. The middle tree on the other side of the street lost the branch. |
|
| Figure 16: A sycamore dropped a huge branch onto a Capitol Hill street in Seattle. Though difficult to see, this branch is tangled in a powerline. December 19, 2006. |
|
Events like the broken sycamore above, happening regularly over a very large region, resulted in a very disruptive storm. 13:17 PST.
December 27, 2006: Wednesday
18:53 PST: (Beaverton, OR) Went to Corvallis yesterday. Eager to see what the 14-15 Dec windstorm did at Avery Park, I took a stroll with camera in hand. Already I had seen evidence of some significant tree damage on our way into town--a couple cottonwoods along the Willamette River had snapped, a western redcedar lost its top along Hwy 34, and two Oregon white oaks lost gigantic branches on the same stretch of road, one perhaps a foot in diameter. As I walked, sunshine poked between ragged, shallow stratus, the remains of a front that had pushed through overnight and into the morning. Rain, mist and fog shrouded the landscape on the drive down.
Incidentally, a series of juicy fronts had raked the region of the past four-to-five days, each bringing around 0.50” to 0.75” of precipitation to the Hillsboro area. The 120-hour (5-day) total for HIO has been 2.54” in the hour ending at 18:50 tonight. One storm, from Sat eve to Sun morning, brought heavy rain, with several hours ranging from 0.20” to 0.24” per hour at HIO. Rain was even heavier to the south, with Eugene receiving 3.68” in the 120-hours ending 18:50. Coastal stations had even more: Crescent City had a deluge with 6.04” in the past 120 hours, and North Bend shows a whopping 6.41”, with 0.47” falling in a single hour on one occasion.
All this precipitation, on top of the wet, wet November we had, and previous storms this month, made for very muddy conditions at Avery Park. Indeed, area rivers and creeks were flooding. Farm fields along Hwy 34 were under water in places. Muddy water filled the Willamette River up to its banks. Oak Creek had grown to the size of a river. A lake sat over the community garden at Avery Park. These were the conditions that greeted me at the park, with a cool, moist breeze, very fresh air, and periodic sunshine lancing between fast-changing clouds.
I recall a couple of years ago, after biking through Avery Park on many occasions, thinking that one day, many of the tall Douglas-firs in the park would come down. This is because the trees simply didn’t seem that healthy. The Dougs, and in some cases, grand firs, had small, irregular crowns, with thin trunks. They grew in a highly disturbed area, with lots of open, grassy ground. And, being surrounded by seasonal wetlands, the trees’ roots couldn’t have been that deep.
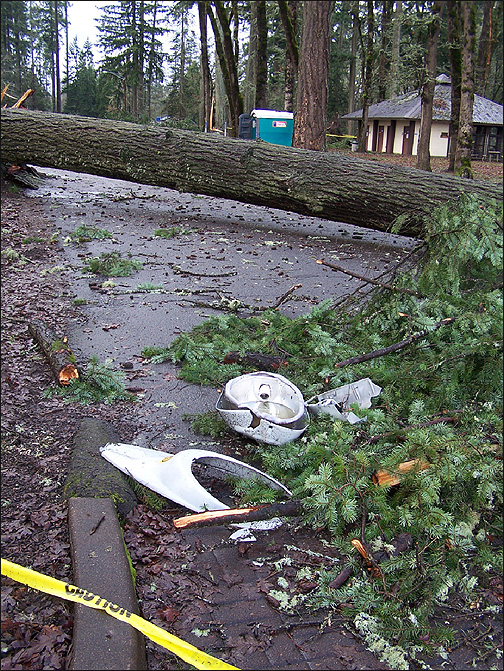
The 14-15 Dec windstorm met my expectation. With the soil seriously compromised due to saturation, and a long period of wind gusts in the range of 45 to 50 mph, many of the big trees simply didn’t make it. My count was somewhat rough, but no less than 42 large trees toppled at Avery Park, many of them Douglas-firs, with a few grand firs, western redcedars and bigleaf maples mixed in. Almost all the trees that fell were on the shallow knoll that contained the main driveway and parking area. At least three trees crashed completely across the road, one right at the entrance. The park was completely closed. Trees smashed into the covered cooking area where I’ve attended all my forestry gathers, busted street lights and snapped powerlines. One upended a section of concrete and threw large, heavy blocks around. Many tree losses were hinge-falls, with very shallow root plates pulling from the ground. A few stem-breaks occurred, but in nearly every case, this kind of damage happened to trees that had been previously injured and showed considerable heartwood rot, or some other kind of pathological feature. Some stem breaks were caused by the large, uprooted trees as they crashed into their neighbors.
I took about 120 photos of the damage, getting images of most every tree that broke. I’m including a few of the more striking shots below. Note how little has been cleaned up--the amount of disruption was clearly overwhelming.
In the first photo, a large Douglas-fir blocks the entrance to the park. This tree also smashed a street light, the debris of which can be seen in the foreground. The tree, like many in the region, uprooted, with some of the roots snapping as the bole crashed to the ground. |
|
| Figure 17: A toppled Douglas-fir blocks the entranceway at Avery Park, in Corvallis, OR. Photo taken December 26, 2006, nearly two weeks after the windstorm. |
|
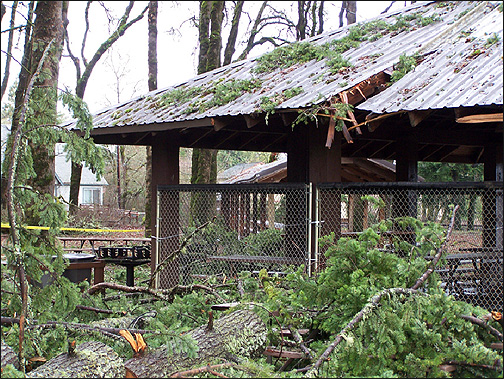
A Douglas-fir punched a sizeable hole through the roof of this gathering area, below. A total of three trees fell on top of each other here, two Dougs and one maple. |
|
| Figure 18: A toppled Douglas-fir crashed into this shelter at Avery Park, in Corvallis, OR. December 26, 2006. |
|
The next photo shows a top-break that occurred in one tall Douglas-fir. The crown crashed in the middle of the road and shattered. The battered trunk showed quite a bit of rot around the area of the initial break. Nevertheless, the raw damage was impressive. |
|
| Figure 19: A Douglas-fir snapped mid-trunk at Avery Park, in Corvallis, OR. December 26, 2006. |
|
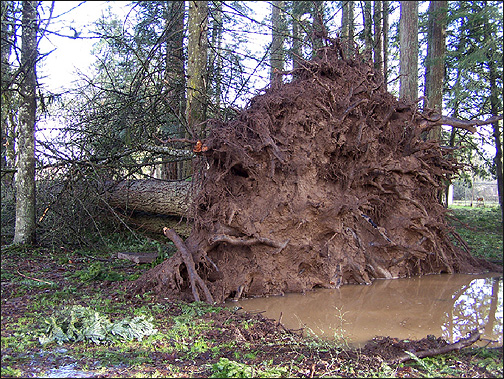
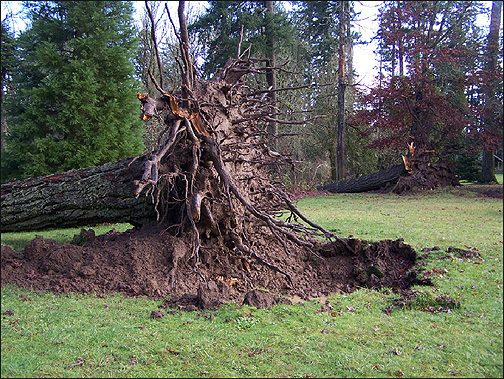
The hefty tree below demonstrates the most common form of tree loss at the park, via the hinge fall, and note the standing water in the hole left by the upended root mass: |
|
| Figure 20: Large hinge-fall, with the hole filled to the brim in muddy rainwater demonstrating the high soil saturation at Avery Park, in Corvallis, OR. December 26, 2006. |
|
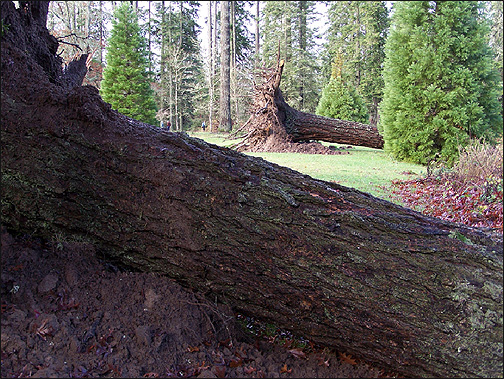
This next photo seems to capture the drama of the devastated park quite well, with two very large Douglas-firs toppled: |
|
| Figure 21: Multiple uprootings of large trees occurred side-by-side throughout Avery Park, in Corvallis, OR. In some cases fallen trunks crossed over each other. In one location, six trees toppled next to each other. December 26, 2006. |
|
And here’s another shot of the same two trees, but from the other side: |
|
| Figure 22: The same trees from Figure 21, Avery Park, in Corvallis, OR. December 26, 2006. |
|
Note the shallow roots that have been pulled straight out of the ground, and how the soil pretty much has fallen away from the root mass. Soil saturation clearly played a significant role in the destruction wrought by this windstorm. This covers Avery Park pretty well.
December 29, 2006: Friday
During the visit to Corvallis on 26 Dec, we saw two homes that were struck by trees during the 14-15 Dec windstorm. Both these residences were in older neighborhoods, which had plenty of large trees that could fall. Interestingly, it didn’t seem like many trees toppled on Witham Hill. I suspect this is because the trees are subjected to stronger winds in general and have developed in response, and that, perhaps, higher drainage rates on the slope might have resulted in reduced saturated soil conditions.
Here are photos showing the homes that were damaged by falling trees: |
|
| Figure 23: A tree-damaged home, in Corvallis, OR. Much of the tree had been cleared away by the time the photo was taken. December 26, 2006. |
|
In the above case, a fairly large conifer struck the rear section of the house, apparently damaging the roof. Much of the tree had been cut away by the time the photo was taken.
In the next photo, below, an old maple tree, with past injuries and a compromised, rotting trunk, snapped in the gale and clipped the eave of a house. Plus, the tree left one large branch resting on the roof. |
|
| Figure 24: Another tree-damaged home, in Corvallis, OR. This tree clearly had been compromised by past injury, which contributed to rotten trunk wood. December 26, 2006. |
|
Even on the 26th, downed lines were still present in Corvallis. Some were leftovers after repairs had been made. A few, usually for nonessential services like the street lights at Avery Park, simply weren’t fixed yet. |
|
Some Further Notes
The journal summary above demonstrates a windstorm that struck a particularly large region. Significant tree loss is documented from Corvallis, OR, in the south to Seattle, WA in the north. Based on official wind speeds, and news reports, this kind of damage stretched from about Eugene, OR to Whideby Island, WA, in interior sections, and from Crescent City, CA to southern Vancouver Island on the coast. The February 3-4, 2006 windstorm roared through a similar-sized region, but, in general, the measured windspeeds were generally less, and the damage simply wasn't as frequent. Not since January 16, 2000, has a windstorm caused such widespread disruption in the western Pacific Northwest, and the more recent event appears to have been the bigger one. Granted, heavy rains and saturated soil significantly contributed to the December 14-15, 2006 windstorm's impact. But nature works this way. Disasters tend to be the result of seemingly independent variables coming into phase at similar times.
How Deep Was the Low at Landfall?
Examination of stations on the Olympic Peninsula and southern Vancouver Island, where the low's center landed, reveal these minimum sea-level pressures;
| Location |
Minimum Pressure |
Notes |
| Quillayute, WA |
979.2 mb (28.92") |
|
| Tatoosh Island, WA |
977.2 mb (28.86") |
|
| Port Angeles, WA |
980.1 mb (28.94") |
|
| Tofino, BC |
979.4 mb (28.93") |
Data interruption. |
| Sheringham, BC |
980.1 mb (28.94") |
|
| Vancouver, BC |
981.0 mb (28.97") |
|
| Sisters Island, BC |
977.6 mb (28.87") |
|
Offshore, the lowest pressure at Buoy 46005, 46.1N 131.0W, was 977.4 mb (28.87"), Buoy 46036, 48.4N 133.9W, was 989.4 mb (29.22"), and Buoy 46206, 48.8N 126.0W, was 976.5 mb (28.84"). Looks like the low landed with a central pressure of about 977 mb, and there's some question about the actual minimum central pressure offshore--the low may not have been any deeper than 976 mb, though the Hydrometeorological Prediction Center indicates a possible minimum of 970 mb on its 16:00 PST map on December 14th (00:00 UTC 15 Dec 2006). In any event, it appears that the low had reached a mature stage (stopped deepening) many hours before landfall. |
|