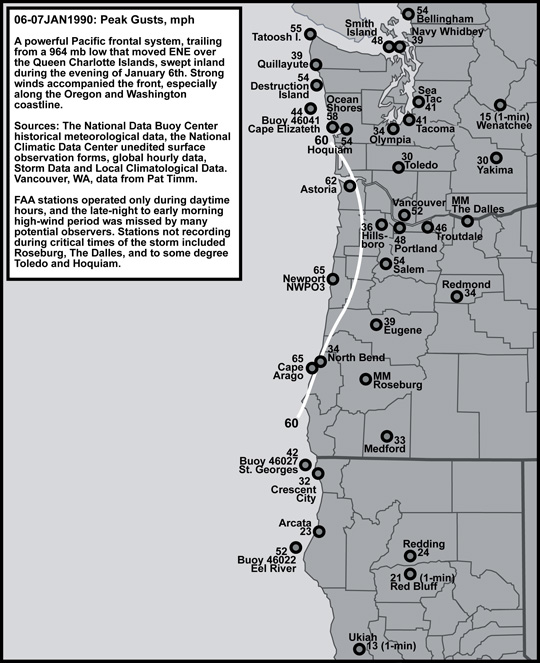
Figure 1: Peak gusts, January 6-7, 1990.
|
A Stormy Trio: January 6-9, 1990 compiled by Wolf Read |
|
January 6-7, 1990: Strong Front |
|
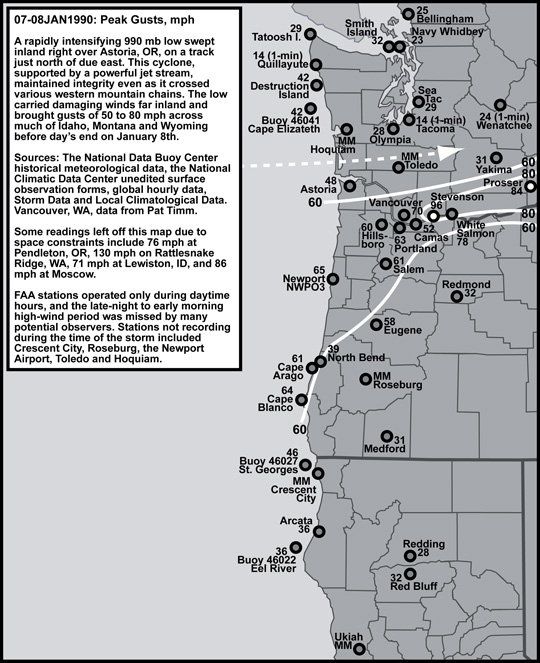
Figure 1: Peak gusts, January 6-7, 1990. |
|
On January 6, 1990, an intense 964 mb low moved ENE just north of the Queen Charlotte Islands. A powerful frontal system trailing southward from the low swept into the Pacific Northwest, bringing with it moderate to heavy rain and gale-force wind gusts. Aberdeen, WA, reported 2.43" of rain before day's end on the 6th, and Astoria received 1.23" by 04:00 on the 7th. Throughout much of the region stricken by gale-force wind gusts, trees lost branches or, in some instances, toppled outright. Homes and cars were sometimes at the receiving end of these falling giants, and in some instances suffered extensive impact damage. Widespread power outages occurred in many counties. This strong front led a series of vigorous storms. Figure 1, above, outlines some peak gusts for the January 6-7, 1990 event. The strongest winds were confined to the coast, with Cape Arago and Newport C-MAN station both showing maximum 5-second readings of 65 mph, which suggests that local instantaneous gusts of 75 mph probably occurred in the region. The Willamette Valley had 35 to 55 mph gusts, as did the Puget Lowlands and Northwest Interior. |
|
January 7-8, 1990: Storm King Event |
|
Figure 2: Peak gusts, January 7-8, 1990. |
|
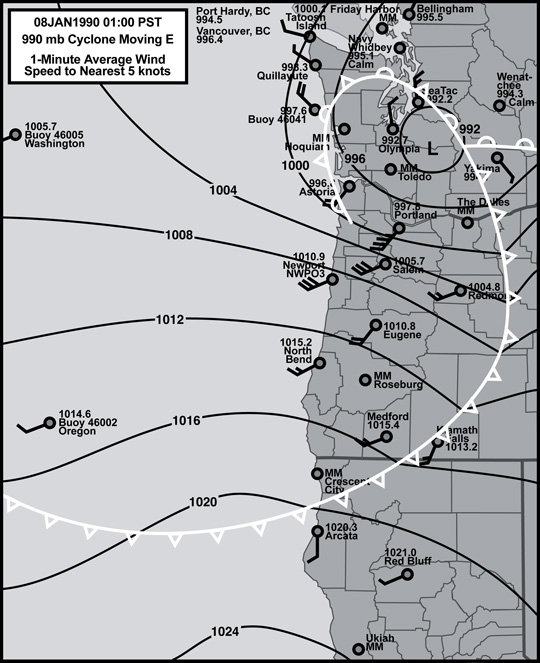
Supported by an incredible 150-knot-plus jet stream, a cyclone rapidly developed off the Oregon and Washington coast and quickly moved inland on a nearly due east track. The 990 mb system moved just north of Astoria, and just south of Olympia, carrying inland an intense pressure gradient that supported extreme wind speeds over Oregon. With much upper support, the low maintained integrity even as it crossed the rugged Cascades, the Columbia Basin and mountains further east. Behind the low, an extreme westerly wind surge tore through the Columbia River Gorge and carried across the eastern basin in a manner quite reminiscent of the November 3, 1958 windstorm. This storm resulted in a somwhat backwards peak wind outcome: Though strong wind gusts of 55 to 65 mph struck the Oregon coast and Willamette Valley, the fastest winds appear to have occurred in the Gorge and east of the Cascades. Peak gusts for the January 7-8, 1990 event are listed in Figure 2, above. As with the initial storm, peak 5-second gusts on the Oregon coast suggest possible instantaneous readings around 70 to 75 mph, perhaps even higher. The Willamette Valley was pummeled with high-wind criteria gusts of 58 to 63 mph, while the Washington interior sections, sheltered on the north side of the cyclone, experienced maximum gusts in the range of 20 to 30 mph. The powerful westerly surge in the Columbia River Gorge is reflected in readings around 75 to 95 mph. Figure 3, below, is an interpretation of surface weather observations taken at 01:00 on January 8, 1990. By this time, the fast-moving and intense low had just passed south of Olympia and Seattle. The region of sharpest pressure gradient on the south side of the low, near the tip of the bent-back occlusion, resides over northwest Oregon. One-minute average wind readings of 35 to 40 mph at Salem and Portland fall right within the area of tightest gradient. This is a classic example of a very strong, well-formed extratropical cyclone. |
|
Figure 3: Surface analysis map for 01:00 PST, January 8, 1990. |
|
These intense landfalling cyclones typically cause widespread damage immediately south of the storm center's track, and this event was no exception. A girl was killed on the Oregon coast when a wind-toppled tree struck her, and another fatality occurred during an auto accident related to very heavy rain. Property damage, typically from tree-struck homes and cars as with the first storm in the series, went into the many millions. At least 55 million board feet of timber toppled on state and federal lands in Oregon, though this figure likely includes the results of the January 6-7 and January 8-9 events. Indeed, given the protracted nature of the third event in the series, and it's extreme strike in Tillamook and Clatsop Counties, the January 8-9 storm may have caused the most windthrow. The track's location and the distribution of highest wind gusts place the January 7-8, 1990 cyclone in the "Storm King" class, which includes such intense events as January 9, 1880, December 4, 1951 and October 2, 1967. |
|
January 8-9, 1990: Protracted Wind & Flood |
|
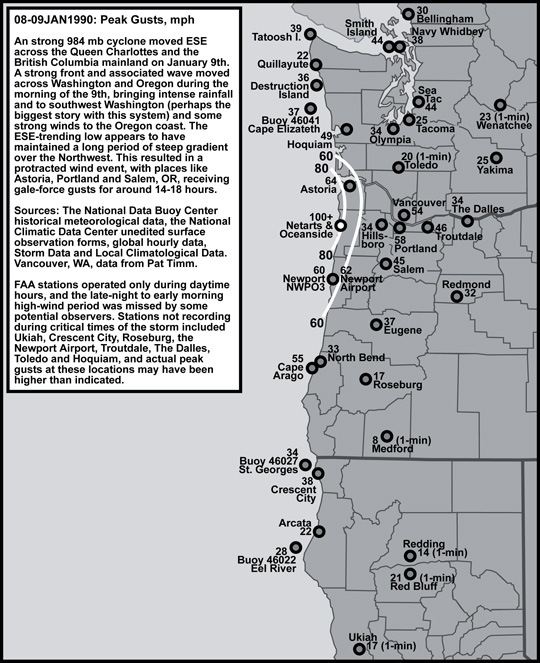
Figure 4: Peak gusts, January 8-9, 1990. |
|
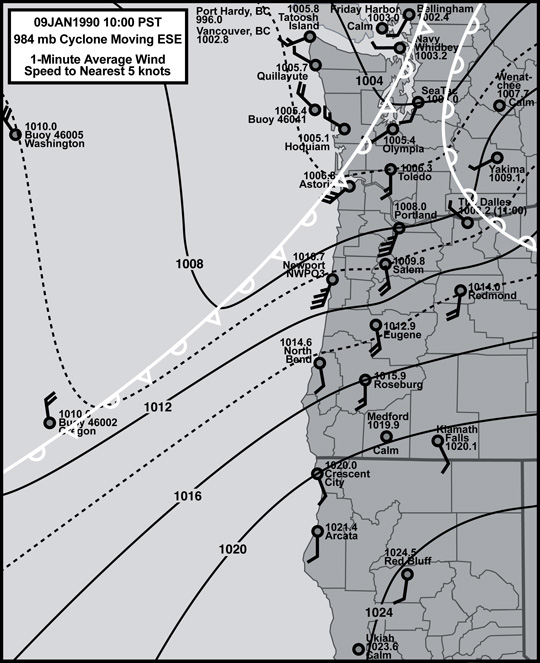
Following right on the heels of the fast-moving January 7-8 storm, a strong 984 mb cyclone moved ESE over the Queen Charlotte Islands and into interior British Columbia. The low's associated front reached the Washington coast on the morning of the 9th. A triple-point wave developed on this boundary and slowly moved across southern Vancouver Island, helping establish a fairly strong north-south pressure gradient over Oregon and Washington. The trailing front reached far out into the Pacific, and appears to have had a good "moist conveyer" with a tropical connection. Moisture from Typhoon Jack, December 21-28, 1989, may have been involved with this system. This front moved very slowly, and, indeed, has all the hallmarks of a classic, juicy and nearly stalled-out baroclinic band, the kind typically responsible for heavy rain events. This moist band had plenty of convective activity, as indicated by persistent 0.25" to 0.50" hourly-rainfall, even at lowland locations. This convection contributed to a fairly sharp reduction of pressure along the boundary. The band draped over a high pressure ridge that resided in California, and a strong pressure gradient developed south of the boundary right over northwest Oregon. As the strong Queen Charlotte cyclone moved across central British Columbia, Alberta and Saskatchewan, slowly degrading to 988 mb by the morning of the 10th, and the associated baroclinic band slowly pushed southeast-ward over the Pacific Northwest, the sharp pressure gradient persisted for much of the day on the 9th. A protracted strong wind event resulted, with some stations reporting gale-force wind gusts for 14-18 hours. Northwest Oregon and southwest Washington were under the most extreme gradient with this event, and had the highest winds. The coastal strip in Oregon's Tillamook and Clatsop Counties suffered the strongest wind gusts, with unofficial readings topping 100 mph in some places. These winds, on the south side of the tropically-connected baroclinic band, occurred with some very warm temperatures--for January--and some locations reported low-60ºF highs during the day. The peak gusts for this slow-moving January 8-9, 1990 system are outlined in Figure 4, above. The strongest winds were focused on a very narrow strip of land along the Oregon's northwest coast, with unofficial readings exceeding 100 mph. Astoria reported a peak gust of 64 mph, and experienced 25 mph and higher 1-minute winds from 21:00 on the 8th to 10:00 on the 9th, with a brief lull into the 15-24 mph range around 23:00 to midnight. The north Willamette Valley also experienced some strong gusts, especially right in the Portland vicinity. Portland had a peak gust of 58 mph, and 1-minute wind speeds of 25 mph and higher from 22:00 on the 8th to 14:00 on the 9th, including a number of excursions in the range of 35-40 mph. Interestingly, maximum gusts at neighboring stations, Hillsboro, Troutdale and Salem, were generally in the 35 to 45 mph range, considerably lower than the measurements at the Portland Airport. Figure 5, below, is an interpretation of surface observations at 10:00 PST on January 9, 1990, which is near the time of maximum winds at Portland, and at the close of the strong gusts in Astoria. The long baroclinic band draped over the California high-pressure cell is quite evident as a sharp turn of the isobars along the region of steep pressure gradient in Oregon and over the Pacific Ocean. A leading warm front, which reaches to a triple-point to the north off of the map, is far inland by this time. Much Oregon, and a narrow sliver of Washington is in the strong warm sector. This is the zone where the fastest winds occurred for any given location, the magnitude of which being dependent on a given station's location with respect to the steepest pressure gradients. Note the sharp drop-off in wind speed just north of Portland, in an area of more relaxed gradient over Washington. The reduction in wind speed south of Portland is more gradual, as much of the state is under a fairly tight gradient. The strong S to SSW winds in the warm sector shut down at each station as the baroclinic band gradually shifted eastward and, a cooler NW flow arrived. |
|
Figure 5: Surface analysis map for 10:00 PST, January 9, 1990. |
|
As mentioned, the frontal system brought copoious rainfall to the Pacific Northwest, especially in western Washington. Olympia, WA, for example, had 2.40" of rain in the six hours ending at 10:00 on the 9th, with hourly rates as high as 0.49". This followed 1.65" of rain in the 24-hours ending 04:00 on the 9th. The Sea-Tac Aiport also ended up under this area of heavy rain, and had 2.05" in the same 6-hours ending 10:00 on the 9th. Further to the south, Astoria reported 1.50" of rain in the 6-hours ending 04:00 on the 9th, 1.54" of rain in the 6-hours ending 10:00, and 1.42" in the 6-hours ending 16:00. By 22:00 on the 9th, Astoria's 24-hour rain total had climbed to 4.91". Indeed, for the four days January 6-10, 1990, much of Oregon's Coast Range received 10 to 15 inches of rain, and many lowlands areas of Washington and Oregon were drenched with 4 to 8 inches. All this rain in just six hours on the 9th, on top of already soaked soils, resulted in damaging mudslides and major river flooding. The Chehalis, Skookumchuck, Nisqually, Puyallup, White, Cedar, Skykomish, Snoqualmie, Snohomish and Cowlitz Rivers all rose above flood stage. The flood of record (up to 1990) was observed on three separate gauges along the Chehalis River. At Chehalis, the river reached 8.5 feet above flood stage. Three thousand people had to evacuate the town of Cehalis as the water inundated the region, including a 2-mile stretch of Interstate-5. The road remained closed for four days. At the inundated Chehalis Airport, 75 planes suffered water damage. Neighboring Centrailia didn't fare much better as the Skookumchuck spilled over roads and around homes. Two people drowned in the Chehalis area, and one in Tacoma. Aside from I-5, thirteen state highways and many county roads were closed due to flooding and mudslides. Echoes: January 6-9, 1990 and December 1-3, 2007 This combination of a protracted period of strong winds on January 9, 1990, with gale-force gusts striking places like Astoria and Portland for over 12 hours, combined with very heavy rain and major flooding in southwest Washington and northwest Oregon echoes quite strongly the last storm in the incredbily damaging December 1-3, 2007 series. Indeed, with the aid of hindsight, the entire storm sequence of January 6-9, 1990 looks like a heads-up to the potential for a similar sequence of even stronger events, which is largely what happened from December 1-3, 2007. The two seqences, Jan 1990 and Dec 2007, are compared later in this document. There are some striking similarities, and also significant differences. When exploring the plethora of Pacific Northwest weather events, it is interesting to consider this question: What other storms have happened in moderate to strong form that might later manifest in a truly extreme manner at some point in the future? An acknowledgement: I thank Steve Pierce, a fellow weather enthusiast, for initially pointing out the similarities between Jan 1990 and Dec 2007, even as the December gale began to unfold. Indeed, he's been urging me for years to do an analysis of the Jan 1990 storm sequence. Here it is. |
|
January 6-9, 1990: Comparative Meteorological Details |
|
Storm Tracks
|
|
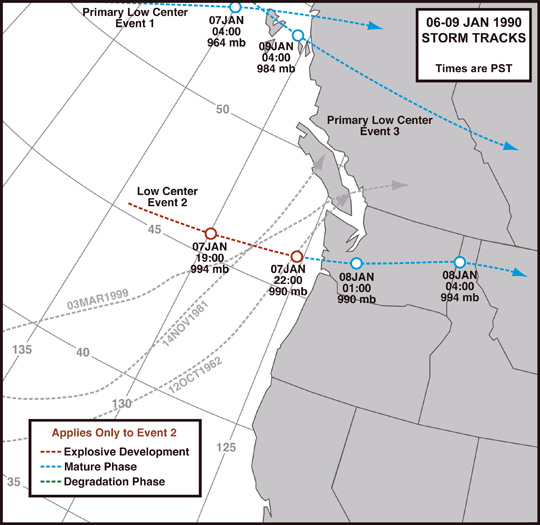
Figure 6, above, outlines the storm tracks for the three events of January 6-9, 1990. The first and third events were associated with frontal systems that trailed far south of the parent lows. Only the second event involved the close passage of an extratropical cyclone. Indeed, the January 7-8, 1990 storm rushed right into Washington with only a mild slowdown before continuing eastward at a very rapid pace. Queen Charlotte lows rarely produce damaging storms in Washington and Oregon; during January 6-9, 1990, two such systems interacted strongly with the region (Events 1 and 3). |
|
General Storm Data Minimum Pressures and Peak Gradients Tables 1a, b and c, below, lists the lowest sea-level pressures achieved during the three storm events from January 6-9, 1990 for 11 Pacific Northwest locations. The pressure minimums for all three storms are fairly typical for Northwest weather systems, and none of these events stand out. For the region, readings in the 990 to 1010 mb range typically happen several times each storm season. Source: Pressure data is from the National Climatic Data Center, Global Hourly Data. |
|
||||||||||||||||||||||||||||||||||||||||||||||||||||||||||||||||||||||||||||||||||||||||||||||||||||||||||||||||||||||||||||||||||||||||||||||||||||||||||||||||||||||||||||||||||||||||||||||||||||||||||||||||||||||||||||||||||||
|
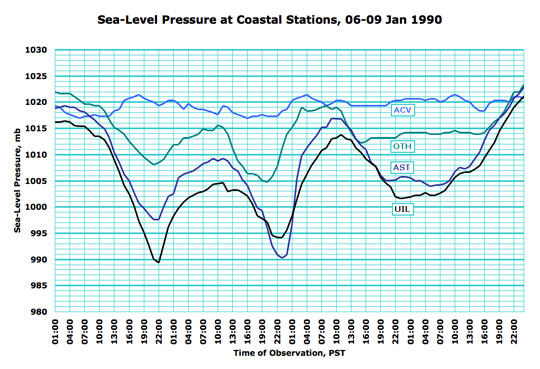
Figure 7, below, depicts the sea-level pressure readings for coastal stations during January 6-9, 1990 storms. The first event pushed the barometric pressure at Quillayute the lowest, whereas the second even carried the barometer lower at Astoria. Notice the pressure trace at Arcata, CA: This station barely felt the influence of the three storms, the mark of persistent high pressure over California, and a contributor to the sharp gradients over the region. Thus one of the mechanisms for the three strong wind events is revealed. |
|
|
|
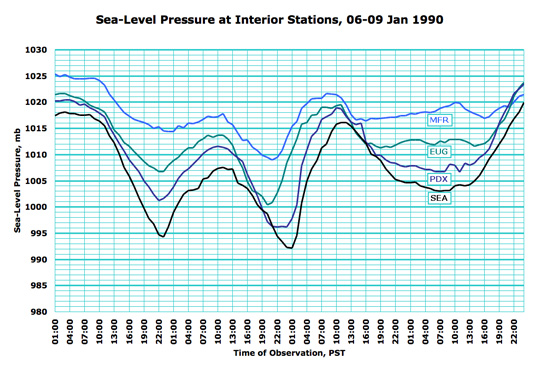
Figure 8, below, depicts the sea-level pressure readings for interior stations during the January 6-9, 1990 storms. As with the coastal stations, pressure minima during the first event occurred almost simultaneously going south to north, the mark of a front that almost perfectly paralleled the coastline. During the second event, barometric pressure at Eugene began climbing well ahead of Portland, a feature that resulted in an extreme gradient between the two stations (more on this below). Eugene's lowest pressure clearly occurred at frontal passage, whereas, for Portland the minimum occurred with the close-passage of the low behind the front. After passing southeast of Eugene, the storm's frontal system took some time to reach Medford, which is why the pressure started climbing at Medford about an hour after Eugene. The third event in the storm series proved more shallow than the first two, but the pressure depression, and differences between the stations, persisted for much longer. |
|
|
|
Tables 2a, b and c, below, lists the maximum pressure gradients achieved during the three January 1990 windstorms. Extremely low pressures aren't required to create steep gradients (though very low pressure certainly can help), and in some instances the storms of January 6-9, 1990 established noteworthy pressure differences. The January 6-7, 1990 cold front doesn't appear to have created extreme short-distance gradients, but the longer measures of +22.4 mb for ACV-AST and +29.9 mb for ACV-UIL are quite sharp, and approach values for some strong windstorms. For example, for the ACV-AST gradient, the January 15-16, 2000 classic sou'wester had a peak of +21.6 mb, the March 2-3, 1999 windstorm peaked at +25.2 mb, and the February 13, 1979 "Kitsap Blowdown" peaked at +16.1 mb. However, a number of major windstorms pushed the ACV-AST to much higher extremes than the January 6-7, 1990 storm: +33.0 mb during the Columbus Day Storm of 1962, +31.2 mb during the November 13-14, 1981 classic sou'wester, and +33.0 mb during the extremely deep December 12, 1995 storm. The January 7-8, 1990 cyclone, owing to its track and being near peak intensity at landfall, managed to create some very extreme gradients, especially among some of the shorter measures. The peak ACV-AST measure of +28.0 mb exceeded many past windstorms, and approached values for major events, some of which are outlined in the paragraph above. The peak EUG-PDX measure of +13.0 mb is among the highest on record. The EUG-PDX record-setters are other Storm-King-type events: +15.2 mb during the deep December 4, 1951 cyclone, +13.0 mb during the very similar February 5, 1965 windstorm, and +13.7 mb during the early-Autumn October 2, 1967 windstorm. The January 8-9, 1990 baroclinic band, generally speaking, produced the weakest gradients among the series of three storms. However, the EUG-PDX measure ended up a little stronger during this event than the January 6-7, 1990, and this appears to have supported somewhat faster winds, especially in the north Willamette Valley. The OTH-AST measure across much of the Oregon Coast was similar between the first and third storms, but note how the second event produced a gradient value more than double for the OTH-AST measure. Given this fact, it is interesting that the third storm produced reports of triple-digit gusts on the north coast, whereas similar reports are lacking for the second storm. Arguably, local gusts on the coast were probably much higher during the second storm than the measures available in the record. |
|
||||||||||||||||||||||||||||||||||||||||||||||||||||||||||||||||||||||||||||||||||||||||||||||||||||||||||||||||||||||||||||||||||||||||||||||||||||||
|
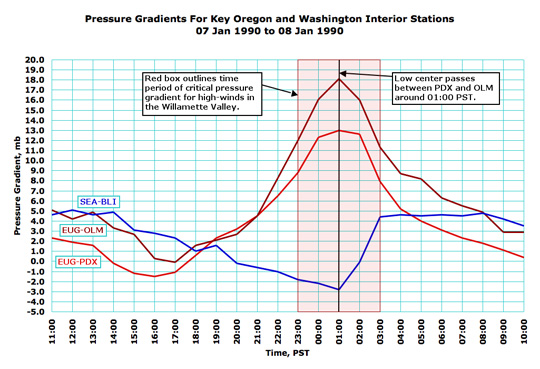
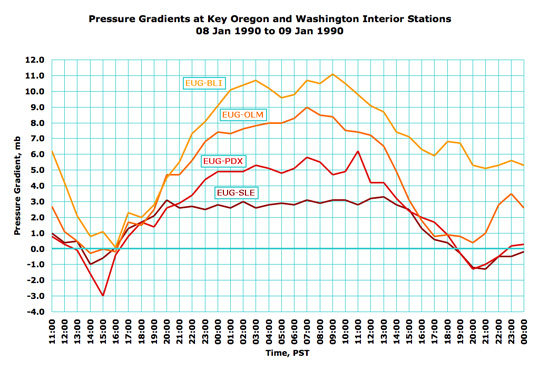
Figure 9, below, depicts some interior pressure gradient readings for the January 7-8, 1990 windstorm. The hour that the storm center passes between Portland and Olympia, 01:00 PST, is quite clear in a strong peak in the EUG-PDX and EUG-OLM measures coinciding with a modest valley for the SEA-BLI measure. A critical high-wind "window" encompassed five observation periods betwen 23:00 and 03:00, with the EUG-PDX gradient at +8 mb and higher. Maximum winds in the Willamette Valley occurred during this time. |
|
|
|
Figure 10, below, depicts some interior pressure gradient readings for the January 8-9, 1990 windstorm. The long period of moderate gradient is evident in this graph. The EUG-PDX measure hovered around +5 mb for around 12 hours. |
|
|
|
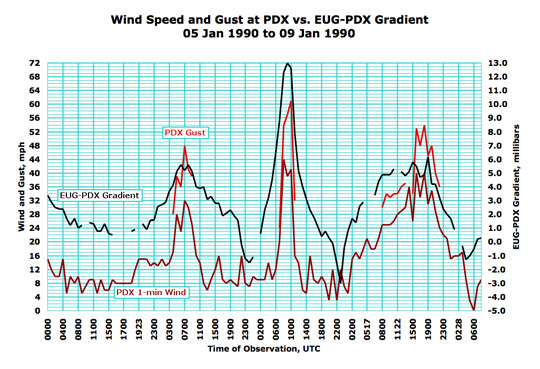
Figure 11, below, compares the EUG-PDX gradient to the wind speeds measured at the Portland International Airport. The Janaury 6-9, 1990 storm sequence provides a striking example of the correlation between wind speed and gradient in the Willamette Valley. Generally speaking, as the EUG-PDX gradient climbed with each storm, winds also escalated. Interestingly, the January 7-8, 1990 storm (Event 2), despite producing a gradient twice that of either the preceeding or following storms, didn't produce twice the wind speed. More than one variable, such as pressure gradient, controls the strength of wind at a given location. The January 8-9, 1990 windstorm's long period of wind and moderate gradient is quite evident when compared to the narrow impulse produced by the January 7-8, 1990 cyclone. |
|
|
|
Pressure Tendencies Tables 3a, b and c, below, list the maximum hourly pressure falls and rises achieved during the three windstorms of January 6-9, 1990 for 11 Pacific Northwest stations. The January 6-7, 1990 cold front moved barometers fairly sharply in Washington, with weaker effect in Oregon and northern California. Many of the values are fairly typical of Northwest weather-makers, which, perhaps the rapid pressure changes in Quillayute and Bellingham being a little unusual. They mark a strong front. Locations close to the center of the January 7-8, 1990 cyclone experienced extreme barometric pressure changes. The pressure climbs of +8.6 mb/hr at Astoria, +7.5 mb/hr at Portland and Olympia and +6.1 mb/hr at Sea-Tac are on par with many major windstorms such as the Inauguration Day storm of 1993 and the Columbus Day Storm of 1962. Though quite unusual, the high values that occurred on January 7-8, 1990 still fall short of the all-time extremes, such as the +16.6 mb/hr surge at North Bend during the November 9-10, 1975 cyclone. Pressure tendencies during the January 8-9, 1990 storm fall within a fairly typical range for winter storms in the Northwest. |
|
|||||||||||||||||||||||||||||||||||||||||||||||||||||||||||||||||||||||||||||||||||||||||||||||||||||||||||||||||||||||||||||||||||||||||||||||||||||||||||||||||||||||||||||||||||||||||||||||||||||||||||||||||||||||||||||||||||||||||||||||||||||||||||||||||||||||||||||||||||||||||||||
|
Peak Wind and Gust Tables 4a, b and c, below, list the peak wind and gust for eleven key stations in the Pacific Northwest, their direction, and their time of occurrence. "Peak Wind" is a 1-minute average, and "Peak Gust" is an instantaneous (1-second) reading. By my own personal methodology, a wind event rates the term "windstorm" when the average peak gust of these eleven stations reaches 39.0 mph (gale force) or higher. This ranking favors those storms that follow a northward path close to the U.S. Pacific Coast, and for good reason--such storms affect the largest land area, and therefore are potentially the most destructive. An average peak gust of 41.9 mph for the January 6-7, 1990 cold front and 39.6 mph for the January 7-8, 1990 cyclone, place both these systems barely into windstorm category, and are considered "minor windstorms". The January 8-9, 1990 event, with 36.2 mph for the average peak gust, doesn't even make it into windstorm category. The January 6-7, 1990 cold front struck much of the Pacific Northwest fairly uniformly, with generally moderate gust speeds of 25 to 45 mph. This explains the storm's 41.9 mph ranking. The January 7-8, 1990 cyclone struck a very narrow region of northwest Oregon quite strongly, and other areas such as in Washington fairly weakly, which results in the low ranking. Mesoscale events are not favored by this ranking system. However, the number is certainly useful when comparing storms that followed similar tracks. Going from weakest to strongest: 37.3 mph for January 10-11, 1988, 44.1 mph for February 5, 1965, 46.3 mph for October 2-3, 1967, 46.8 mph for March 27, 1963 and 54.5 mph for December 4, 1951. With 39.6 mph, the January 7-8, 1990 cyclone is at the lower end of the range for significant Storm King events. The high-wind significance of the January 8-9, 1990 baroclinic band is not in the overall effect across the Pacific Northwest, but in the long duration of gale-force to high-wind criteria gusts over a small region in northwest Oregon. The location of the region struck by the high winds and the gale's long duration are reminiscent of the devastating December 2-3, 2007 "Great Coastal Gale," though at a lower level. Due to the importance of high-wind duration--especially for tree damage--it may be useful to develop a ranking system that incorporates the duration of wind events. This will likely be explored here at some point in the future. |
|
Table 4a: January 6-7, 1990 Windstorm Peak Wind and Gust
|
||||||
| Location |
Peak |
Direction |
Obs Time of |
Peak |
Direction |
Obs Time of |
| California: | ||||||
| Arcata [1] |
20 |
130º |
06:00 HRS, 6th |
23 |
160º |
17:00 HRS, 6th |
| Oregon: | ||||||
| North Bend [2] |
23 |
180º |
23:00 HRS, 6th |
34 |
180º |
23:00 HRS, 6th |
| Astoria |
38 |
180º |
19:00 HRS, 6th |
62 |
180º |
19:00 HRS, 6th |
| Medford |
23 |
140º |
21:00 HRS, 6th |
33 |
140º |
21:00 HRS, 6th |
| Eugene [3] |
28 |
210º |
00:00 HRS, 7th |
39 |
180º |
23:00 HRS, 6th |
| Salem |
41 |
180º |
22:00 HRS, 6th |
54 |
180º |
22:00 HRS, 6th |
| Portland |
32 |
180º |
23:00 HRS, 6th |
48 |
180º |
22:00 HRS, 6th |
| Washington: | ||||||
| Quillayute |
25 |
180º |
22:00 HRS, 6th |
39 |
180º |
22:00 HRS, 6th |
| Olympia |
21 |
180º |
22:00 HRS, 6th |
34 |
180º |
23:00 HRS, 6th |
| Sea-Tac |
37 |
220º |
01:20 HRS, 7th |
41 |
180º |
01:20 HRS, 7th |
| Bellingham [4] |
32 |
170º |
00:00 HRS, 7th |
54 |
180º |
23:00 HRS, 7th |
| AVERAGE |
29.1 |
41.9 |
||||
| Notes:
Figures in italics are estimates and subject to change. [1] The 23 mph gust for Arcata is the last of several occurrences, with the earliest happening at 00:00 on the 6th. [2] The 23 mph wind for North Bend is the last of three occurrences, with the other two happening at 16:00 and 19:00 on the 6th. [3] The 28 mph wind for Eugene is the last of two occurrences, with the other happening at 23:00 on the 6th. [4] The 32 mph wind for Bellingham is the last of two occurrences, with the other happening out of 180º at 23:00 on the 6th. |
||||||
|
Table 4b: January 7-8, 1990 Windstorm Peak Wind and Gust
|
||||||
| Location |
Peak |
Direction |
Obs Time of |
Peak |
Direction |
Obs Time of |
| California: | ||||||
| Arcata [1] |
25 |
220º |
16:00 HRS, 7th |
36 |
210º |
00:00 HRS, 8th |
| Oregon: | ||||||
| North Bend [2] |
29 |
220º |
20:00 HRS, 7th |
39 |
230º |
23:00 HRS, 7th |
| Astoria |
29 |
310º |
01:09 HRS, 8th |
48 |
310º |
01:09 HRS, 8th |
| Medford |
22 |
210º |
02:00 HRS, 8th |
31 |
260º |
00:00 HRS, 8th |
| Eugene [3] |
35 |
220º |
23:00 HRS, 7th |
58 |
220º |
22:00 HRS, 7th |
| Salem |
35 |
220º |
23:00 HRS, 7th |
61 |
220º |
23:00 HRS, 7th |
| Portland |
44 |
220º |
00:00 HRS, 8th |
63 |
220º |
02:00 HRS, 8th |
| Washington: | ||||||
| Quillayute [4] |
14 |
250º |
05:25 HRS, 8th |
18 |
250º |
05:25 HRS, 8th |
| Olympia |
18 |
340º |
02:00 HRS, 8th |
28 |
340º |
02:00 HRS, 8th |
| Sea-Tac [5] |
21 |
200º |
07:21 HRS, 8th |
29 |
200º |
07:21 HRS, 8th |
| Bellingham [6] |
16 |
200º |
11:00 HRS, 8th |
25 |
220º |
10:00 HRS, 8th |
| AVERAGE |
26.2 |
39.6 |
||||
| Notes:
Figures in italics are estimates and subject to change. [1] The 36 mph peak gust for Arcata is the last of two occurrences, with the other happening out of 210º at 22:00 on the 7th. [2] The 39 mph peak gust for North Bend is the last of two occurrences, with the other happening out of 220º at 22:00 on the 7th. [3] The 35 mph wind for Eugene is the last of two occurrences, with the other happening at 22:00 on the 7th. [4] The 14 mph wind for Quillayute is the last of three occurrences, with the others happening at 04:00 and 05:00 out of 270º and 250º (respectively) on the 8th. [5] The 28 mph peak gust for Sea-Tac is the last of two occurrences, with the other happening out of 330º at 03:00 on the 8th. [6] The 16 mph wind for Bellingham is the last of three occurrences, with the others happening at 08:00 and 09:00 out of 190º and 180º (respectively) on the 8th. The 25 mph peak gust is the last of two occurrences, with the other happening out of 180º at 09:00 on the 8th. |
||||||
|
Table 4c: January 8-9, 1990 Windstorm Peak Wind and Gust
|
||||||
| Location |
Peak |
Direction |
Obs Time of |
Peak |
Direction |
Obs Time of |
| California: | ||||||
| Arcata |
17 |
150º |
12:00 HRS, 9th |
21 |
190º |
17:20 HRS, 8th |
| Oregon: | ||||||
| North Bend |
29 |
170º |
12:00 HRS, 9th |
33 |
170º |
12:00 HRS, 9th |
| Astoria |
37 |
190º |
08:30 HRS, 9th |
64 |
180º |
05:00 HRS, 9th |
| Medford [1] |
8 |
130º |
23:30 HRS, 9th |
10 |
130º |
23:30 HRS, 9th |
| Eugene |
25 |
180º |
08:00 HRS, 9th |
37 |
180º |
08:00 HRS, 9th |
| Salem |
31 |
180º |
13:00 HRS, 9th |
45 |
180º |
13:00 HRS, 9th |
| Portland [2] |
40 |
200º |
10:00 HRS, 9th |
58 |
200º |
10:00 HRS, 9th |
| Washington: | ||||||
| Quillayute |
13 |
300º |
17:00 HRS, 9th |
22 |
300º |
17:00 HRS, 9th |
| Olympia |
23 |
220º |
12:00 HRS, 9th |
34 |
220º |
12:00 HRS, 9th |
| Sea-Tac [3] |
26 |
190º |
11:24 HRS, 9th |
44 |
190º |
11:24 HRS, 9th |
| Bellingham |
20 |
220º |
19:00 HRS, 9th |
30 |
220º |
19:00 HRS, 9th |
| AVERAGE |
24.5 |
36.2 |
214º |
|||
| Notes:
Times in italics are estimates and subject to change. [1] Peak wind of 8 mph at Medford is last of three occurrences, with the others happening at 14:00 and 15:00 out of 360º on the 8th. Gust is estimated using a 1.3 gust factor. [2] Peak wind of 40 mph at Portland is last of two occurrences, with the other happening at 08:00. [3] The 36 mph peak gust for Sea-Tac is the last of two occurrences, with the other happening out of 190º at 11:24 on the 8th. |
||||||
|
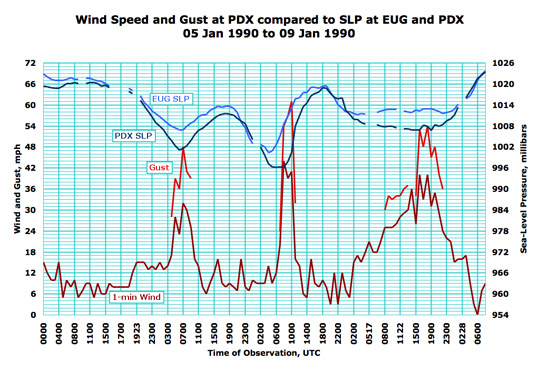
Examination of Storm Sequence at Portland, OR Figure 12, below, compares 1-minute wind and instant gust speeds at Portland International Airport to sea-level pressure measurements taken at Portland and Eugene for the January 6-9, 1990 storm events. The pressure trends offer a means of tracking the storm's proximity to the station, revealing when the peak wind response occurs. Note that, for all three events, regardless of the breadth of the "impulse" (the duration of the event), maximum winds occurred right around the point where the barometric pressure began to rise. Comparing the difference between the two Willamette Valley stations is a way of seeing the pressure gradient, which is depicted more directly in Figure 11, above. When the separation between the two stations becomes strong, the winds escalated. Interestingly, for third event, the January 8-9, 1990 baroclinic band, there's a spike in wind without an accompanying increase in the pressure differential between Eugene and Portland: a gradient that supported gusts of 30 to 37 mph beforehand suddenly supported gusts of 46 to 54 mph. Perhaps the proximity of the frontal boundary, and the orientation of the pressure gradient (isobars) explains, in part, this difference. |
|
|
|
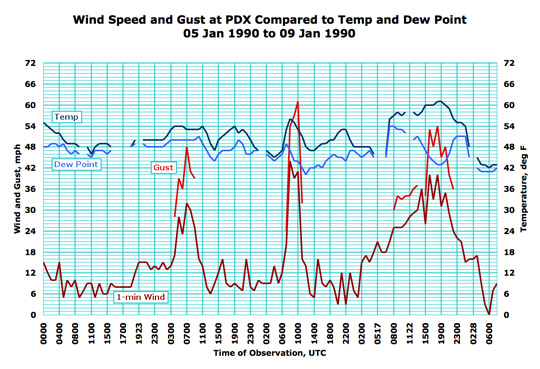
Figure 13, below, compares 1-minute wind and instant gust speeds to temperature and dew point measurements, all taken at Portland International Airport during the January 6-9, 1990 storm events. Commonly, temperature will climb during the high-wind phase of a Northwest storm. This is often because the strongest gradients with a suitable orientation tend to occur in the warm advection field (warm sector) ahead of incoming Pacific fronts, and often on the southeast side of cyclones. A decent indicator of the arrival of warm air moving up from southerly reaches is a dew point that climbs somewhat with the temperature. If the dew point drops sharply during the warming phase, or stays relatively unchanged, then it may reflect strong downdrafts: In this case, vertical mixing may be contributing to the wind speeds and may be enhancing values above those expected from surface pressure gradients alone. In the sequence below, the air ahead of the January 6-7, 1990 cold front warmed slightly to 54ºF along with a weak dew point rise to 51ºF. Looks like a standard warm advection field. The January 7-8, 1990 cyclone caused a sudden warming from 47ºF (at 06:00 UTC, or 22:00 on the 7th in PST) to 56ºF, accompanied by a slight dew point rise from 46ºF to 49ºF. The dew point begins to drop sharply before the temperature responds, and is down to 44ºF during the temperature high of 56ºF. It's a reasonable assumption that strong vertical mixing, with a large area of descending air, occured in close proximity to the passing cyclone's center. Such downdrafts may have contributed to measured wind speeds, but note that this storm produced more than sufficient pressure gradient to generate the measured wind speeds. For the January 8-9, 1990 baroclinic band, some very warm, moist air arrives around 08:00 UTC (midnight, PST) on the 9th in a wet, moist warm-advection scenario. Temperature and dew point rise sharply. Then, with the temperature gradually climbing toward a very warm 61ºF, the dew point falls to 43ºF. With the strong convection along the band just to the north of Portland (evident in the heavy rain that occured to the north), it appears that a large region of air was descending right over Portland, and, in fact over much of western Oregon, as supported by observations at other stations. It is interesting that the strongest winds occurred in Portland at this time. As indicated in Figure 12, above, the pressure gradient didn't change much between 08:00 and 22:00 UTC (midnight and 14:00) on the 9th. Yet there's a sharp escalation in wind speed at Portland after 15:00 UTC (07:00 PST). Perhaps strong vertical mixing, which may have carried wind momentum from the upper-atmosphere downward over the north Willamette Valley, is a decent explanation for the wind escalation at Portland that occurred after 15:00 UTC. Airflow at 1,000 to 5,000 feet tends to be much faster than surface wind speeds, especially during storms. Proximity to the strong convection along the baroclinic band likely determined the strength of the downdrafts, and how effectively upper winds were mixed down, which explains the lower wind speeds just to the south, at Salem and Eugene. A weakening of the band as it slowly progressed southeast over Oregon may have resulted in reduced mixing, which could have lowered the potential for high-wind criteria speeds at the southern stations. |
|
|
|
Analysis: January 6-9, 1990 Compared to December 1-3, 2007 |
|
This section in progress. |
|
Last Modified: February 6, 2008 | Back | |